
With Six Sigma, a teacher and mentor is known as a Green Belt.
The master production schedule (MPS) is a major input for the MRP process.
Suppliers are upstream members of a supply chain.
The shortest processing time (SPT) rule is most useful when the job shop is not
congested.

Inventory management is concerned with how much to order and when to order.
Capacity requirements planning (CRP) projects the load from a given material plan
onto the capacity of a system.
Two key elements of project control are time management and cost management.
The systematic analysis of work methods is known as operations research.

Sharing demand forecasts with supply chain members has resulted in an increased
bullwhip effect.
Products designed to withstand variations in operating conditions are said to be robust.
It is widely accepted that the effective design and the efficient operation of services are
critical to the health of the U.S. economy.
Order winners and order qualifiers change over time in response to the dynamics of
changing market conditions.

Hedging involves buying larger amounts of inventory in anticipation of future price
increases.
With a product layout the purpose of line balancing is to equalize the amount of work at
each workstation.
Producing items before they are needed is considered waste under the principles of lean
production.
Dependent demand is determined by external market conditions.

The quantities displayed on a master production schedule represent production and not
actual demand.
Waiting lines form only when service operations are understaffed.
The process of assigning work to limited resources is known as scheduling.
One way to deal with the bullwhip effect is to develop and share the forecasts with
other supply chain members.

Which of the following statements concerning average error is true?
a. A positive value indicates high bias, and a negative value indicates low bias.
b. A positive value indicates zero bias, and a negative value indicates low bias.
c. A negative value indicates zero bias, and a negative value indicates high bias.
d. A positive value indicates low bias, and a negative value indicates high bias.
A load profile compares
a. requirements for all lower-level items to higher-level items.
b. cumulative lead times to projected lead times.
c. the quantities in which items should be produced to actual demand.
d. released and planned orders with work center capacity.
Control charts are typically used at the ___________ of a process.
a. beginning.
b. middle.
c. end.

d. All these answer choices are correct.
The ______________________ for a facility is the percent of capacity utilization that
minimizes cost.
a. best operating level
b. capacity cushion
c. diseconomies of scale
d. economies of scale
The _______________ probability distribution is typically used to describe uncertain
activity times in a project.
a. beta
b. normal
c. binomial
d. exponential

________________ demand is a key to providing good-quality service.
a. Predicted
b. Forecasted
c. Anticipated
d. Unknown
Achieving a company’s strategic goals for quality and customer satisfaction require
a. team work.
b. group participation.
c. both team work and group participation.
d. None of these answer choices is correct.
Fitting the task to the employee in a work environment is known as
a. motivation.
b. worker analysis.
c. ergonomics.
d. task analysis.
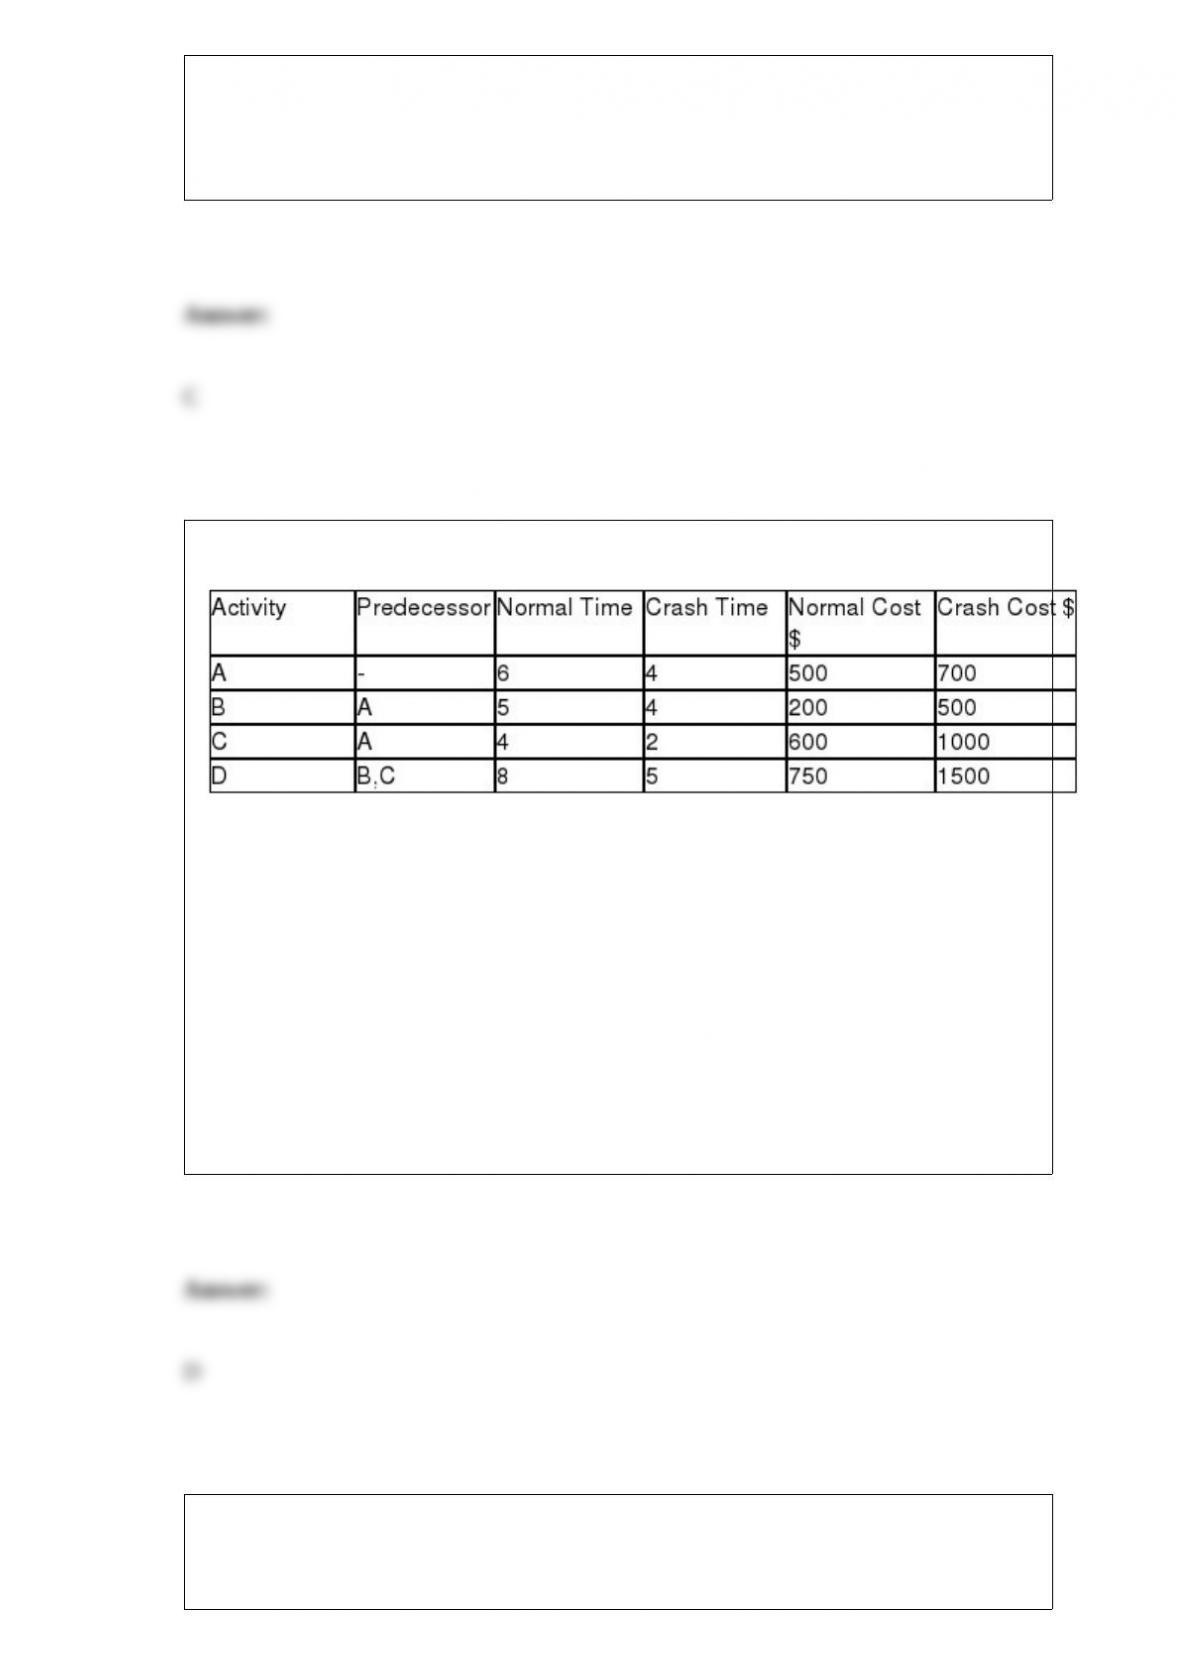
A project consists of the following four activities with activity times in days:
Table CC
What is the crash cost per day for activity B?
a. 100
b. 200
c. 250
d. 300
A company is evaluating which of two alternatives should be used to produce a product
that will sell for $35 per unit. The following cost information describes the two
alternatives
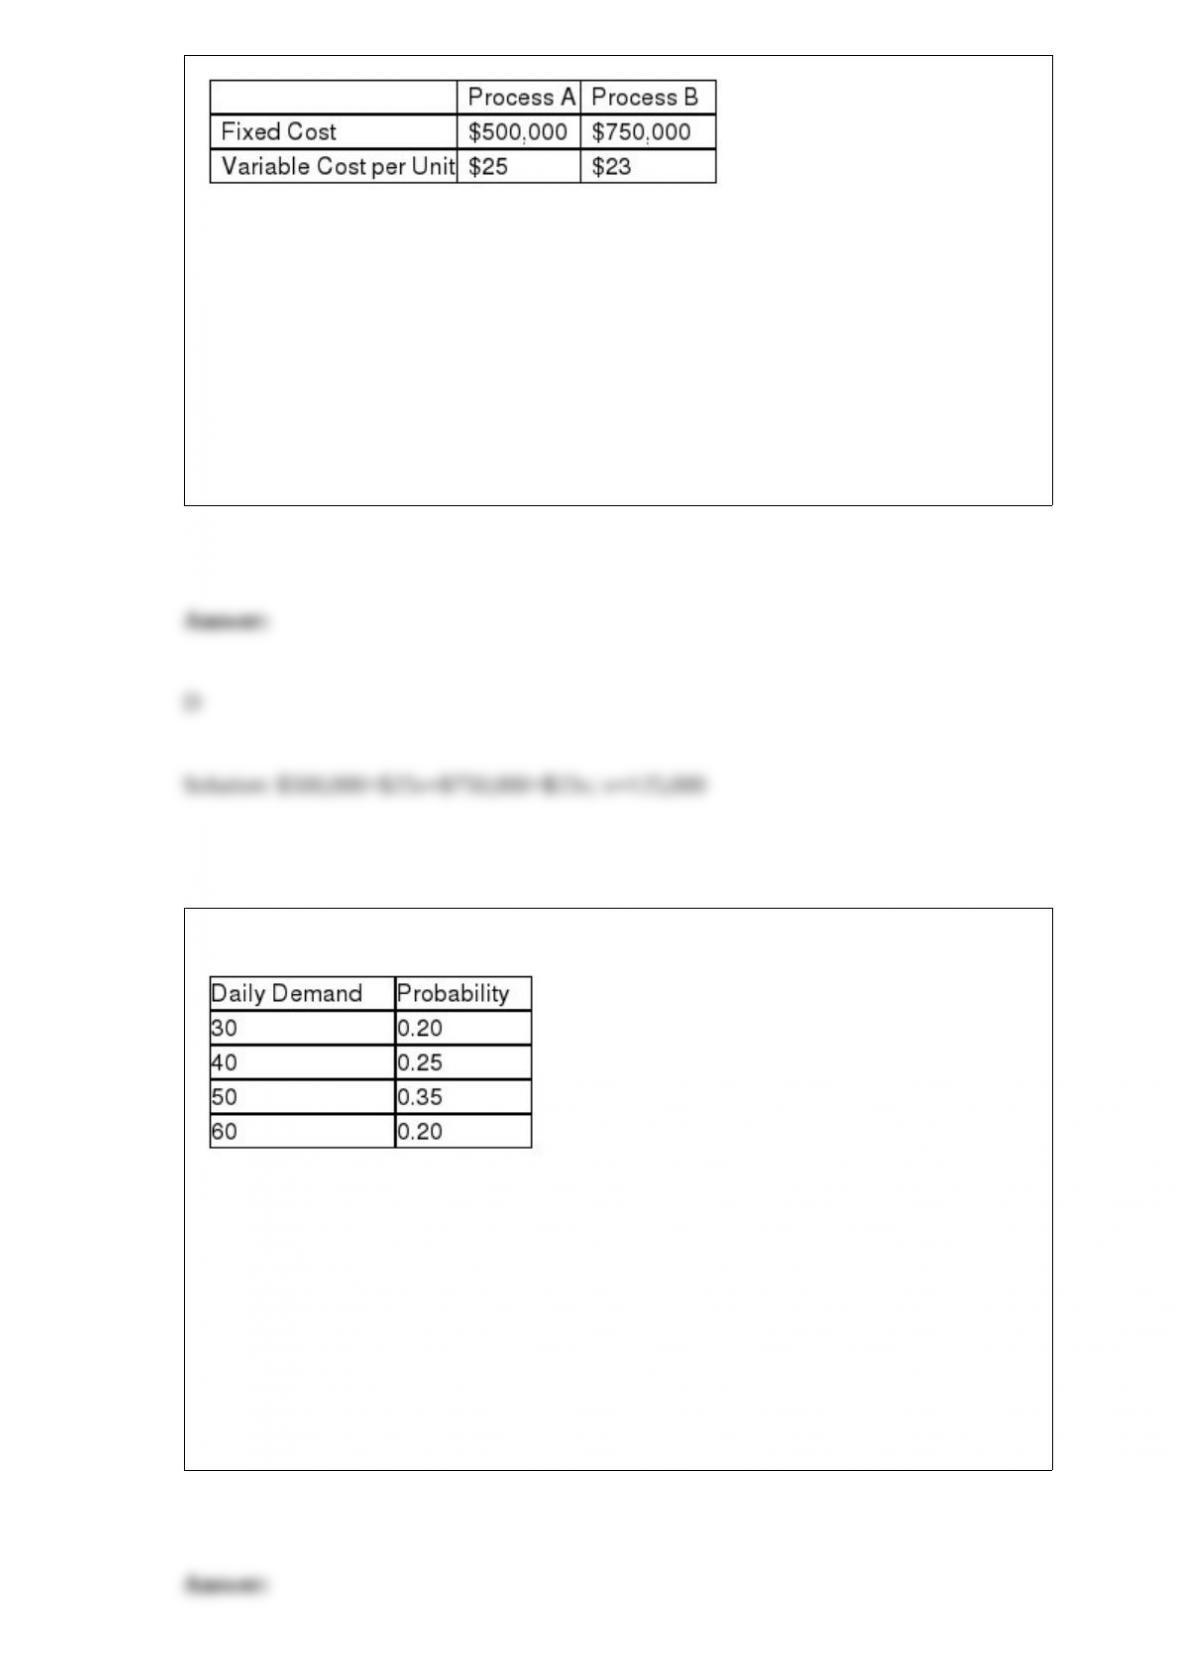
For what level of volume (output) would the firm prefer Process A to Process B?
a. for all volume levels greater than 75,000
b. for all volume levels greater than 97,500
c. for all volume levels greater than 117,500
d. for all volume levels greater than 125,000
The daily demand for a company’s product follows the probability distribution below.
The expected value, or average, weekly demand is
a. 41.50.
b. 45.50.
c. 47.75.
d. 51.75

A(n) ______________ breaks down a project into components, subcomponents,
activities, and tasks.
a. work breakdown structure (WBS)
b. scope statement
c. responsibility assignment matrix (RAM)
d. organizational breakdown structure (OBS)
Which of the following is not a feature of a warehouse management system?
a. warehouse optimization
b. order tracking
c. vendor management
d. custom labeling and packaging
The fraction of orders filled by a distribution center or warehouse within a specific time
period is referred to as the

a. inventory turnover.
b. inventory supply time.
c. fill rate.
d. aggregate orders processed.
Which of the following is not a standard label of the symbols used for the construction
of a process flowchart?
a. Improve
b. Transport
c. Operation
d. Delay
Mixed-model sequencing
a. facilitates total productive maintenance.
b. supports uniform production levels.
c. increases product lead times.
d. reduces worker productivity.

Which mode of transportation transports products in liquid form?
a) pipeline
b) ocean by ship
c) pipeline and ocean by ship
d) airline
One way to reduce the bullwhip effect is for supply chain members to
a. make ordering decisions independently of each other.
b. create demand forecasts independently of other supply chain members.
c. share demand forecasts with other supply chain members.
d. restrict information flows between supply chain members.
Consider an espresso stand with a single barista. Customers arrive at the rate of 20 per
hour according to a Poisson distribution. Service times are exponentially distributed

with a mean service time of 2 minutes per customer. What is the service rate per hour
for the espresso stand?
a. 30 customers
b. 20 customers
c. 15 customers
d. 2 customers
_____________ is the characteristic of a product that wins the order in the marketplace.
a. Order winners
b. Order qualifiers
c. Core competency
d. Positioning
If forecast errors are normally distributed then
a. 1 MAD = 1σ
b. 1 MAD ≈ 0.8 σ

c. 0.8 MAD ≈ 1σ
d. 1 MAD ≈ 1.96 σ
All of the following are dimensions of quality for manufactured products, except
a. conformance.
b. reliability.
c. durability.
d. feasibility.