Customer service refers to
a. adhering to the belief that the customer is always right.
b. satisfying the customers’ needs no matter what the price.
c. accepting full liability if a product fails to meet a customer’s expectations.
d. the ability of logistics management to satisfy users in terms of time, dependability,
communication, and convenience.
e. the ability of logistics management to satisfy users in terms of product, price,
promotion, and place.
Answer:
The recognition of the need for organizations to improve the state of people, the planet,
and profit simultaneously if they are to achieve sustainable, long-term growth is
referred to as
a. social responsibility.
b. the triple-bottom line.
c. the marketing concept.
d. sustainability.
e. social entrepreneurship.
Answer:
A formal statement of ethical principles and rules of conduct is referred to as a(n)
a. ethical mission.
b. moral code.
c. core value pronouncement.
d. code of conduct.
e. code of ethics.
Answer:
If you wanted a new pair of shoes during the Civil War, you traced the outline of your
foot on a piece of paper and gave it to a shoemaker. There was no distinction between
the right and left foot because you wanted your shoes as quickly as possible, and the
shoemaker knew that you would buy them even if they just ‘sort of” fit. This is an
example of a transaction that would have occurred during the __________ era in U.S.
business history.
a. marketing concept
b. sales
c. production
d. societal marketing concept
e. market orientation
Answer:
A Woman’s Place is a retail store, created and staffed by women, that offers products
and services relating to maternity needs. For expectant mothers, it offers advice and
personal shopping services, help with hair and/or make-up problems, and free delivery.
A Woman’s Place is an example of a(n) __________ retailer.
a. franchise
b. service
c. limited -service
d. full-service
e. upscale
Answer:
Retailers and direct selling firms have found that their websites, while cannibalizing
sales volume from stores, catalogs, and sales representatives, attract new customers and
influence sales. When Victoria’s Secret, the well-known retailer of intimate apparel for
women ages 18 to 45, created its website, it reported that __________ of its website
customers are __________, most of whom generate new sales volume for the company.
a. 50 percent; women between the ages of 45 and 65
b. 40 percent; teenagers from 13 to 17
c. 30 percent; mature women 50 years and older
d. 25 percent; customers from rural communities
e. 60 percent; men
Answer:
Which of the following products or services must be provided by traditional and NOT
by electronic marketing channels?
a. car rental reservations
b. software
c. healthcare
d. music
e. education
Answer:
The Boston Consulting Group (BCG) business portfolio analysis requires an
organization to locate the position for each of its strategic business units (SBUs) on a
growth-share matrix. The horizontal axis of this matrix indicates
a. the annual rate of growth of the SBU’s industry.
b. the relative dollar ($) market share of the largest competitor.
c. the annual rate of growth of the firm’s largest competitor.
d. the relative unit (#) market share of the smallest competitor.
e. the annual rate of growth of the firm itself.
Answer:
In the CDI/BDI marketing dashboard above, which segment consumes the least amount
of Hawaiian Punch?
a. households without children
b. households with children 13 to 18 years old
c. households with children 6 years old or under
d. households with children 7 to 12 years old
e. Because the BDI and CDI show inconsistencies in their measurements, especially in
the segment of children under the age of six, it is impossible to answer the question.
Answer:
To reduce the uncertainty created by __________ properties, service consumers turn to
personal sources of information such as opinion leaders, early adopters, and reference
group members during the purchase decision process.
a. search
b. credence
c. experience
d. expertise
e. quality
Answer:
A markdown refers to
a. the difference between the final selling price and the retailer’s cost.
b. the amount the manufacturer adds to achieve the desired suggested retail price.
c. discounting a product when the product does not sell at the original price.
d. the lowest price to which a retailer can reduce a sales ticket and still make a profit.
e. the net margin.
Answer:
A penetration pricing policy is MOST LIKELY to be effective when: (1) many
segments of the market are price sensitive; (2) a low initial price discourages
competitors from entering the market; and (3) _________.
a. unit production and marketing costs fall dramatically as production volumes increase
b. customers are willing to buy immediately at the high initial price
c. lowering the price has only a minor effect on increasing sales volume and reducing
unit costs
d. when the high initial prices do not attract competitors
e. when customers interpret high prices as signifying high quality
Answer:
Which form of retailing is Best Buy now using in airports to distribute its mobile phone
and computer accessories, digital cameras, flash drives, and other consumer
electronics?
a. vending machines
b. salespeople with mobile carts
c. mall-scale traditional retail stores
d. salespeople wearing Best Buy uniforms with products in backpacks
e. free-standing kiosks manned with knowledgeable sales personnel
Answer:
When selecting a brand name, it should (1) __________; (2) be memorable, distinctive,
and positive; (3) fit the company or product image; (4) have no legal or regulatory
restrictions; and (5) be simple and emotional.
a. never have a humorous connotation
b. suggest product benefits
c. not be easily imitated
d. be patented
e. easy to spell and pronounce
Answer:
Discounting generally takes place during which stage of the retail life cycle?
a. early growth
b. accelerated development
c. decline
d. maturity
e. early growth and maturity
Answer:
The ratio of perceived benefits to price is referred to as
a. the price-quality relationship.
b. customer value pricing.
c. value-added pricing.
d. value analysis.
e. value.
Answer:
Not every suburban store is located in a shopping mall. Many neighborhoods have
clusters of stores, referred to as a strip mall, to serve people who are within a 5- to
10-minute drive. Unlike the larger shopping centers, the composition of these stores is
usually __________.
a. unplanned
b. national anchor stores
c. privately-owned specialty stores
d. fast food restaurants
e. amusement and theme parks
Answer:
If a marketing manager queries a marketing information system to determine the effect
of three different levels of price for a new product, she is using __________.
a. action analysis
b. an environmental scan
c. a problem search
d. situational analysis
e. sensitivity analysis
Answer:
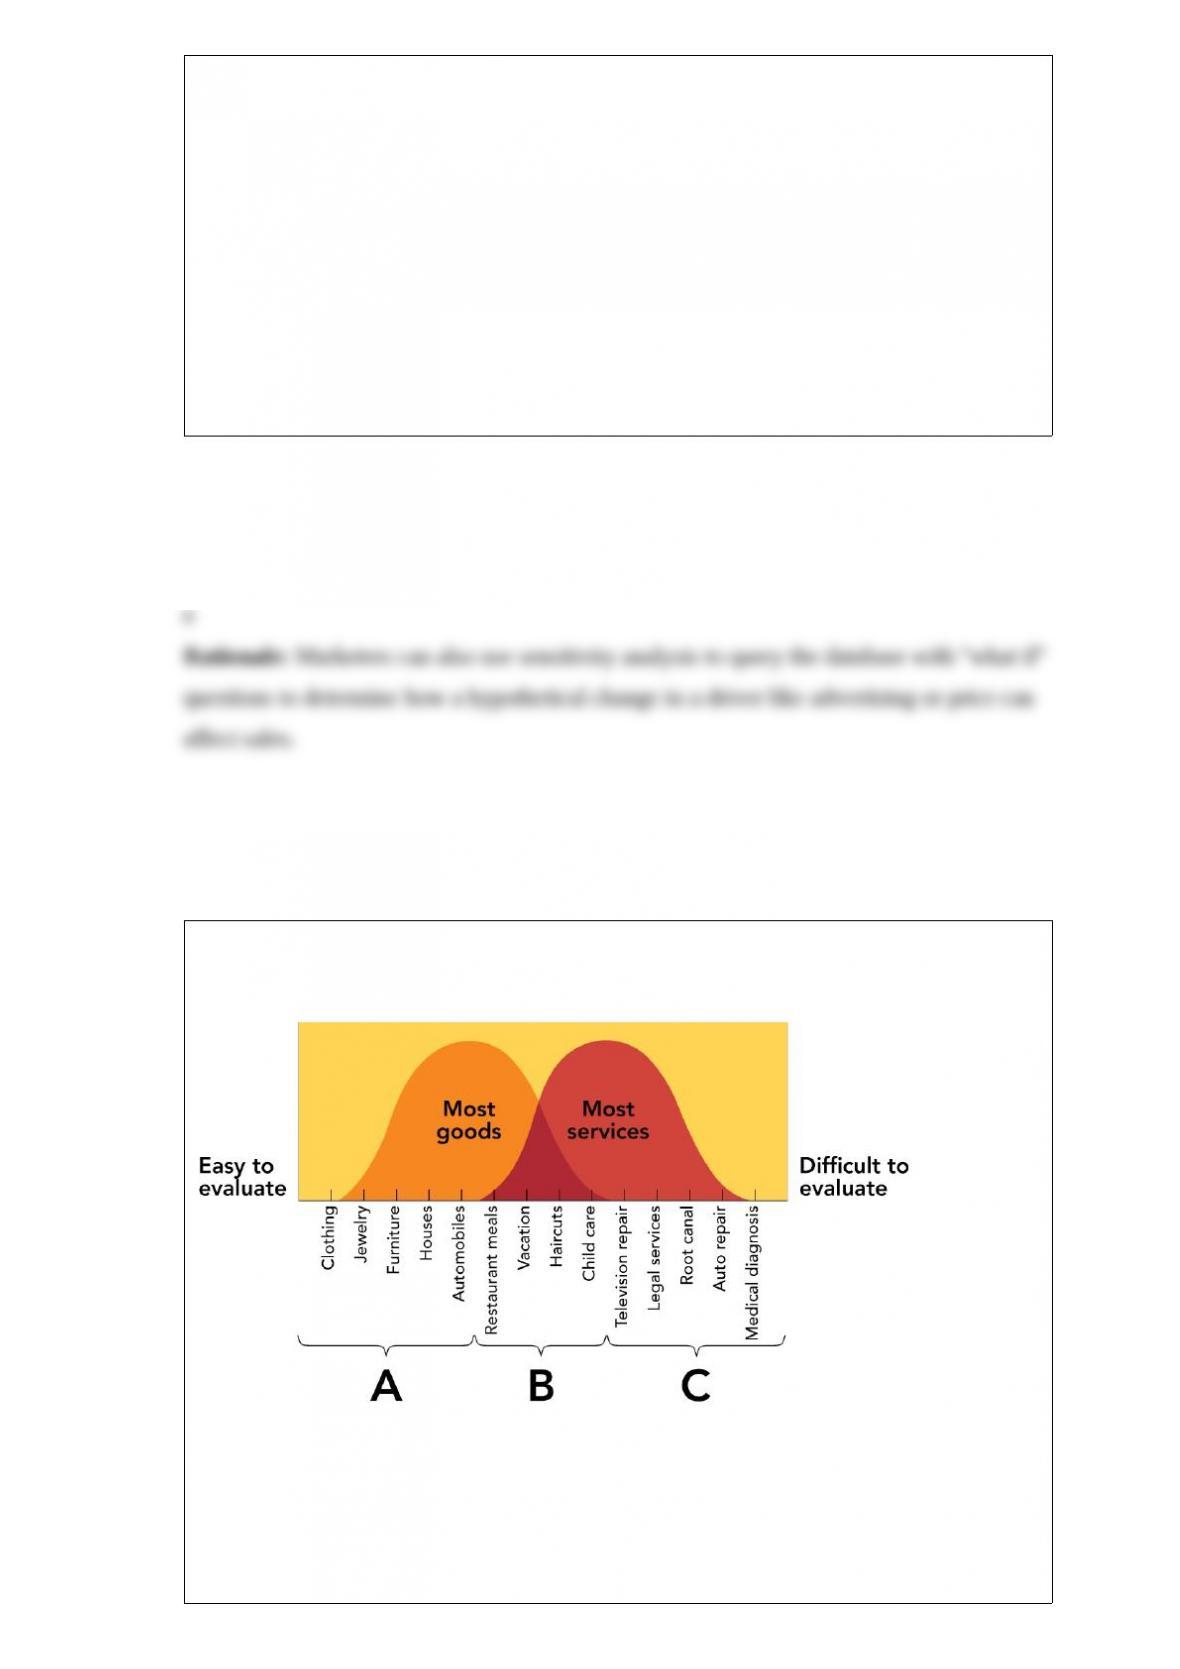
Figure 1.
According to Figure 1. above, purchases labeled “A” would most likely be evaluated on
__________ properties.
a. value
b. search
c. credence
d. experience
e. quality
Answer:
Word of mouth refers to
a. advertising or public service announcements that rely solely on auditory or voice
messages to reach an organization’s target market.
b. subjective, often negative, misconceptions that are passed from one person to another
as the result of selective perception.
c. the influencing of people during conversation.
d. the intentional spreading of false information about a competitor’s new product just
prior to launch to harm its sales.
e. casual or unconstrained conversation or reports about other people or offerings,
typically involving details that are not confirmed as being true.
Answer:
Which of the following statements best describes how a supply chain differs from a
marketing channel?
a. Communication is more important in the marketing channel than in the supply chain.
b. The marketing channel places more emphasis on cost-effectiveness than the supply
chain.
c. A marketing channel includes suppliers that provide raw material inputs to a
manufacturer.
d. A supply network moves materials from producer to consumer while a marketing
channel moves materials from the supplier to the producer.
e. A supply chain includes suppliers; marketing channels do not.
Answer:
Pepsi-Cola made “freshness” an important product attribute when it stamped freshness
dates on its cans. Prior to doing so, few consumers considered freshness an issue. Pepsi
is trying to change consumers’ attitudes toward its soft drinks by
a. changing beliefs about the extent to which a brand has a specific attribute.
b. changing the perceived importance of a specific attribute.
c. adding a new attribute.
d. reducing perceived risk.
e. providing stimulus generalization.
Answer:
Federal, state, and local agencies that buy goods and services for the constituents they
serve are referred to as
a. industrial markets.
b. reseller markets.
c. consumer markets.
d. government units.
e. global markets.
Answer:
The American Marketing Association Statement of Ethics is centered on three general
norms: marketers must: (1) do no harm; (2) foster trust in the marketing system; and (3)

__________.
a. initiate fair and honest dialogues in developing markets
b. embrace, communicate, and practice the fundamental ethical values that will improve
consumer confidence in the integrity of the marketing exchange system
c. champion new legislation that protects ethical business firms and punish those who
abuse consumer trust
d. support governmental agencies in their quest to identify and prosecute those who
break the laws of ethical marketing
e. contribute to society’s well-being through charitable contributions and cause-related
marketing efforts
Answer:
Gatorade is classified as a __________ brand.
a. domestic
b. regional
c. international
d. global
e. nationwide
Answer:
The decision-making process that organizations use to establish the need for products
and services and identify, evaluate, and choose among alternative brands and suppliers
is referred to as
a. the consumer purchase decision process.
b. organizational buying behavior.
c. the industrial purchase procedure.
d. the offering purchase framework.
e. the sustainable procurement process.
Answer:
Dollar General and the Dollar Tree are examples of which type of retailer?
a. warehouse club
b. hypermarket
c. outlet store
d. everyday value retailer
e. extreme value retailer
Answer:
The sequence of firms that performs activities required to create and deliver a product
or service to ultimate consumers or industrial users is referred to as
a. strategic distribution.
b. distribution management.
c. a supply chain.
d. value chain optimization.
e. logistics.
Answer:
The deceptive clicking of ads solely to increase the amount advertisers must pay is
referred to as
a. deceptive advertising.
b. click fraud.
c. webtipping.
d. click-theft.
e. clickbotting.
Answer:
Although the lack of control means that it is rarely the main element of a promotional
campaign, __________ is an important element of most promotional campaigns.
a. publicity
b. advertising
c. personal selling
d. sales promotion
e. direct marketing
Answer: