Unlock document.
This document is partially blurred.
Unlock all pages and 1 million more documents.
Get Access
In the equation to calculate the economic value of a customer, V = R F M / D, how is
the value for F estimated?
A) It is estimated to be the total number of purchases the customer has made.
B) It is estimated to be the number of visits of the customer without actually spending
on an item.
C) It is estimated to be the purchase frequency per year.
D) It is estimated to be the number of customers defecting per year.
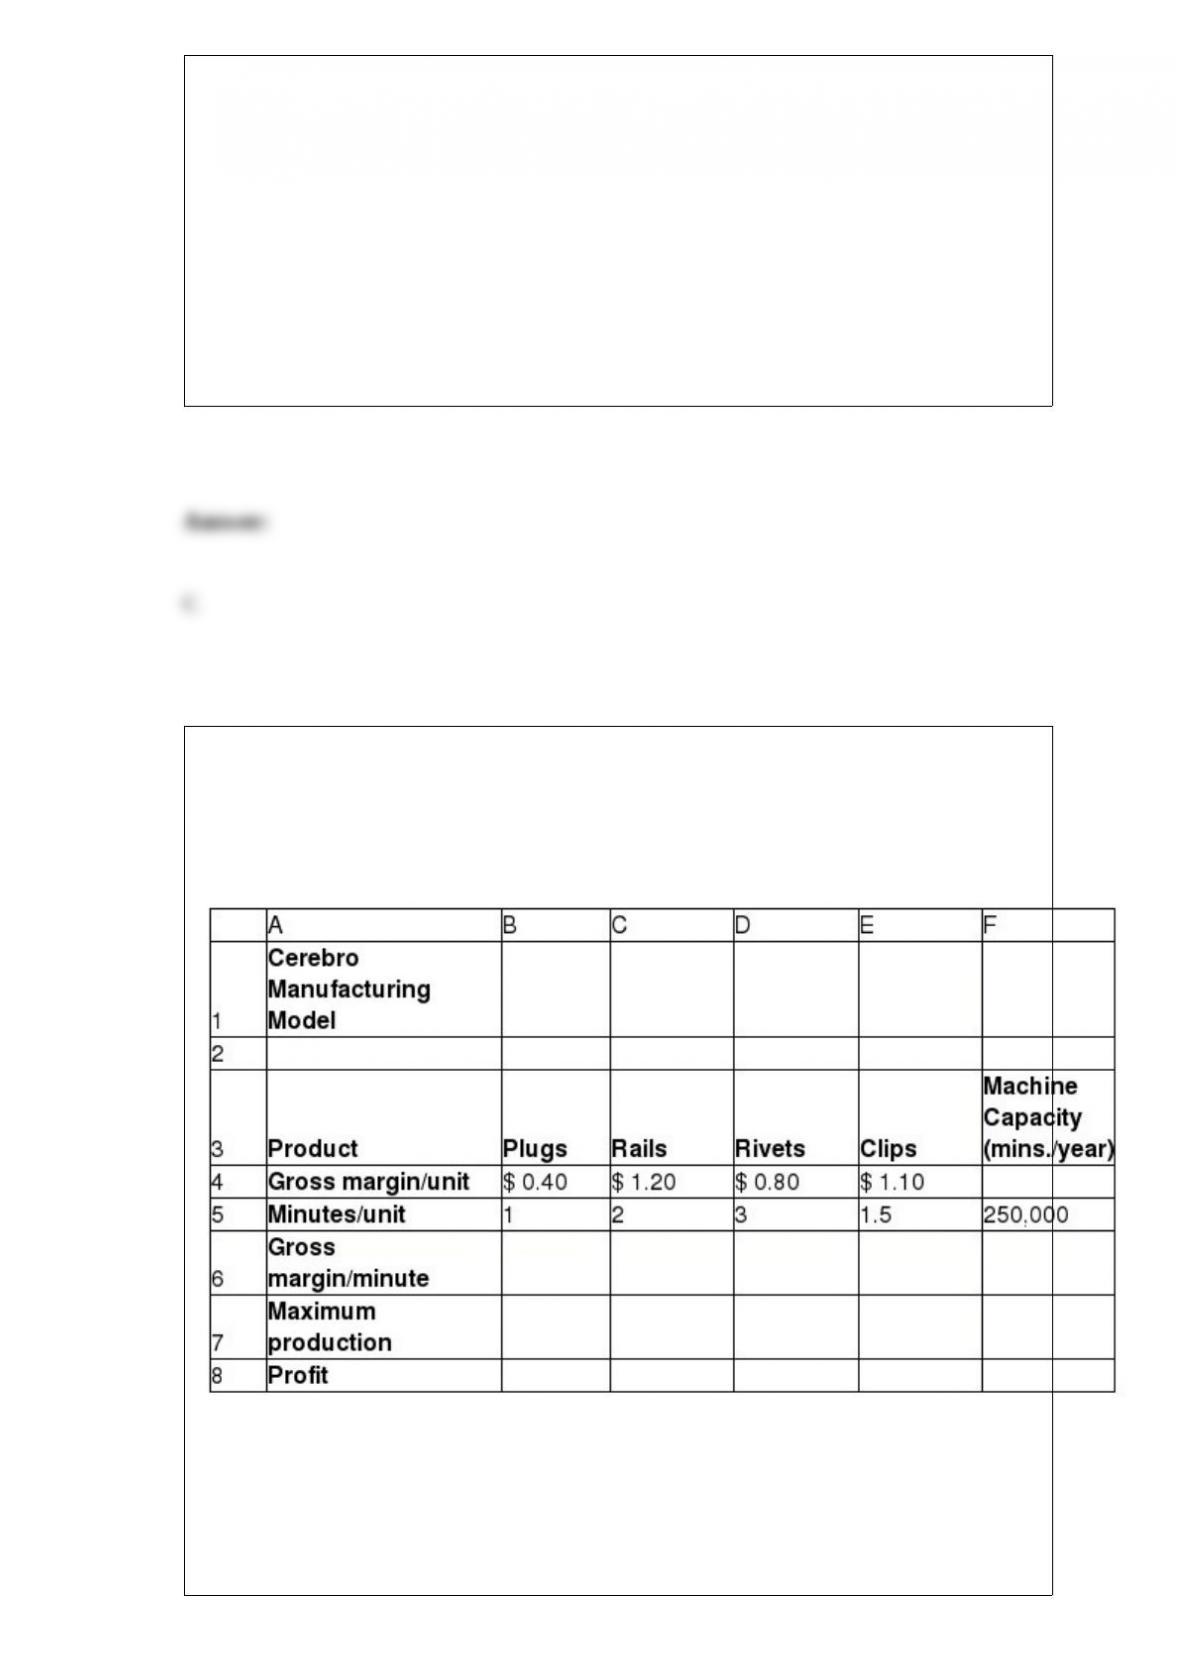
Cerebro Manufacturing produces four types of structural support fittings-plugs, rails,
rivets, and clips-which are machined on two CNC machining centers. The machining
centers have a capacity of 250,000 minutes per year. The gross margin per unit and
machining requirements are shown in the spreadsheet below.
Which of the following options is used if Solver gives an error message that linearity is
not satisfied?
A) Ignore Integer Constraints

B) Show Iteration Results
C) Use Automatic Scaling
D) Use Multistart
Which of the following is true about the value of the power of the test?
A) low value will enable valid conclusions to be made
B) small sample sizes generate a low value of the power of the test
C) low value will help in detecting small differences in sample statistics
D) small sample sizes incur higher costs than large sample sizes
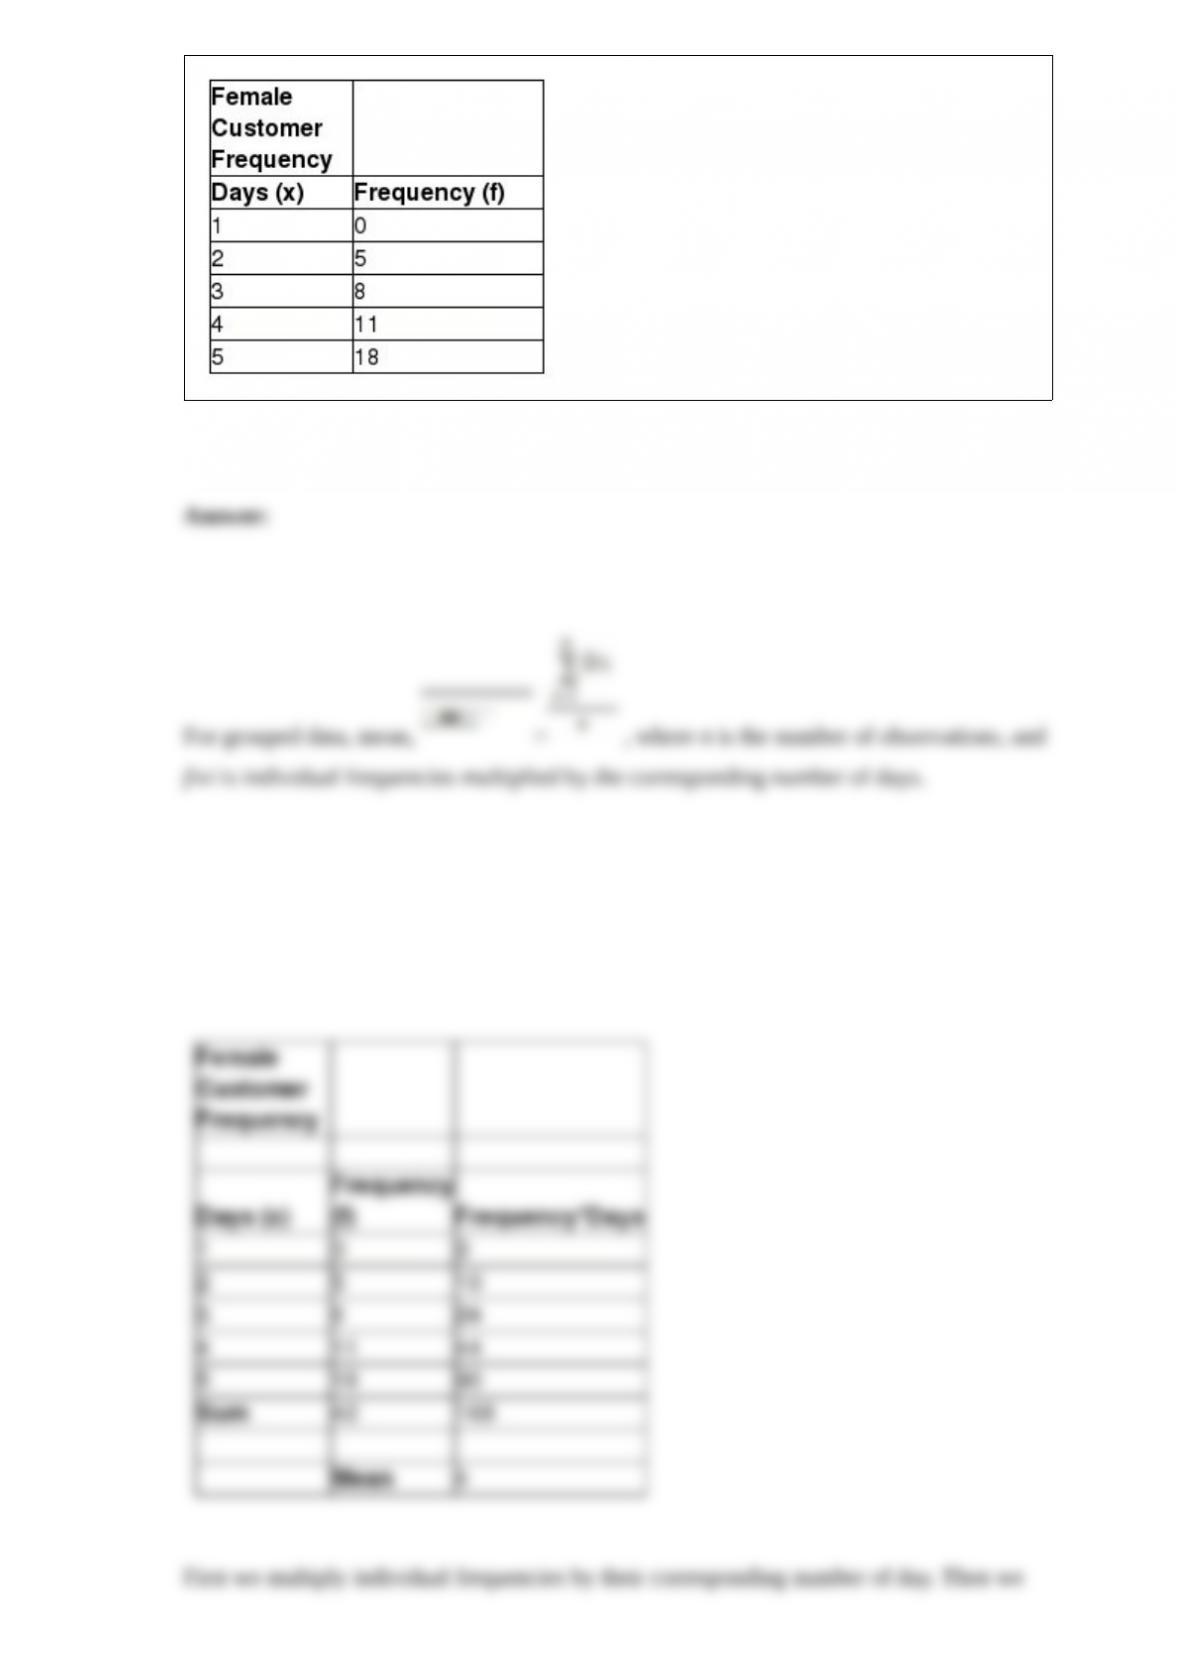
The table below shows the daily frequency of female customers at a particular ice
cream shop during discount sale periods. The data is collected for 5 days. Calculate the
mean for the data.
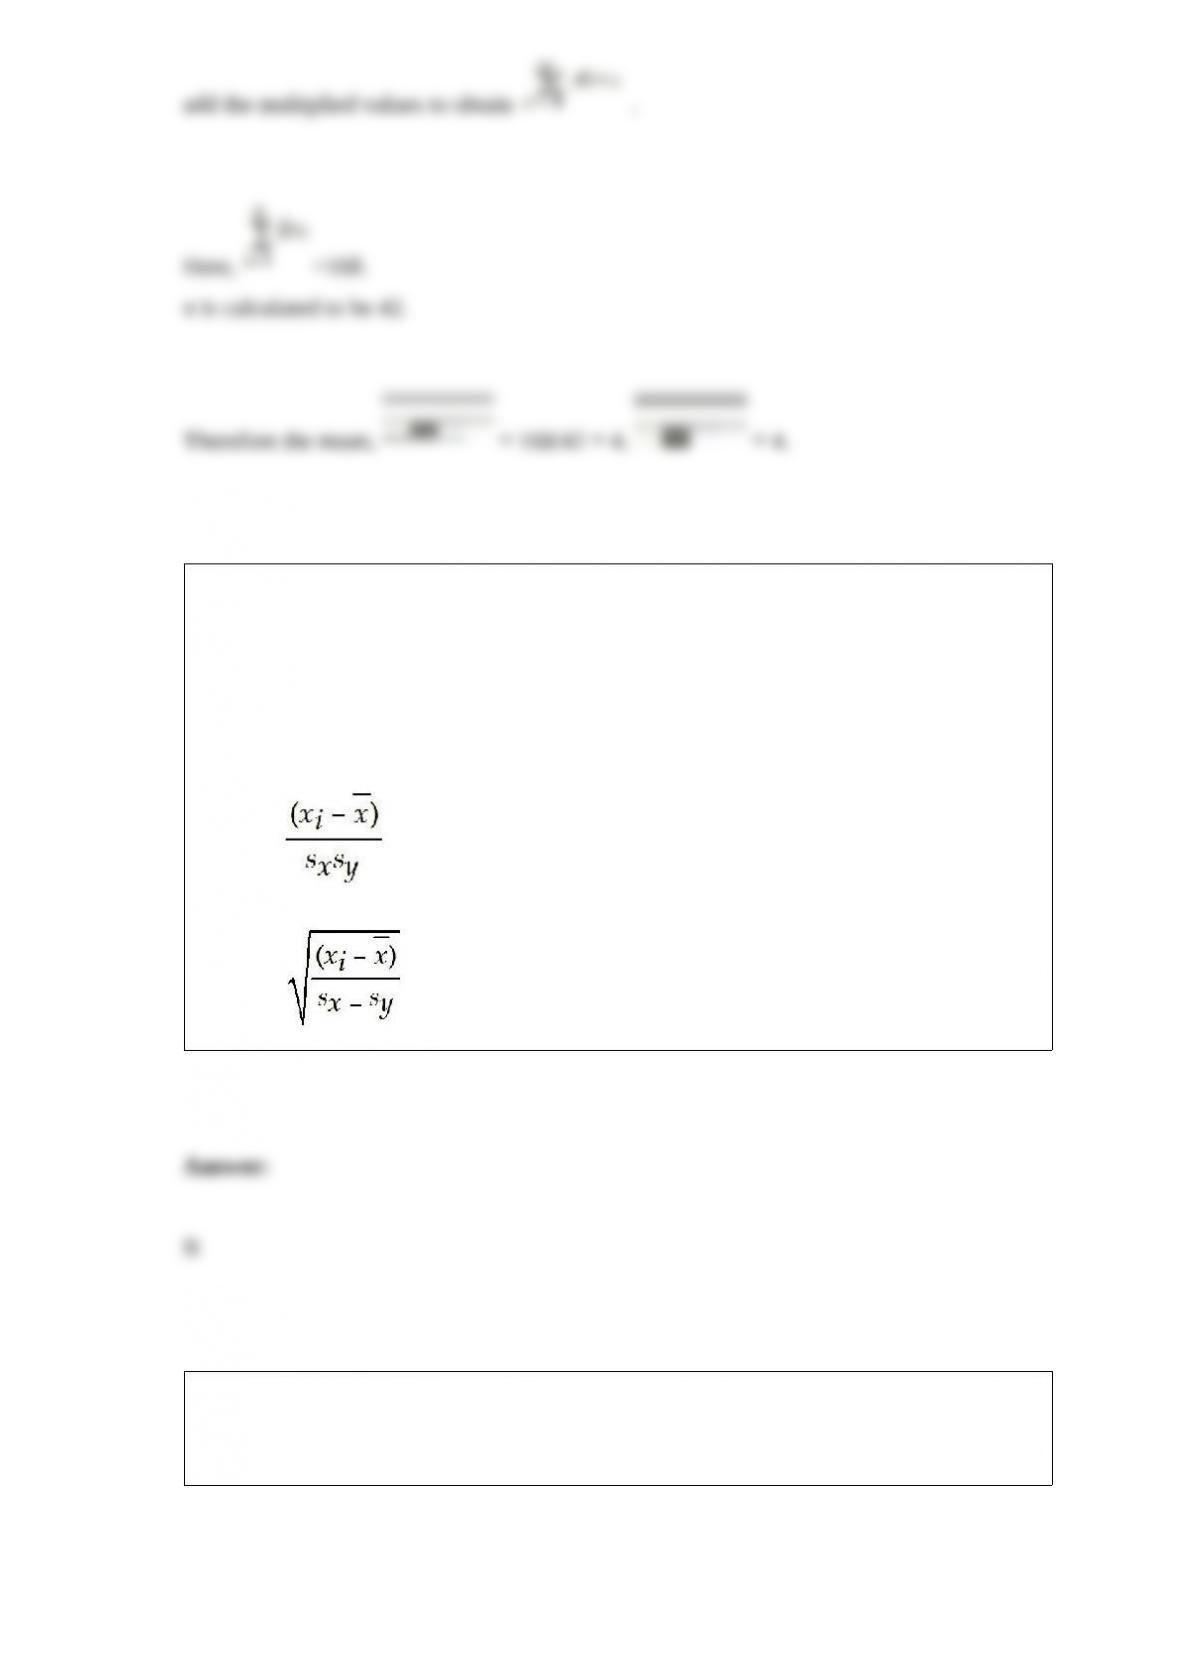
Which of the following is the equation used for computing the sample correlation
coefficient?
A) rxy = cov(X,Y)(sxsy)
B) rxy = cov(X,Y)/SxSy
C) rxy =
D) rxy =
Following is an extract from the database of a construction company. The table shows
the height of walls in feet and the cost of raising them. The estimated simple linear
regression equation is given as Ŷ = b0 + b1X. (Hint: Use Excel functions).
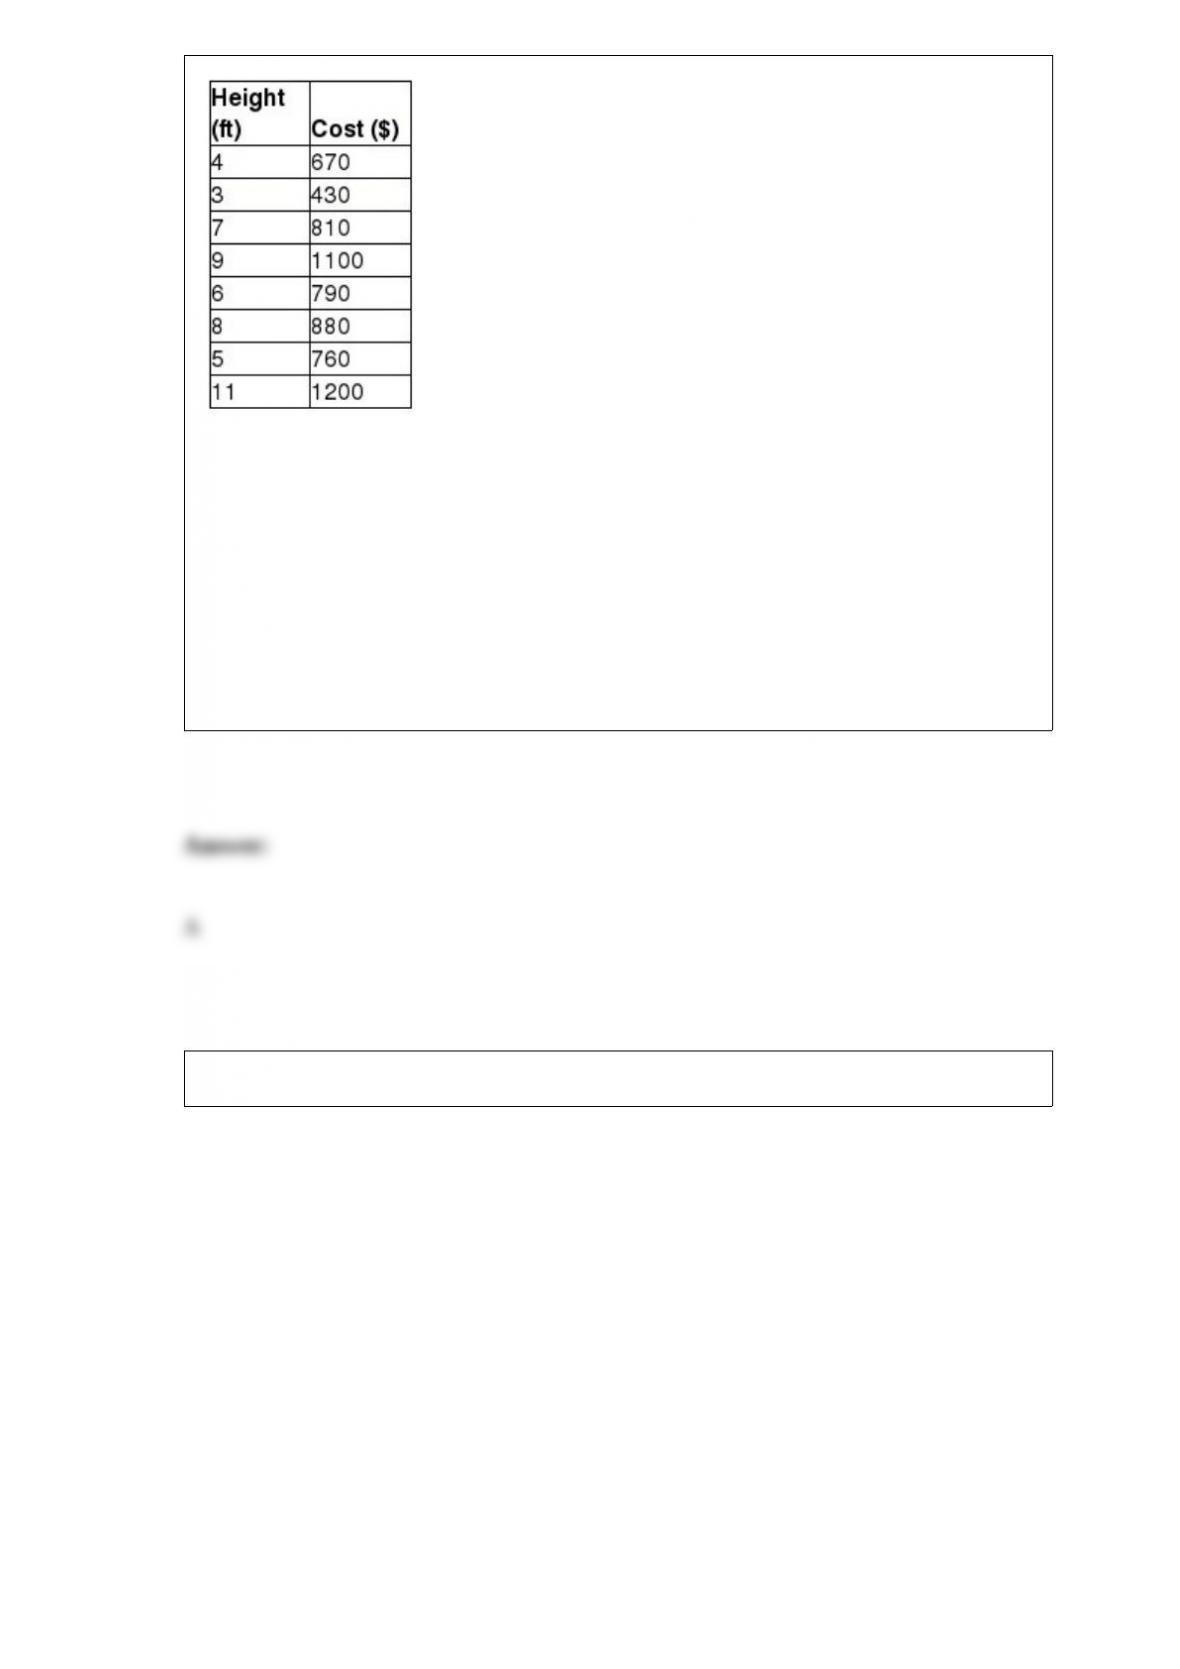
What is the value of the coefficient b1?
A) 86.81704
B) 254.8371
C) 0.010697
D) -2.14625
Below is a spreadsheet for Trance Electronics.
Suppose that the project manager of Trance Electronics has identified the following
uncertain variables in the model and the distributions and parameters that describe
them, as follows: Market size: normal with mean of 20,000,000 units and standard
deviation of 4,000,000 units. R&D costs: uniform between $600,000,000 and
$800,000,000.
Clinical trial costs: lognormal with mean of $150,000,000 and standard deviation
$30,000,000. Annual market growth factor: triangular with minimum = 2%,
maximum = 6%, and most likely = 3%.
Annual market share growth rate: triangular with minimum = 15%, maximum =
25%, and most likely = 20%.
The number of trials per simulation is equal to 10,000 at a Sim. Random Seed of 2. Run
the simulation and answer the following questions using the Risk Solver Platform.
What is the expected value margin obtained from the simulation results of the net
present value?

A) 0.864
B) -0.726
C) 0.343
D) -0.467
Which of the following questions will prescriptive analytics help a company address?
A) How many and what types of complaints did they resolve?
B) What is the best way of shipping goods from their factories to minimize costs?
C) What do they expect to pay for fuel over the next several months?
D) What will happen if demand falls by 10% or if supplier prices go up 5%?
Following is the Sales database of Pointler's Inc., a manufacturer of clothing material.
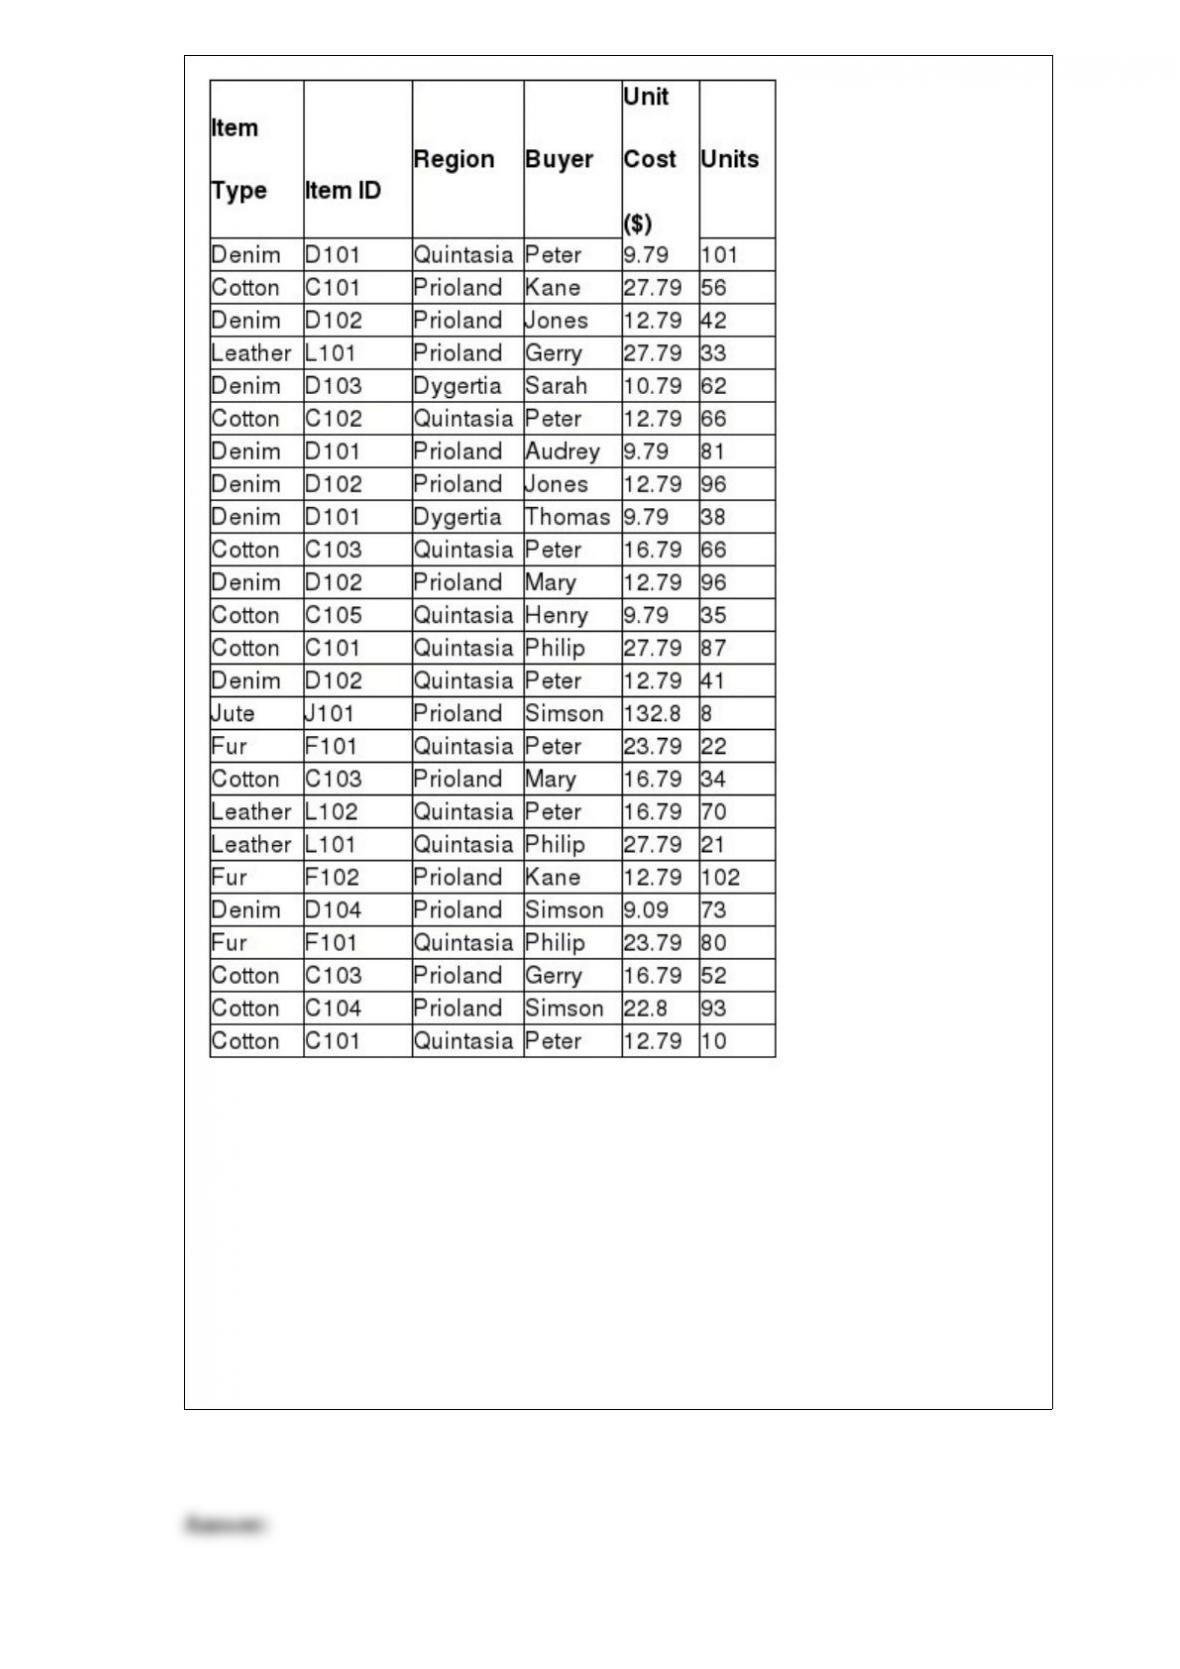
Use Excel to calculate the total $ amount of sales made to Quintasia. Include the sale of
fur, jute, and leather.
A) $193
B) $4185.47
C) $25250.19
D) $130.83
Using Chebyshev's theorem for standard deviation, calculate the percentage of data that
lie within five standard deviations of the mean.
A) 89%
B) 75%
C) 96%
D) 50%
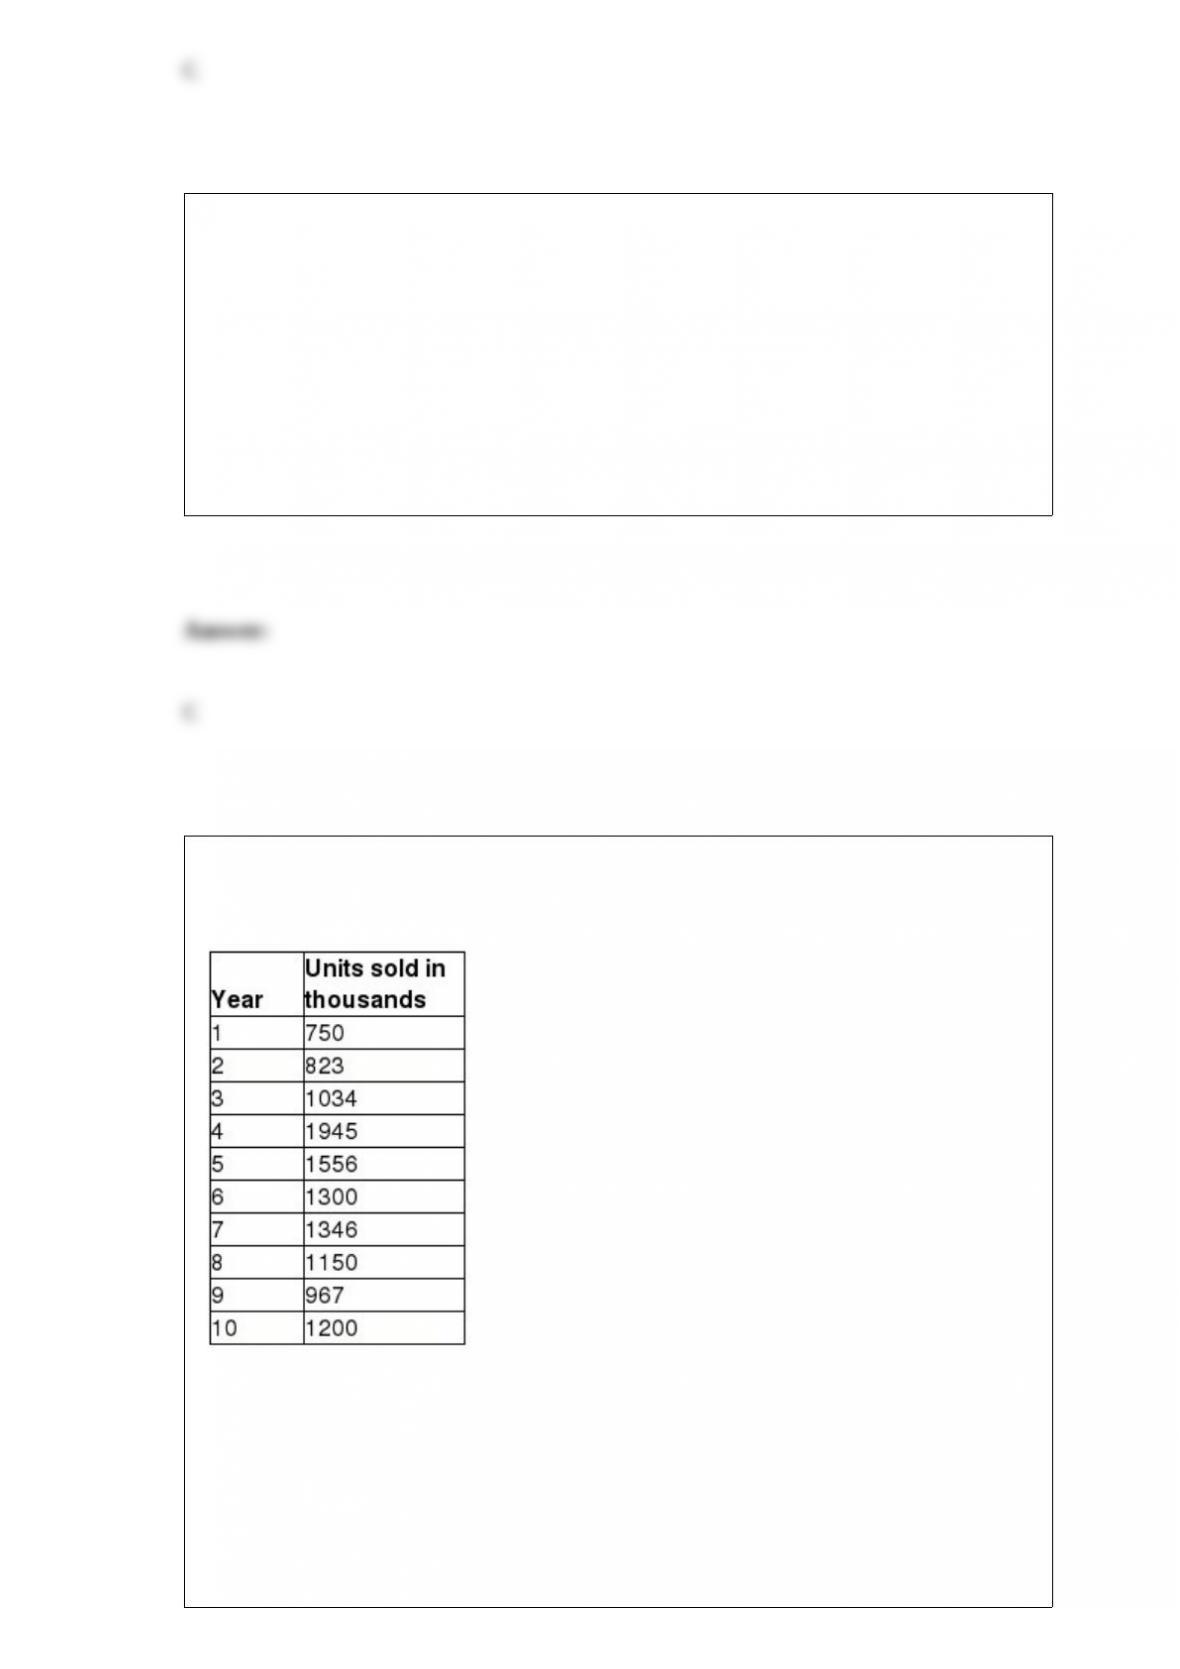
The worldwide sales of cars from 1981 -1990 are shown in the table below. Given: α =
0.2, γ = 0.05, and season length = 1. (Hint: Use XLMiner).
Which of the following is the forecast value for the 6th year?
A) 1256.06
B) 1328.04
C) 1321.31

D) 1327.24
Which of the following is true about the observed errors associated with estimating the
value of the dependent variable using the regression line?
A) They are the horizontal distances between slopes and y-intercepts.
B) The errors are also referred to as critical values.
C) They are always maximized by the regression lines.
D) The errors can be negative or positive.
________ provide information about the unknown values of the true regression
coefficients, accounting for sampling error.
A) Standard errors
B) Confidence intervals
C) Adjusted R Squares
D) P-values
Which of the following formulas are used to calculate the In-house recording cost?
A) B10*B12
B) B10*B12-B17
C) B6+B10*B12
D) =SUM(B6:B12)-B7
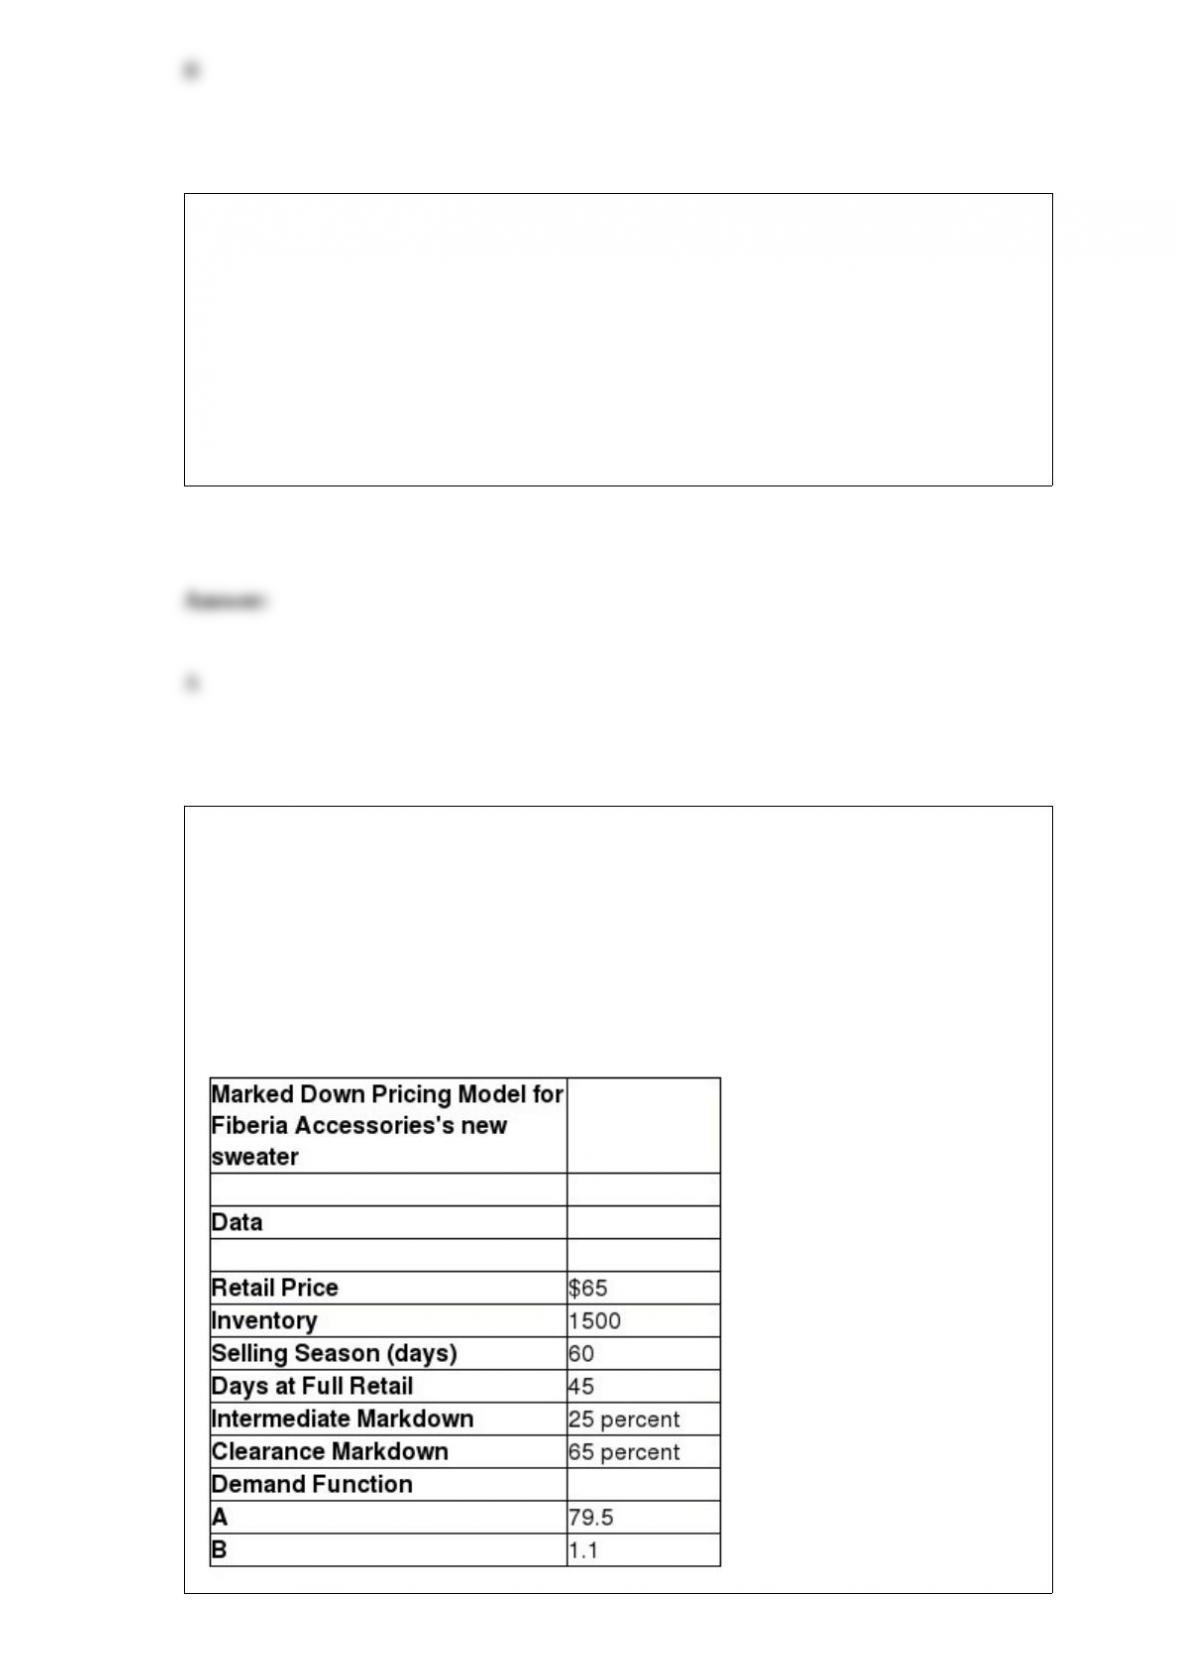
Fiberia Accessories, a clothing retailer, is planning to introduce a new line of sweaters
as part of the winter collection for $65 with an inventory of 1500. The main selling
season is 60 days between November and December. The store then sells the remaining
units in a clearance sale at 65 percent discount. Out of the 60 main retail days, Fiberia
sells the sweaters at full retail price for only 45 days, while giving a discount of 25
percent for the remaining 15 days. The demand functions a, and b are given as 79.5 and
1.1 respectively.

Calculate the total number of units sold during the full retail sales period.
A) 33.33
B) 520
C) 187.5
D) 360
Which of the following types of data-mining methods provides probabilistic if-then
statements?
A) association rule
B) logistic regression
C) reduction
D) cause-and effect modeling
Calculate the coefficient of variation from the following data:
z-score = 1.32; standard deviation = 0.173; mean = 4.7; total variation = 0.6
A) 27.16
B) 156.66

C) 0.04
D) -0.5
Which of the following statements is true of a triangular distribution?
A) We are required to know only the smallest and largest possible values that the
variable might assume.
B) These distributions depend on multiple parameters that one can easily identify based
on managerial knowledge and judgment.
C) The distribution has a limited range and can be skewed in either direction.
D) The distribution is very positively skewed, with no negative values.
Jonathan Reese is considering three stocks in which to invest with a fixed budget. The
table below provides information on Jonathan's expected returns for each stock. The
table also provides information, collected from market researchers, on the
variance-covariance matrix of the individual stocks. He expects a total return of at least
10%.
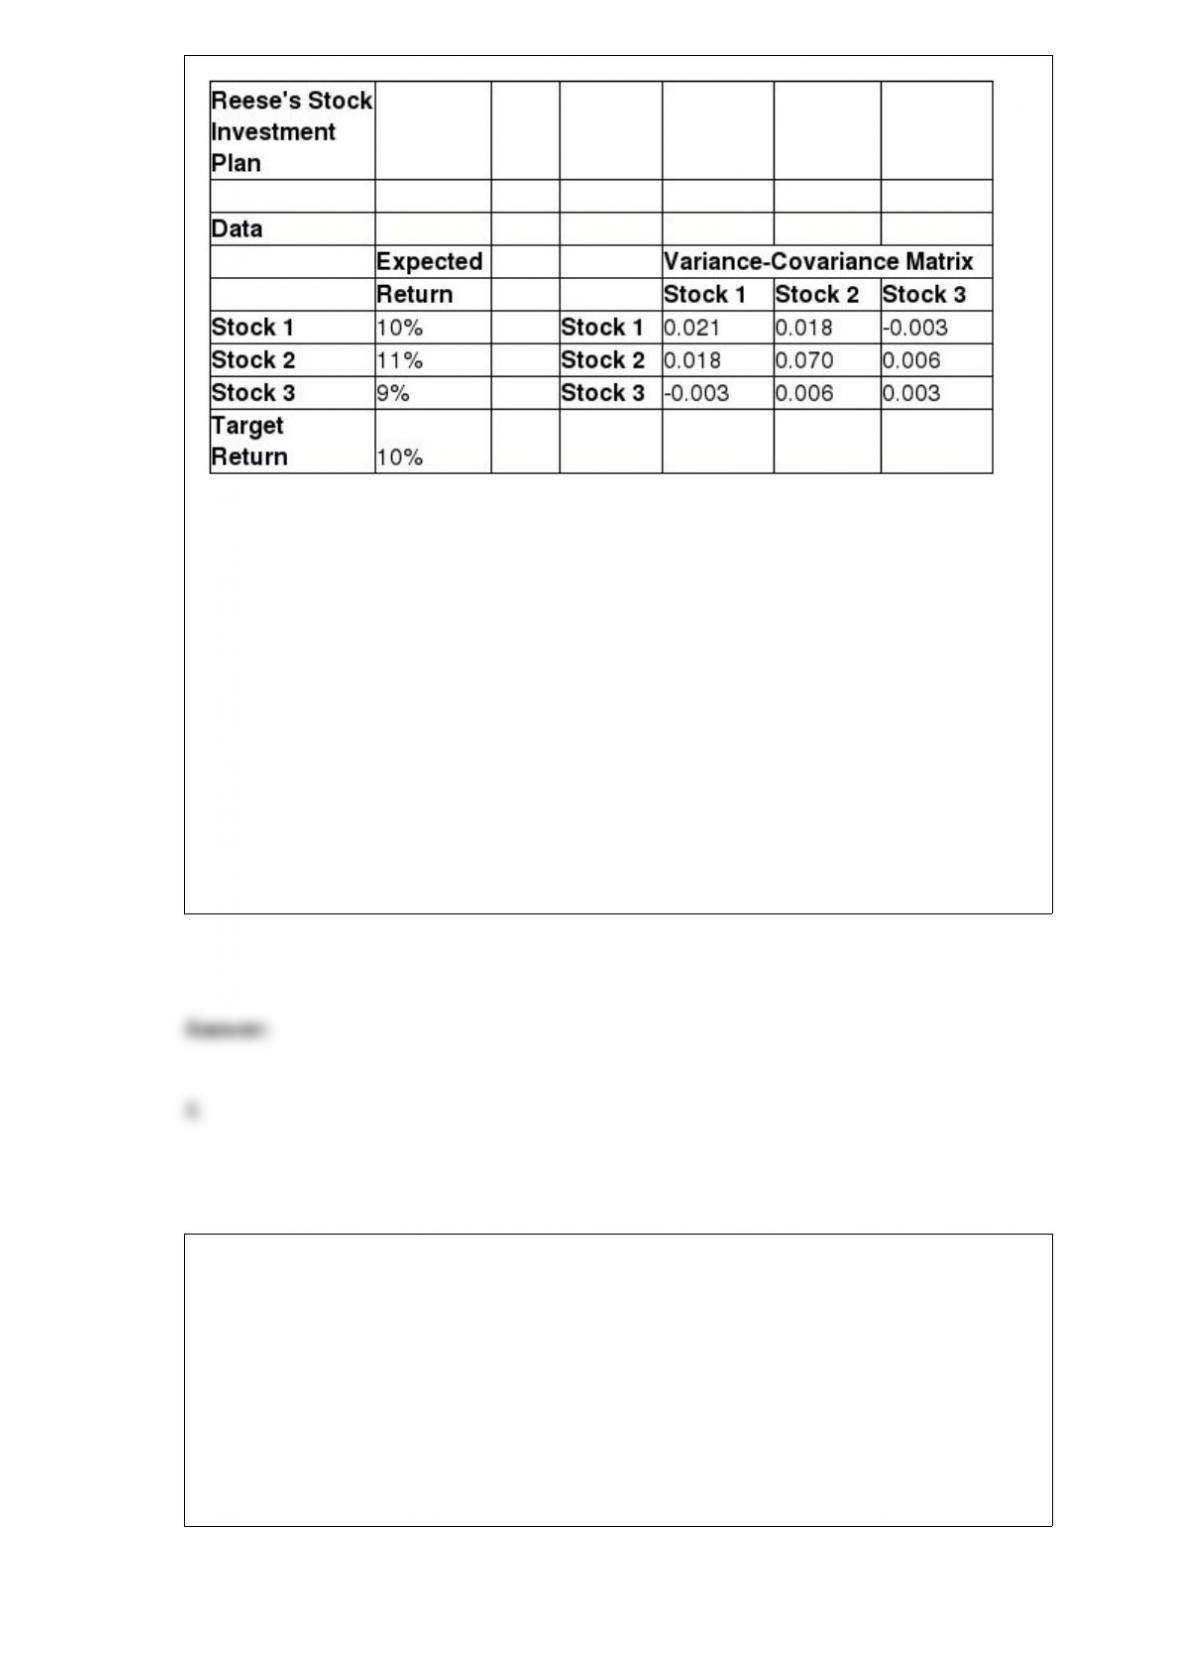
Develop a quadratic optimization model to find the optimal allocation of the budget to
each stock, and variance calculations for squared terms and cross-products based on the
variance-covariance matrix.
According to the model, what is the squared term value for Stock 3 variance?
A) 0.00018
B) 0.00080
C) 0.00096
D) 0.00194
Which of the following is true about probability density functions?
A) A graph of the density function must lie at or below the x-axis.
B) The total area under the density function below the x-axis is 2.0.
C) It calculates the probability of a random variable lying within a certain interval.
D) P (a) x P (b) is the area under the density function between two numbers a and b.
Give an account of how data is used in predictive models.
What are the different interpretations for correlation coefficient values?
How does a tornado chart help make sense of inputs in analyzing data and models?
Explain statistics as defined by David Hand. What are the two ways in which Microsoft
Excel supports statistical analysis?
What is degeneracy in linear optimization? Give an example.
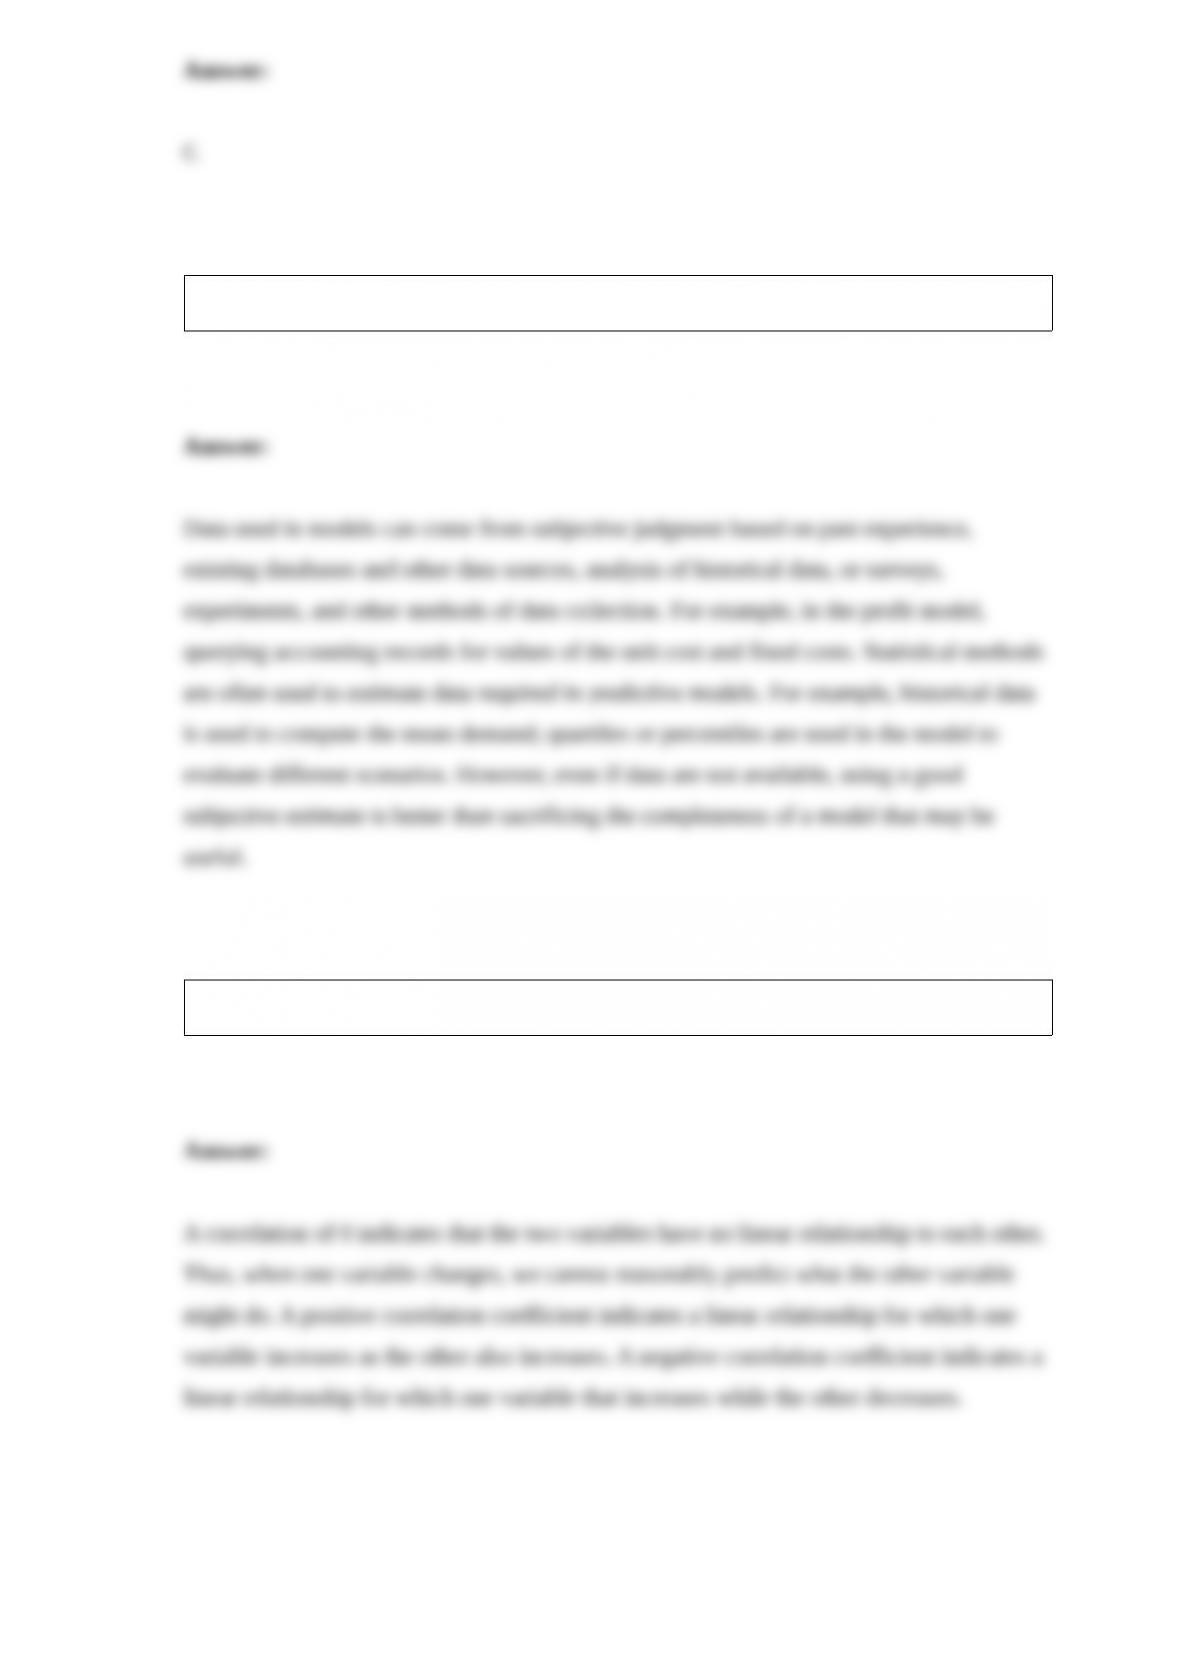
From the data in the table below, calculate the total annual cost using the economic
order quantity (EOQ) model.
Construct a PivotChart to visualize the purchase order total units for steel forks and
ceramic bowls within each region.
How can outliers be identified in a data set?
Elaborate on the use of geographic data mapping in business analytics.
A musical instruments retailer has 10,000 point-of-sale transactions out of which 1500
sales included both items of electric guitars and guitar cases, and out of which 750 had
sales of new strings. If the electric guitars are considered A, the guitar cases are
considered B, and the strings are considered C, then the associate rule for these sales
become "If A and B are purchased, then C is also purchased." Calculate the confidence
level, expected confidence level, and lift for this rule, given that total transactions for C
is 3000.


