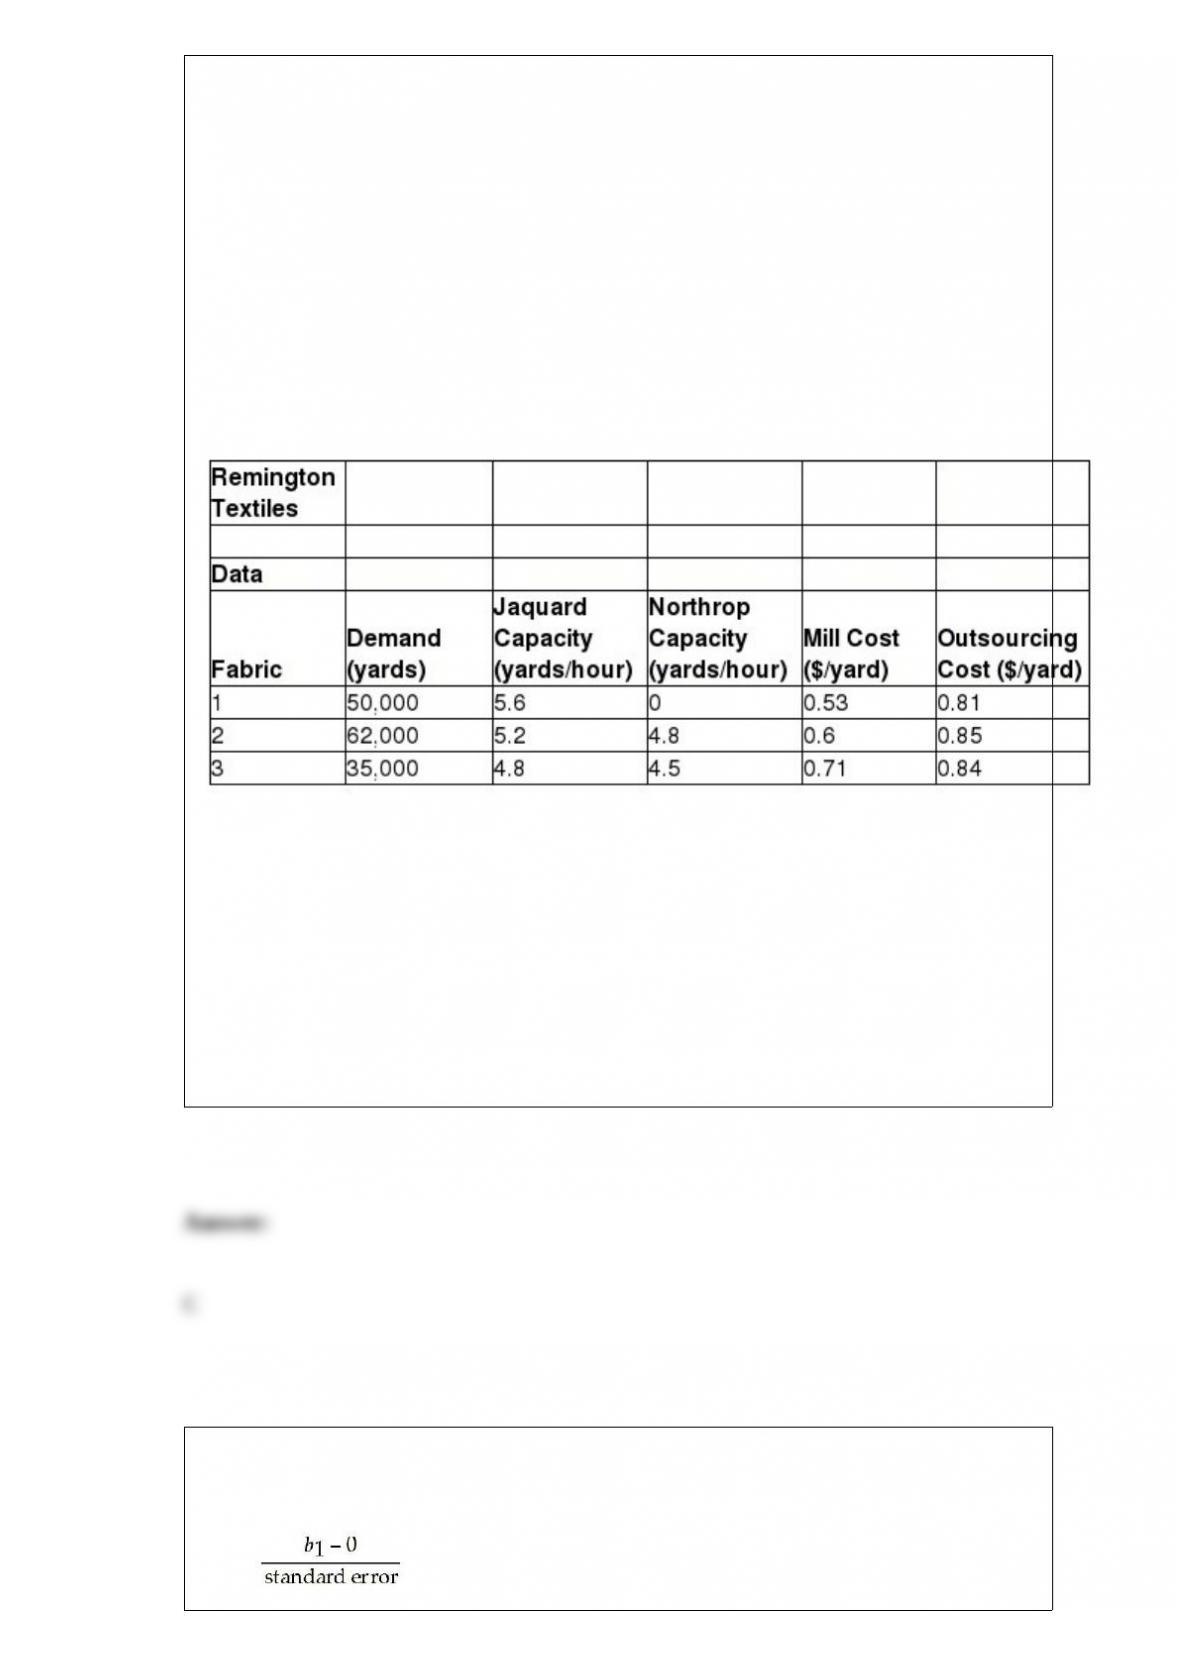
Remington Textiles has a mill that produces three types of fabrics on a make-to-order
basis. The mill operates on a 24/7 basis. The key decision facing the plant manager is
about the type of loom needed to process each fabric during the coming 12 weeks to
meet demands for the three fabrics and not exceed the capacity of the looms in the mill.
Two types of looms are used: Jaquard and Northrop. Jaquard looms can be used to
make all fabrics and are the only looms that can weave certain fabrics, such as plaids.
Demands, variable costs for each fabric, and production rates on the looms are given in
the table below. The mill has 10 Northrop looms and 2 Jaquard looms. Any fabrics that
cannot be woven in the mill because of limited capacity will be purchased from an
external supplier, finished at the mill, and sold at the selling price. In addition to
determining which looms to use to process the fabrics, the manager also needs to
determine which fabrics to buy externally.
According to the model, what is the total amount of Fabric 2 to be purchased?
A) 50,000
B) 62,000
C) 0
D) 2,405
While testing hypotheses for regression coefficients, the t-test for the slope is expressed
as:
A) t =
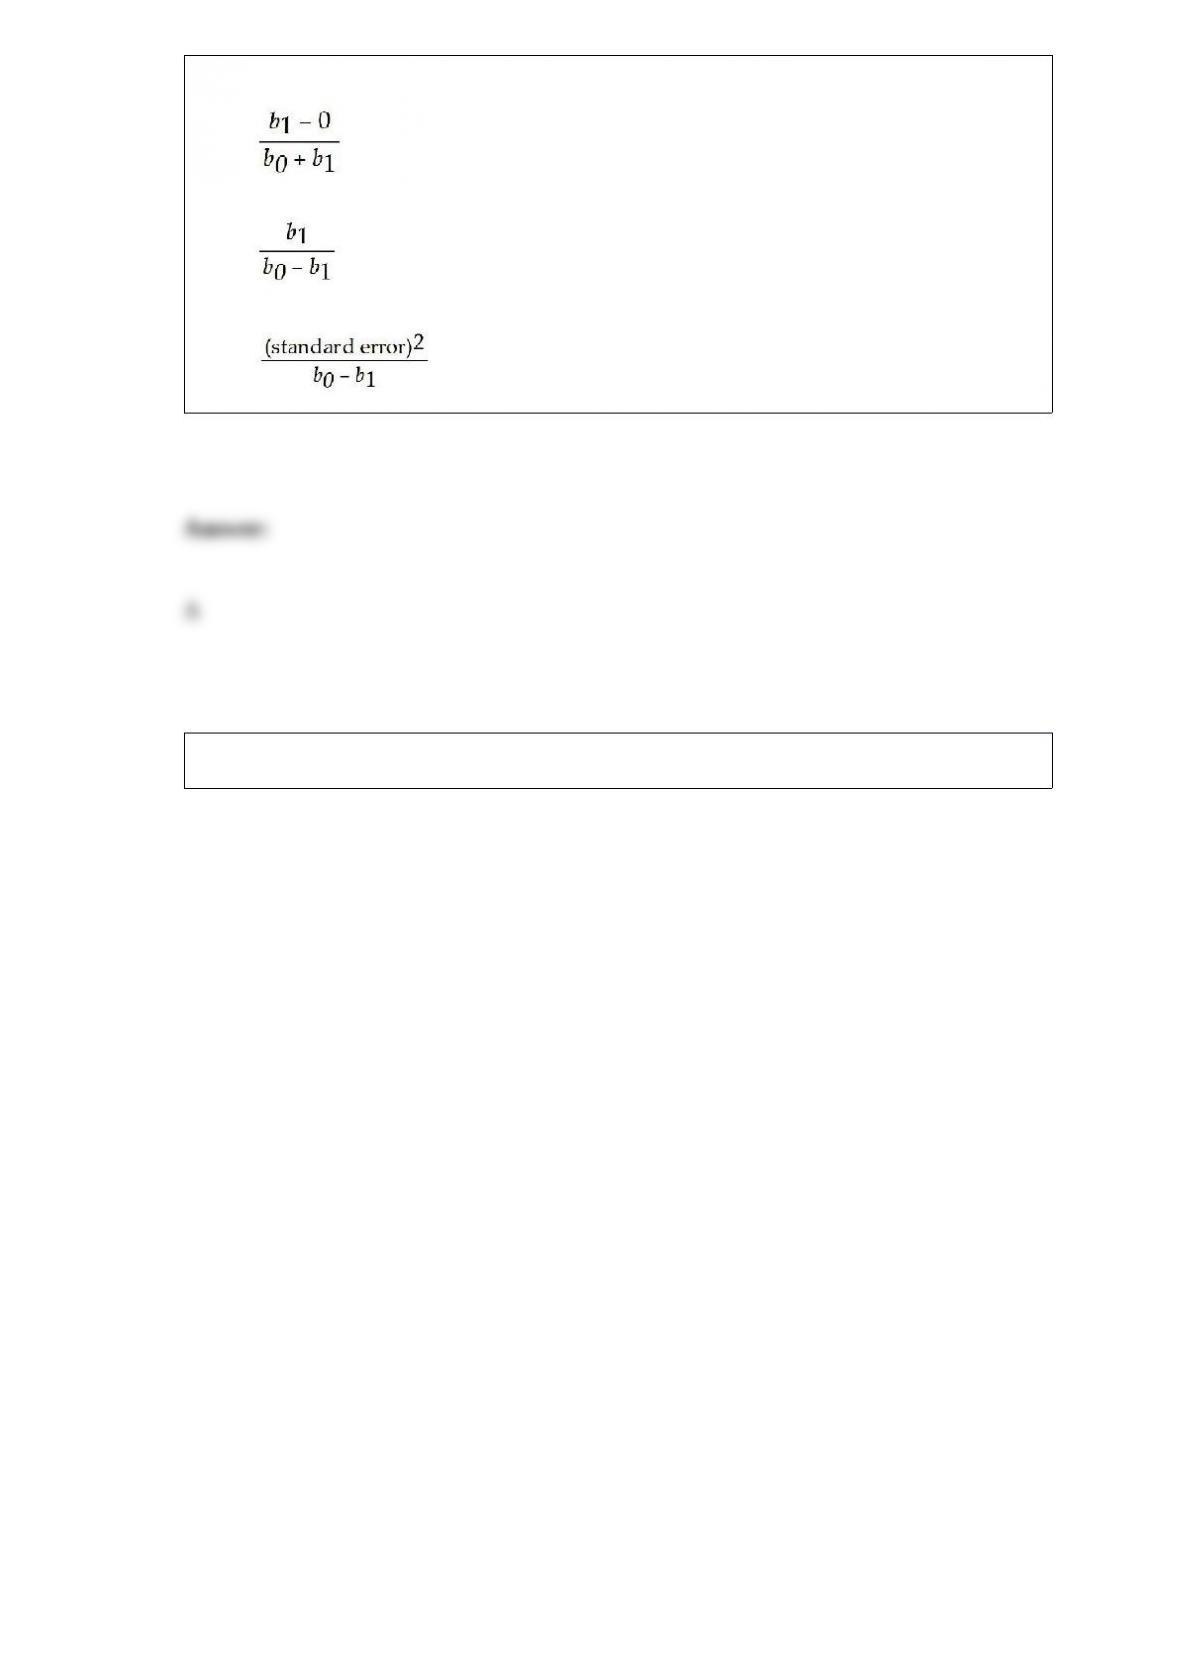
B) t =
C) t =
D) t =
Below is the spreadsheet for Memphis Designs fixed cost model:

What is the net production at the end of the first quarter?
A) 75
B) 200
C) 450
D) 600
Below is a spreadsheet for a hotel overbooking model.
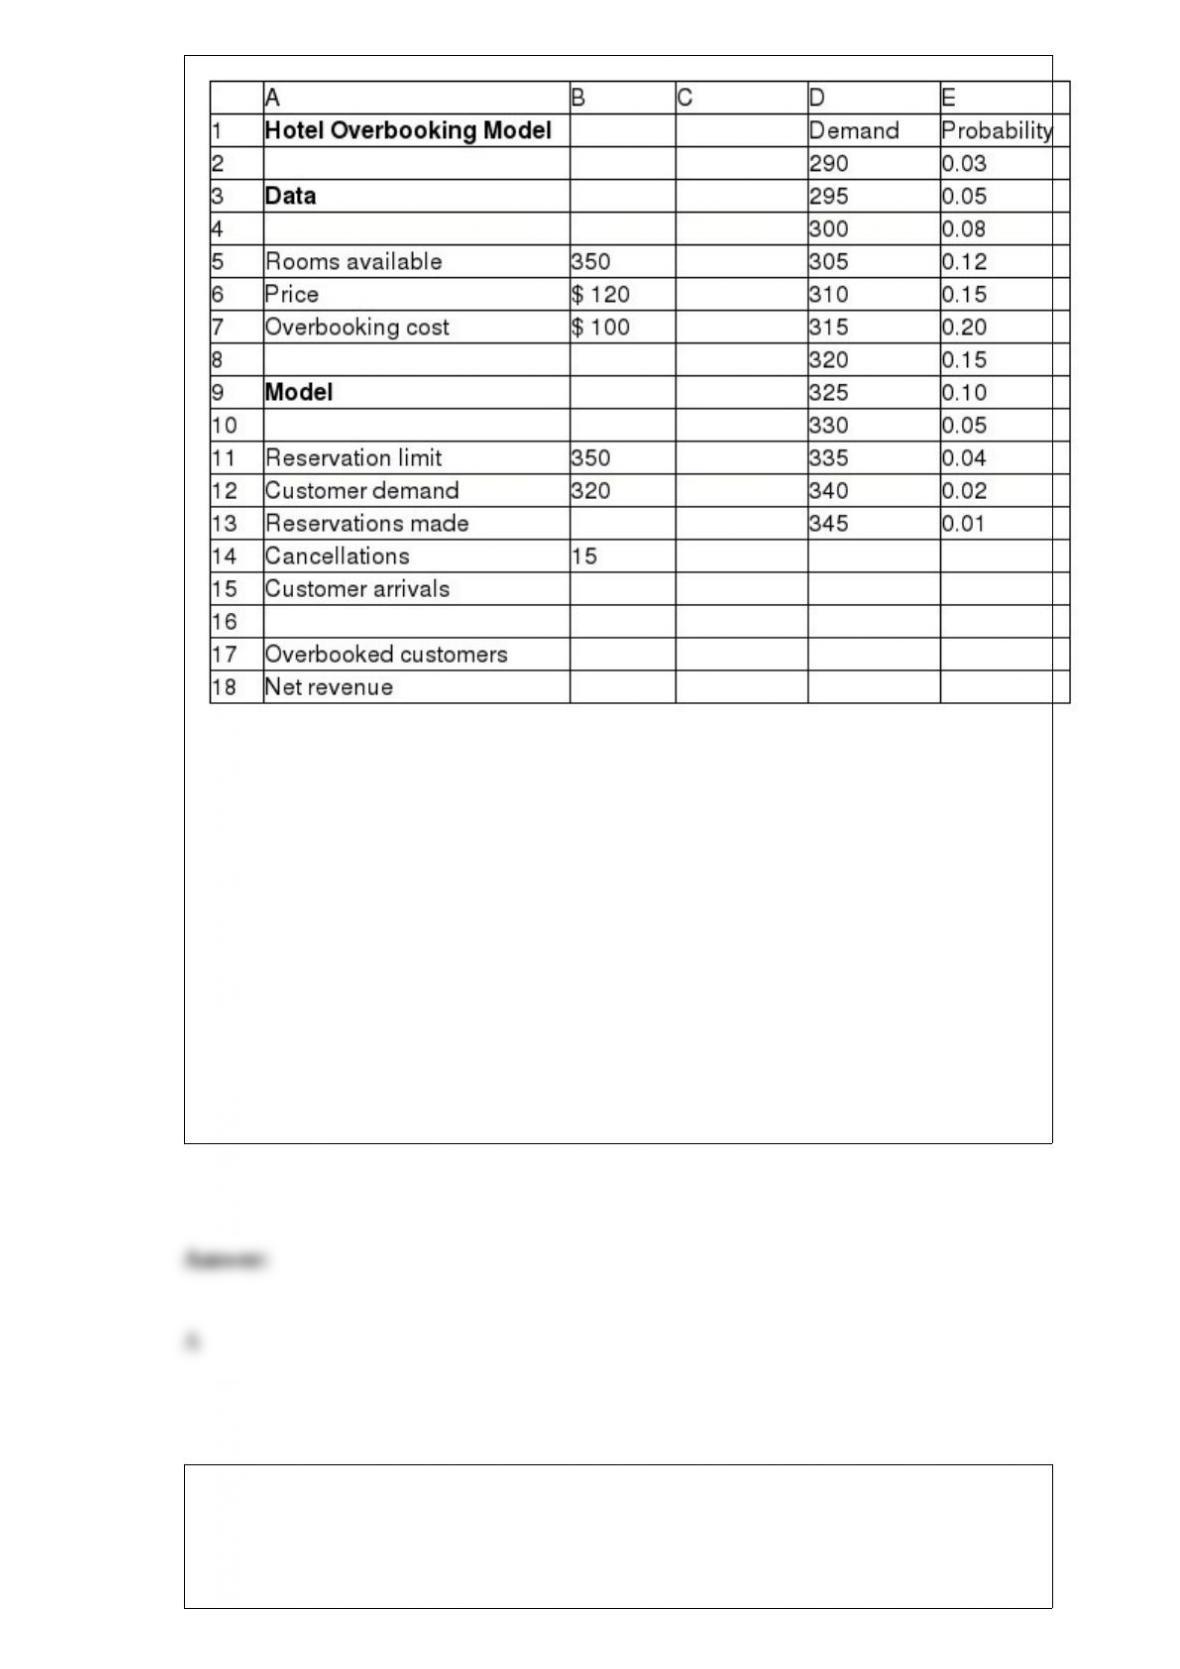
Assume that each reservation has a constant probability p = 0.04 of being cancelled.
Answer the question(s) using the Risk Solver Platform.
With respect to B12, what is the range of weights given in the Parameters section in the
Discrete dialog?
A) $E$2:$E$13
B) $D$2:$D$8
C) $D$2:$D$13
D) $E$2:$E$8
Which of the following is true of the binomial distribution?
A) The expected value of the binomial distribution is np(1 – p), where n is the number
of experiments and p is the probability of success.
B) The binomial distribution can assume different shapes and amounts of skewness,
depending on the parameters.
C) In Excel’s binomial distribution function, setting cumulative to TRUE will provide
the probability mass function for a specified value.
D) The expected value of the binomial distribution is λ, a constant.
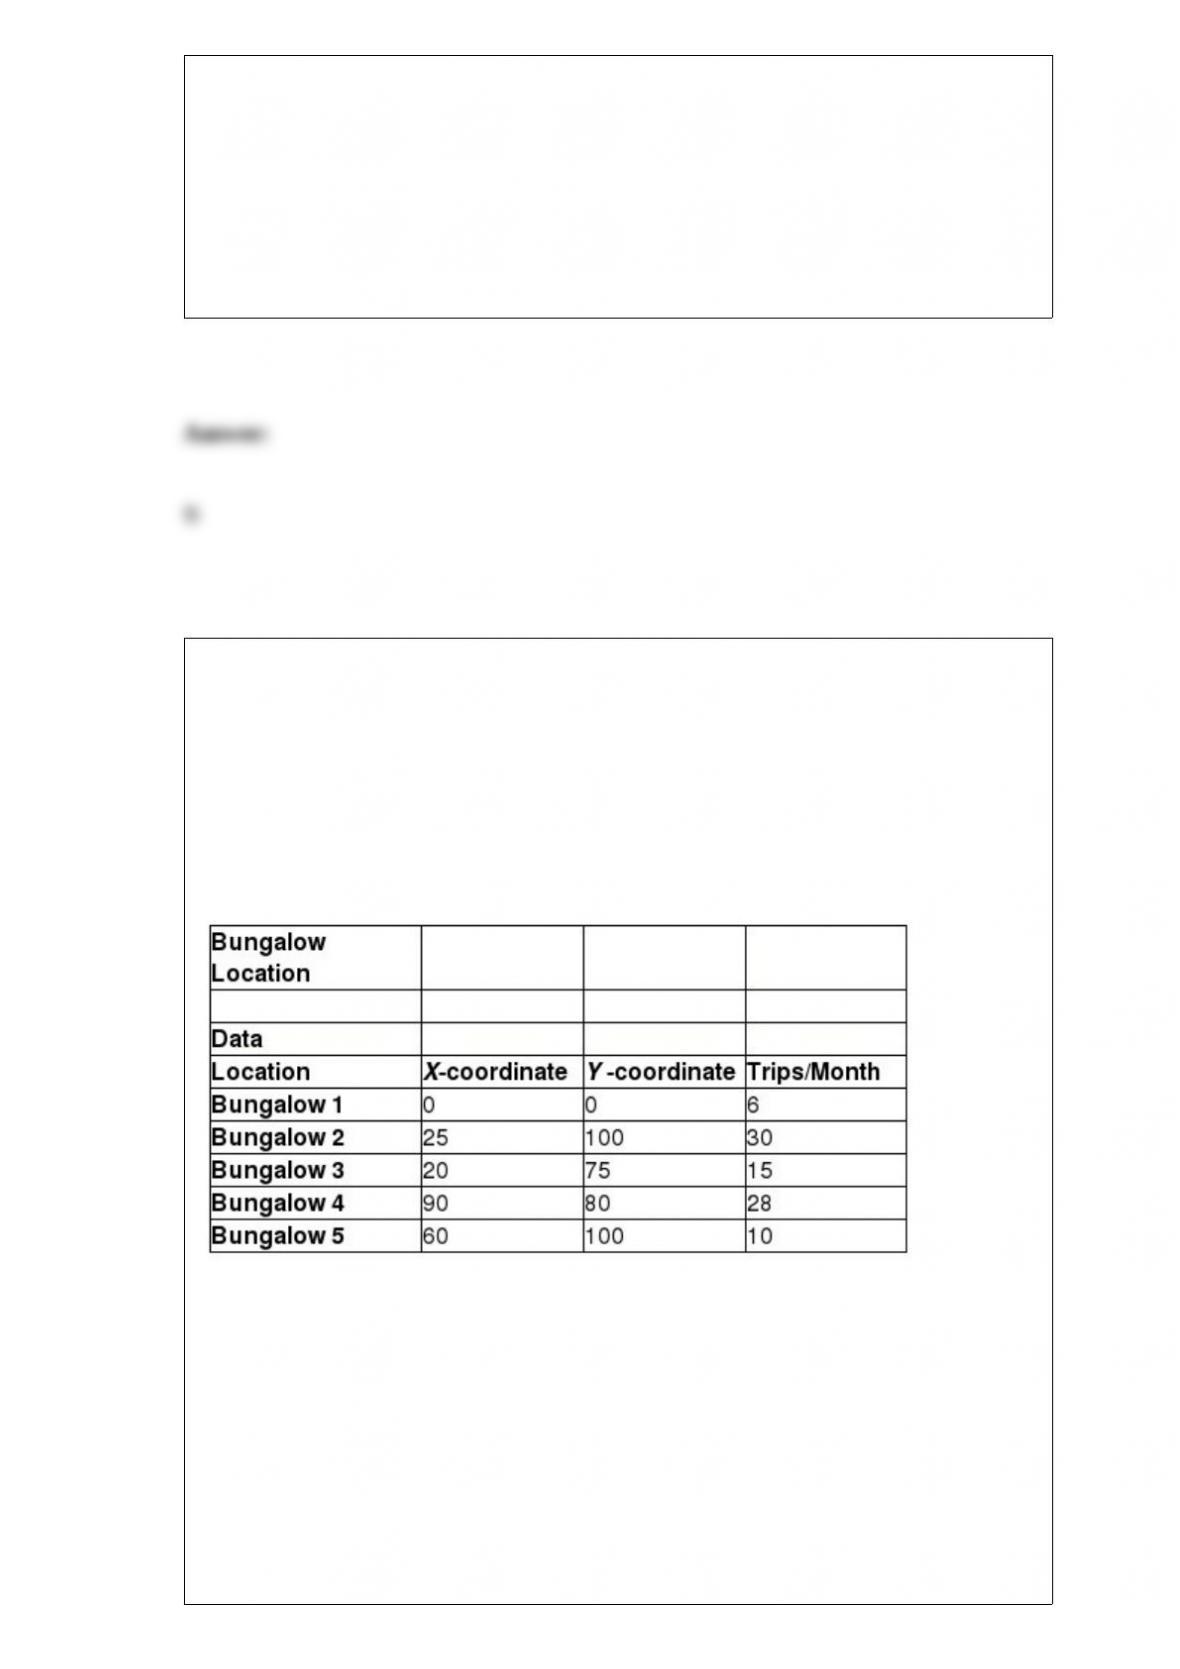
Shirley Templeton is a real estate agent for Paralol Realty. Shirley is given the
responsibility to manage potential customers for 5 of the Realty’s bungalows. These 5
bungalows are situated in close proximity. In order to make traveling easier, Shirley
decides to move to a location closer to the 5 bungalows. The table below gives the
location (X and Y coordinates) of the 5 bungalows along with the number of trips she
would have to make to each bungalow. Create a nonlinear model based on the data
given in the table below noting that the objective is to reduce the weighted distance
between Shirley’s accommodation and the 5 bungalows.
According to the model, what is the weighted distance between Shirley’s new
accommodation and Bungalow 5?
A) 435.89
B) 1529.39
C) 589.25
D) 250.78
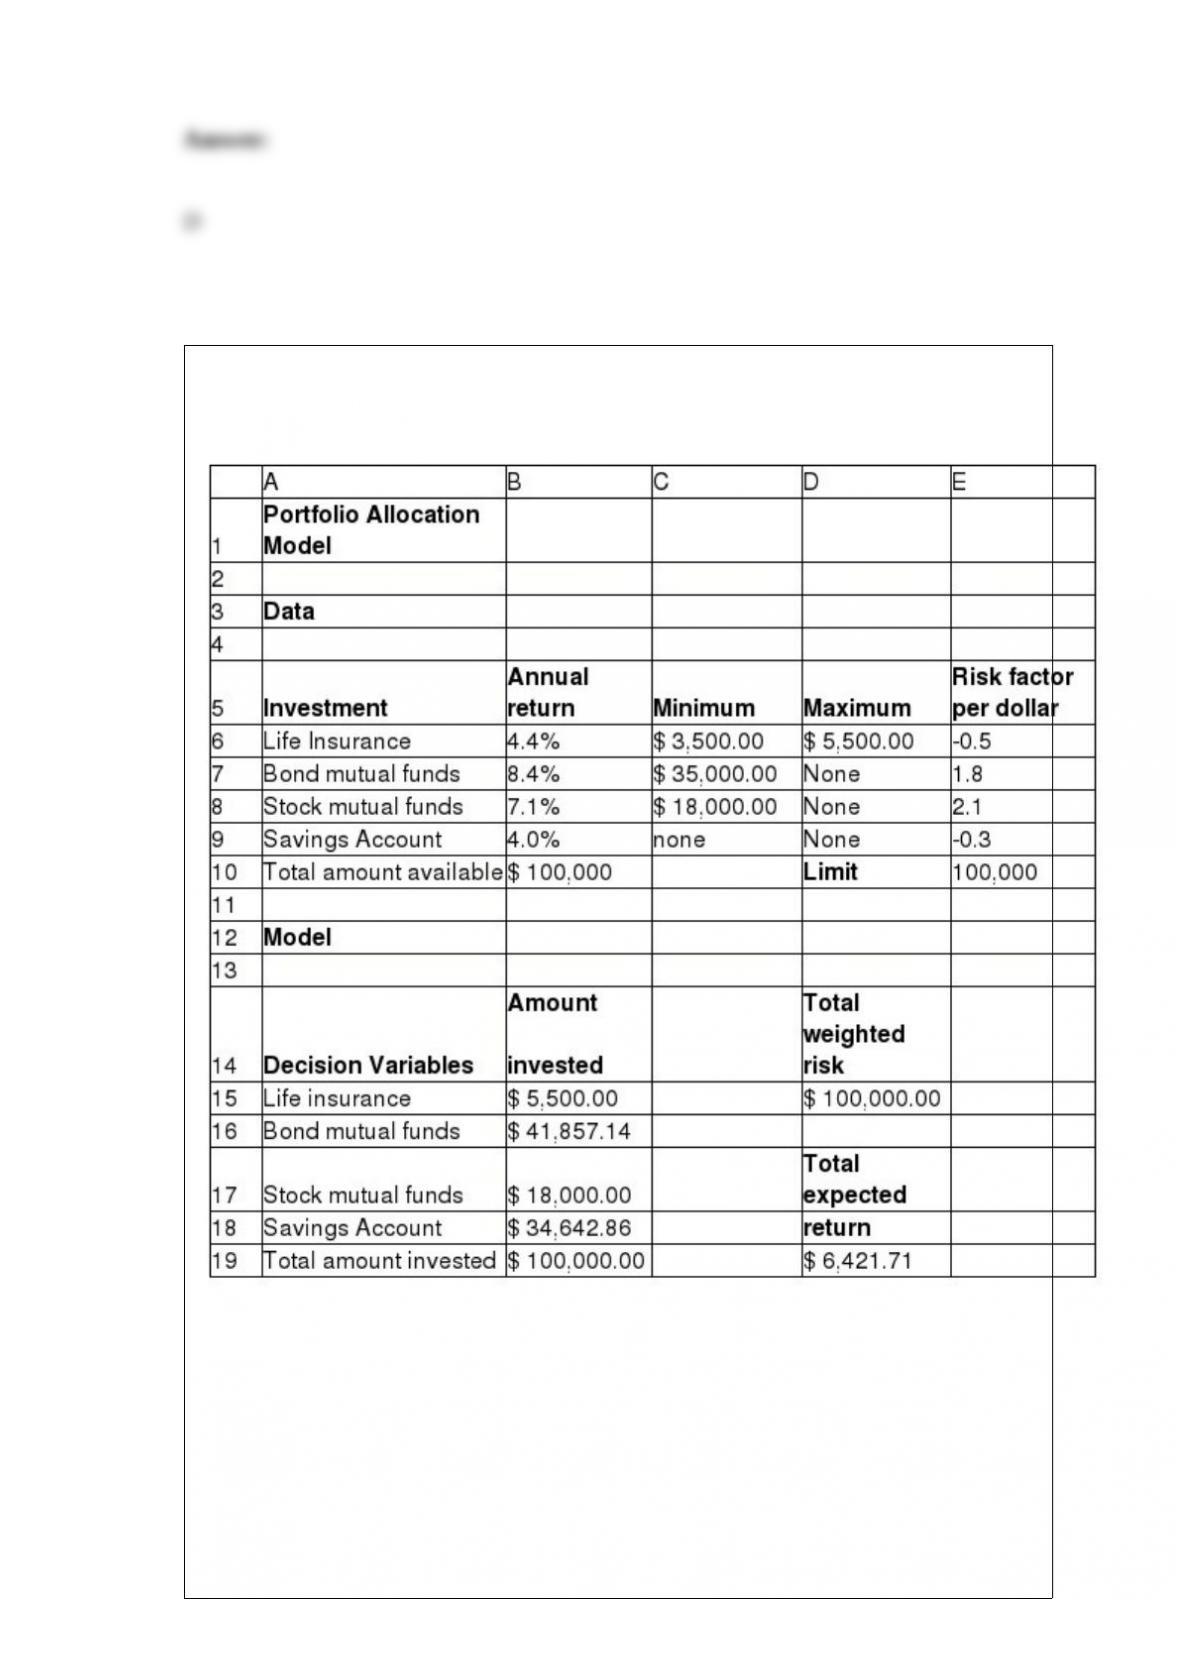
Below is the spreadsheet for a portfolio allocation model.
Answer the following question(s) using a model with uncertainty on type of investment
return. Assume that the distributions of life insurance annual return is uniform with
minimum 4% and maximum 6%, bond mutual funds annual return is normal with mean
7% and standard deviation 1%, stock mutual funds annual return is lognormal with
mean 11% and standard deviation 4%. Use 10,000 trials and 1 for random seed for the
simulation.
What is the value of mode obtained from the simulation results for maximizing the total
expected return? [Hint: Choose the approximate value.]

A) $ 6,378.39
B) $ 5,848.24
C) $ 5,281.79
D) $ 7,025.86
Given that Q = order quantity, D = annual demand, C = unit cost of the item, C0 = cost
per order placed, i = inventory carrying charge per unit, which of the following
represents the holding cost per unit?
A) D/Q
B) iC
C) (D/Q)C0
D) iCQ/2
Below is a spreadsheet for Trance Electronics.
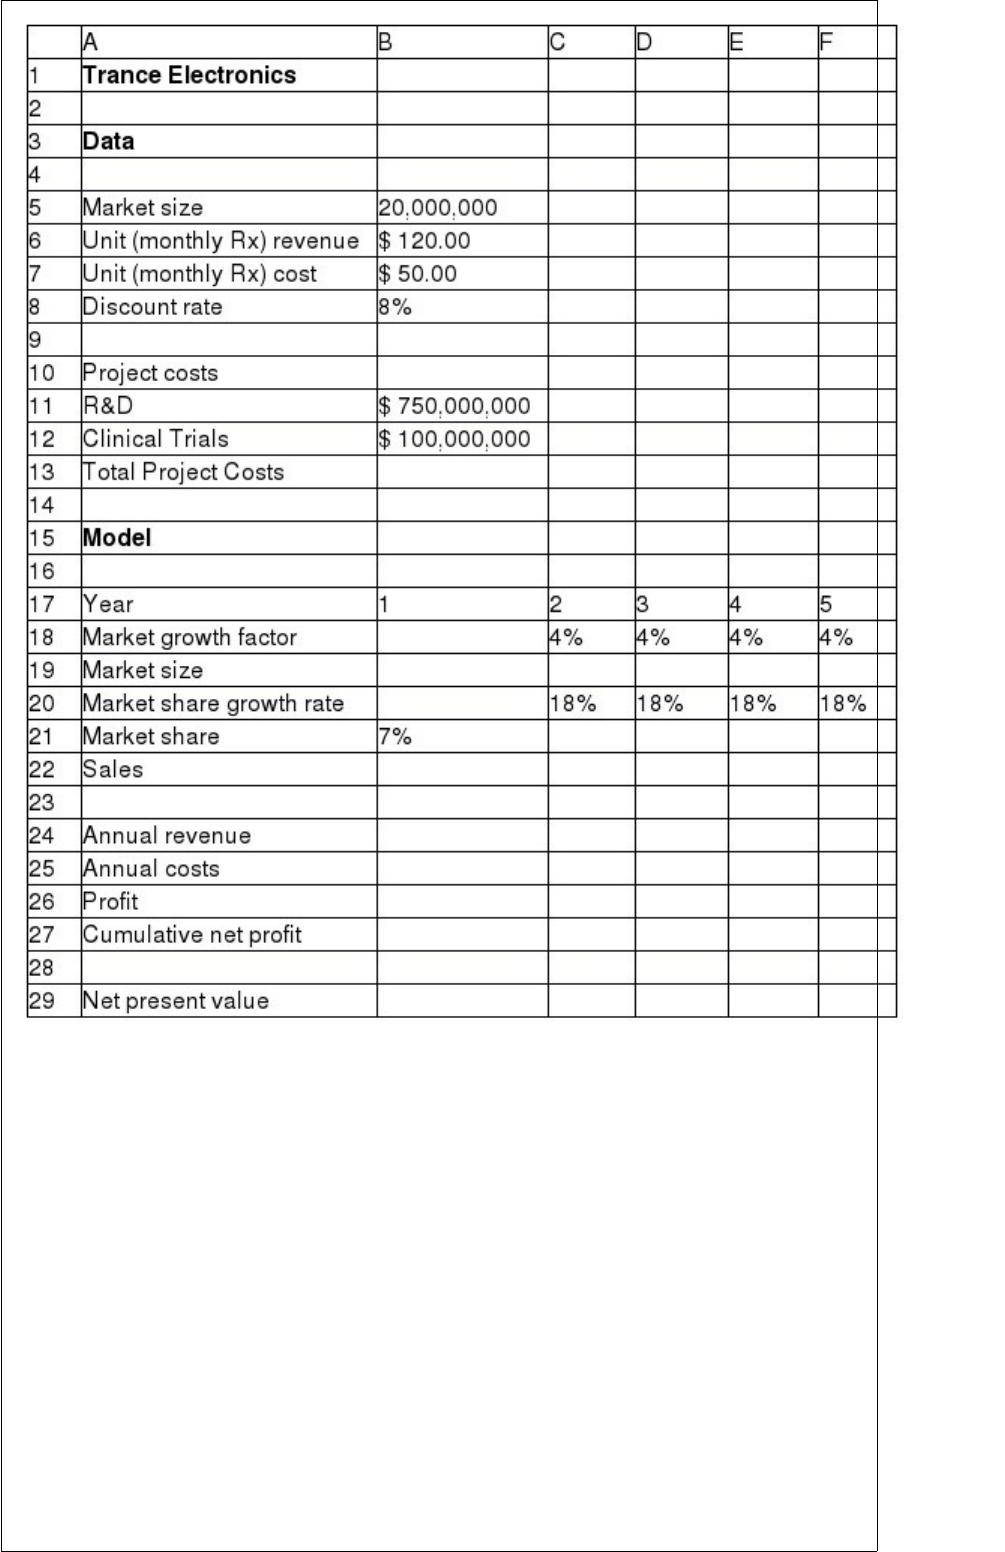
Suppose that the project manager of Trance Electronics has identified the following
uncertain variables in the model and the distributions and parameters that describe
them, as follows: Market size: normal with mean of 20,000,000 units and standard
deviation of 4,000,000 units. R&D costs: uniform between $600,000,000 and
$800,000,000.
Clinical trial costs: lognormal with mean of $150,000,000 and standard deviation
$30,000,000. Annual market growth factor: triangular with minimum = 2%,
maximum = 6%, and most likely = 3%.
Annual market share growth rate: triangular with minimum = 15%, maximum =
25%, and most likely = 20%.
The number of trials per simulation is equal to 10,000 at a Sim. Random Seed of 2. Run
the simulation and answer the following questions using the Risk Solver Platform.
With reference to the trend chart, which year shows the highest uncertainty in
forecasting the future?

A) Year 1
B) Year 3
C) Year 4
D) Year 5
Which of the following charts allows plotting of multiple dimensions of several data
series?
A) Doughnut chart
B) Bubble chart
C) Radar chart
D) Area chart
Which of the following functions is a logical function that returns TRUE if any
condition is true and FALSE if not?
A) TO(value if true, value if false)
B) AND(condition 1, condition 2’¦)
C) OR(condition 1, condition 2’¦)
D) IF(condition, value if true, value if false)
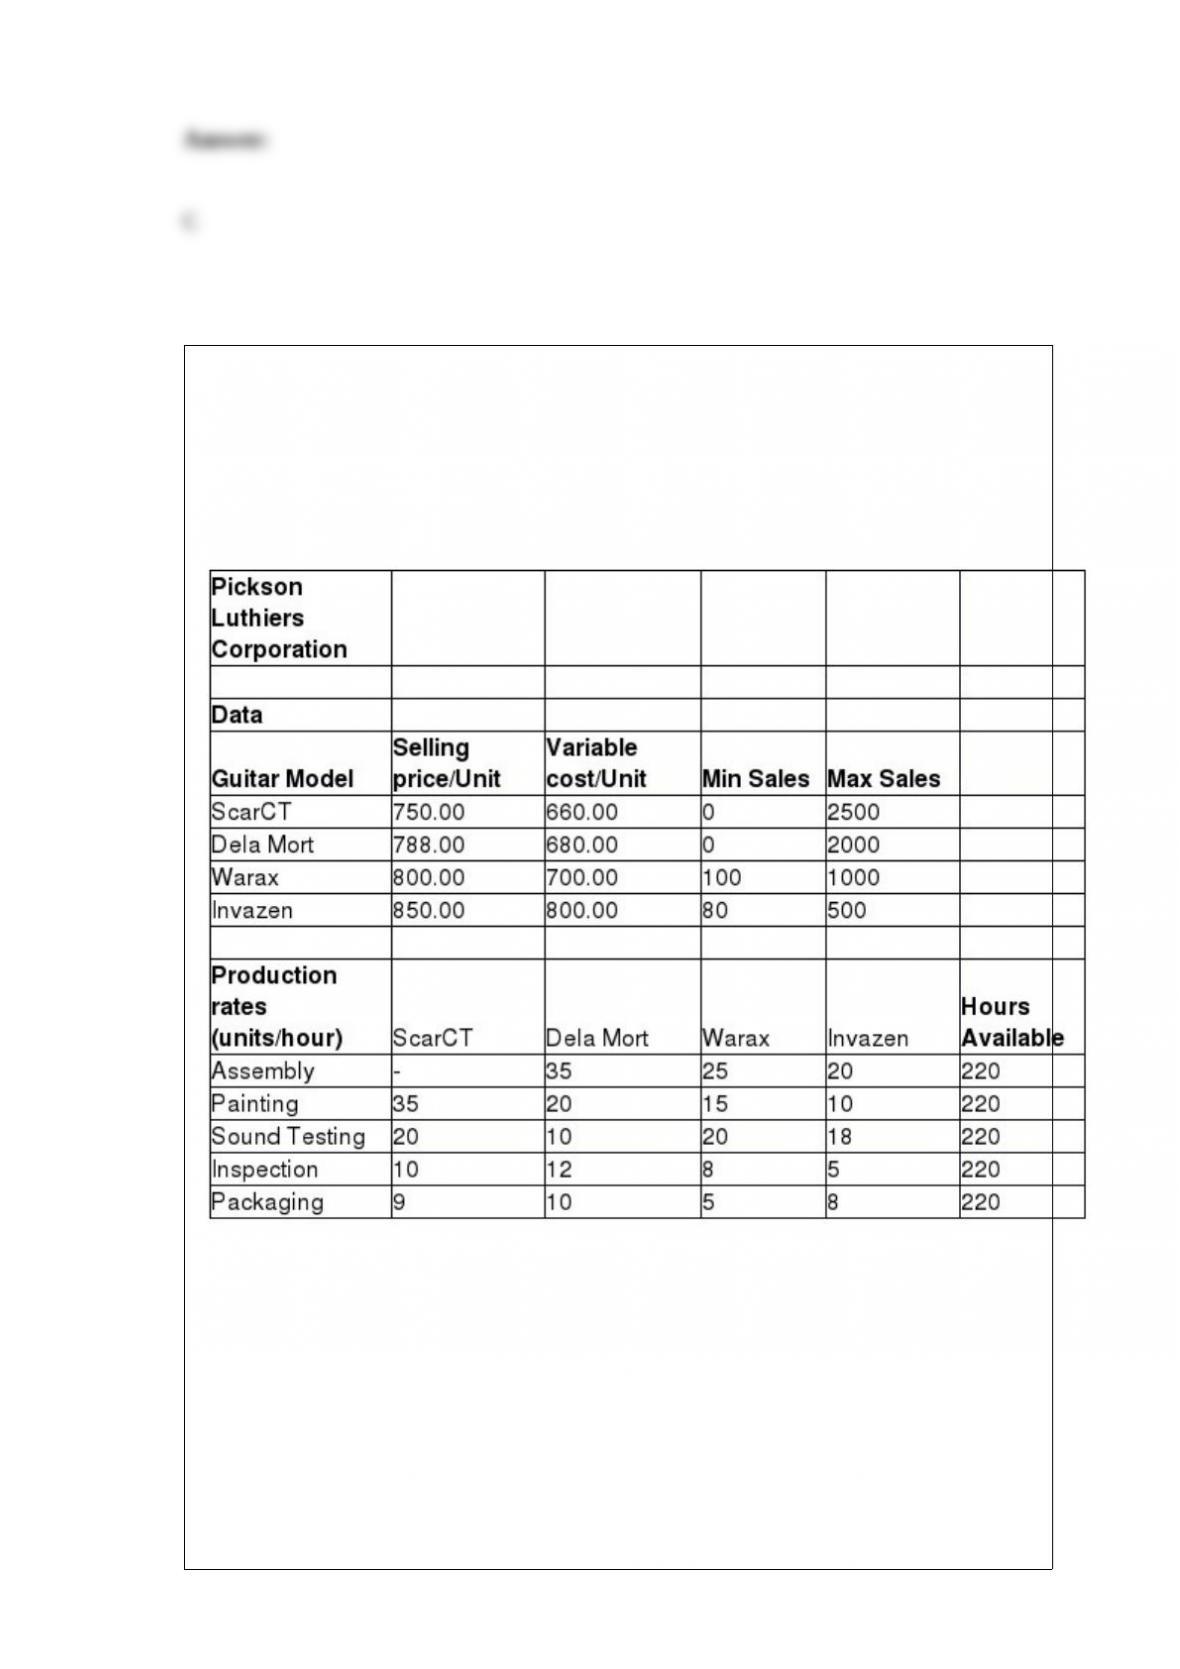
Pickson Luthiers Corporation makes four models of electric guitars, ScarCT, Dela Mort,
Warax, and Invazen. Each guitar must flow through five departments, assembly,
painting, sound testing, inspection, and packaging. The table below shows the relevant
data. Production rates are shown in units/hour. (ScarCT is assembled elsewhere).
Pickson wants to determine how many guitars to make to maximize monthly profit.
According to the linear optimization model, what would be the total time spent for
packaging the Invazen models?
A) 8
B) 16
C) 20
D) 10

Which of the following questions will prescriptive analytics help a company address?
A) How many and what types of complaints did they resolve?
B) What is the best way of shipping goods from their factories to minimize costs?
C) What do they expect to pay for fuel over the next several months?
D) What will happen if demand falls by 10% or if supplier prices go up 5%?
Which of the following types of conditions is most likely to render a midrange value
useless? A) having repetitious values in the data set
B) having the data arranged from least to greatest in value
C) having a small sample size
D) having extreme values in a data
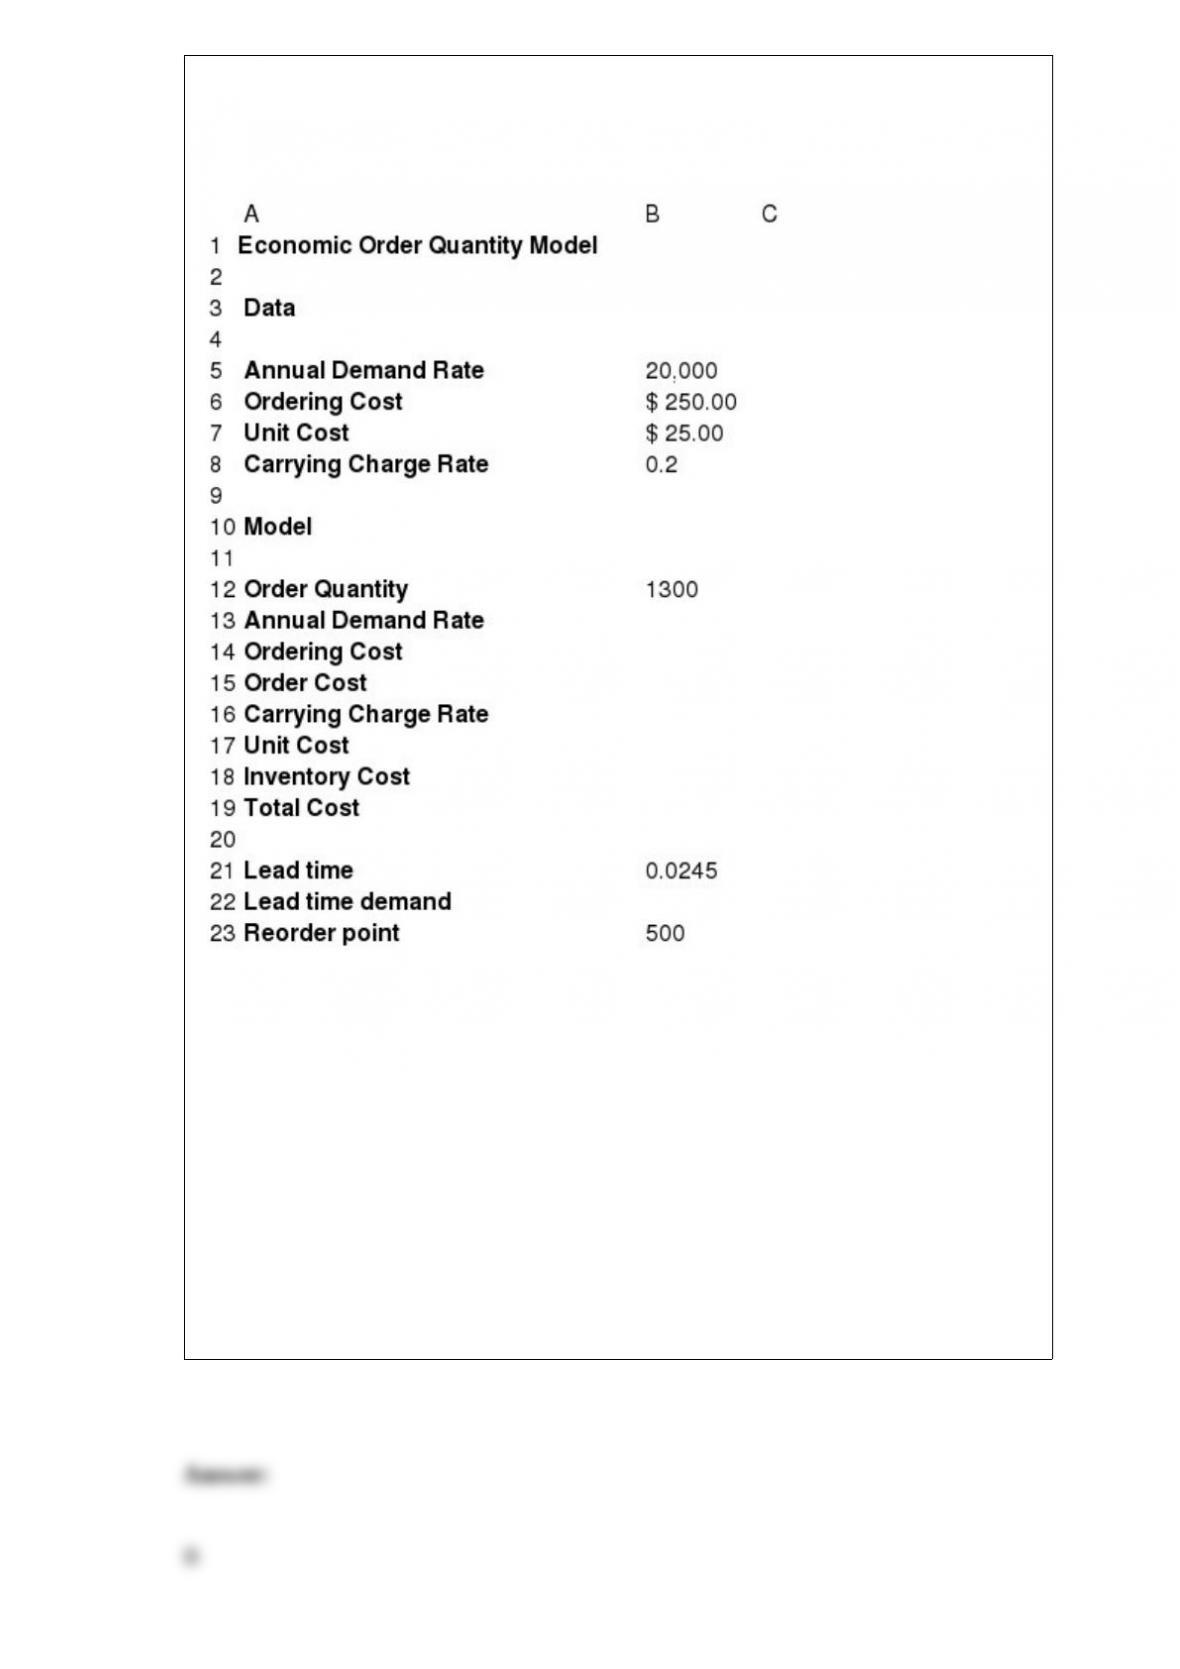
Below is the spreadsheet for an economic order quantity model.
Assume that the distribution of demand is normal with a mean of 20,000 and standard
deviation of 2,000.
What is the value of standard deviation obtained from the simulation results?
A) 35.0
B) 49.0
C) 56.0
D) 41.0

Spam filtering for e-mails can be seen as an example of which of the following types of
approaches of data mining?
A) reduction
B) association
C) cause-and-effect modeling
D) classification
Which of the following is true about the classical definition of probability?
A) It is based on judgment and experience.
B) If the process that generates the outcomes is known, probabilities can be deduced
from theoretical arguments.
C) The probability that an outcome will occur is simply the relative frequency
associated with that outcome.
D) It is based on observed data.
The manager at Soul Walk Inc., a shoe manufacturing company, wants to set a new
price (P) for a shoe model to maximize total profit. The demand (
D) as a function of price is represented as:

D = 1,500 – 2.5P
The total cost (C) as a function of demand is represented as:
C = 3,200 + 3.5D
Which of the following is a model for total profit as a function of price?
A) (1,508.75 price) – (2.5 price2) – 8,450
B) (3.5 price2) + 3,200 – (1925.50 price)
C) (1,250 price) + (5 price2) – 8,320
D) [4521 + (4.5 price)] price – 9684.25
While constructing a histogram, how is group width calculated?
A) number of groups (lower limit of the last group + upper limit of the first group)
B) (upper limit of the last group – lower limit of the first group) / number of groups
C) (upper limit of the first group + number of groups) lower limit of the last group +
number of groups)
D) (lower limit of the first group – number of groups) upper limit of the last group