NARRBEGIN: SA_83_86
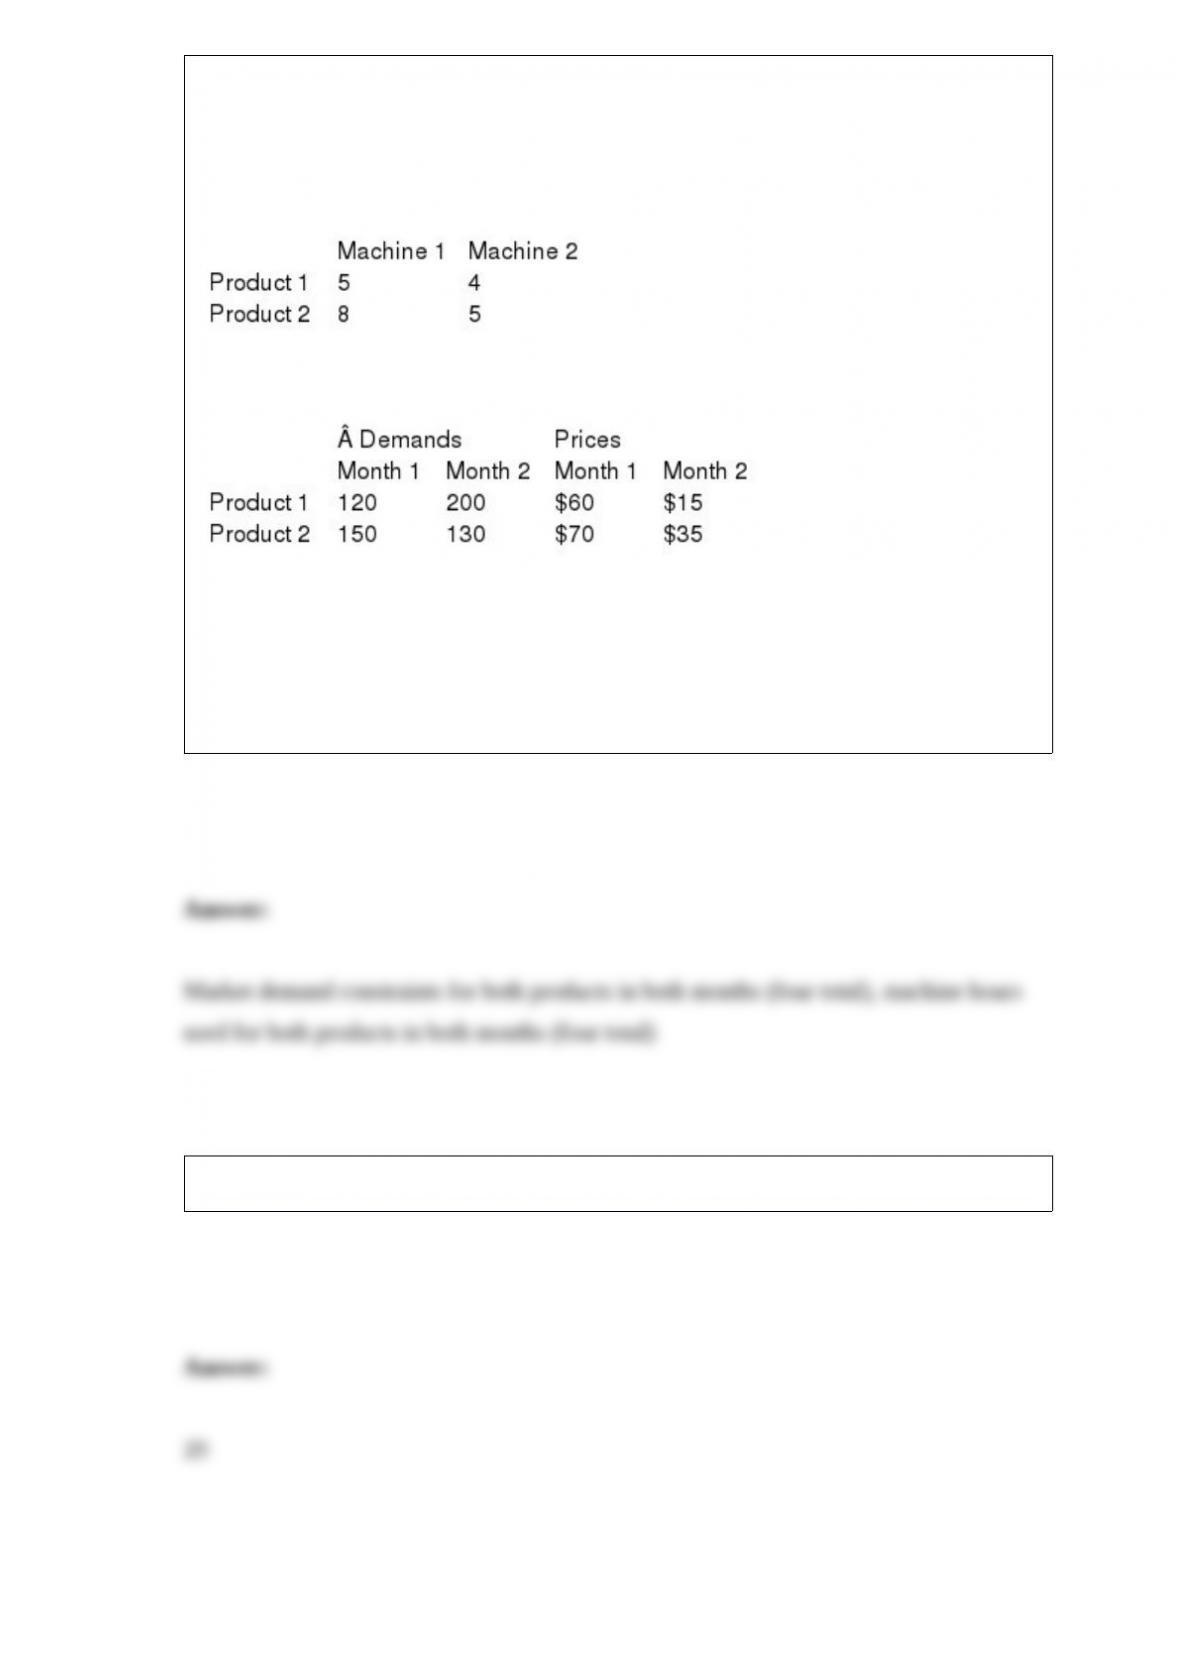
A company produces two products. Each product can be produced on either of two
machines. The time (in hours) required to produce each product on each machine is
shown below:
Each month, 600 hours of time are available on each machine, and that customers are
willing to buy up to the quantities of each product at the prices that are shown below:
The company’s goal is to maximize the revenue obtained from selling units during the
next two months.
NARREND
What are the constraints in this problem?
Seventy percent of the job applicants scored above what value?
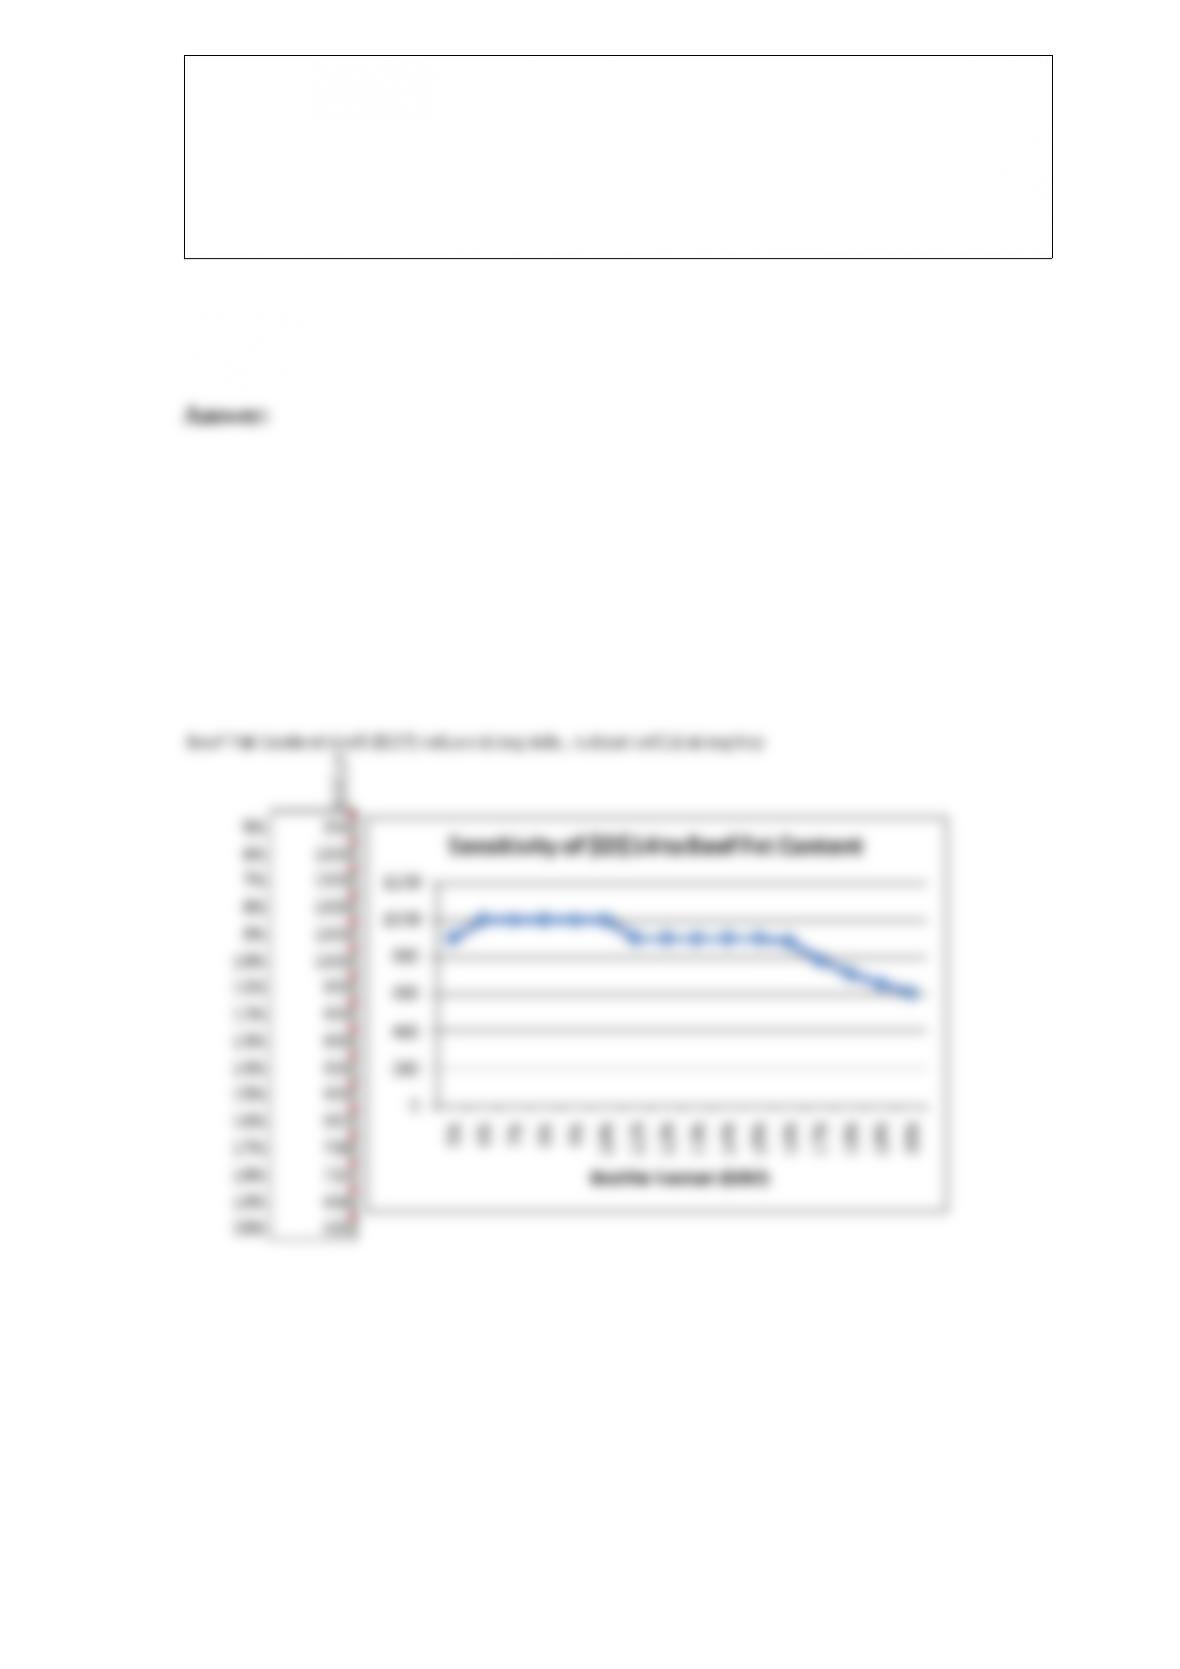
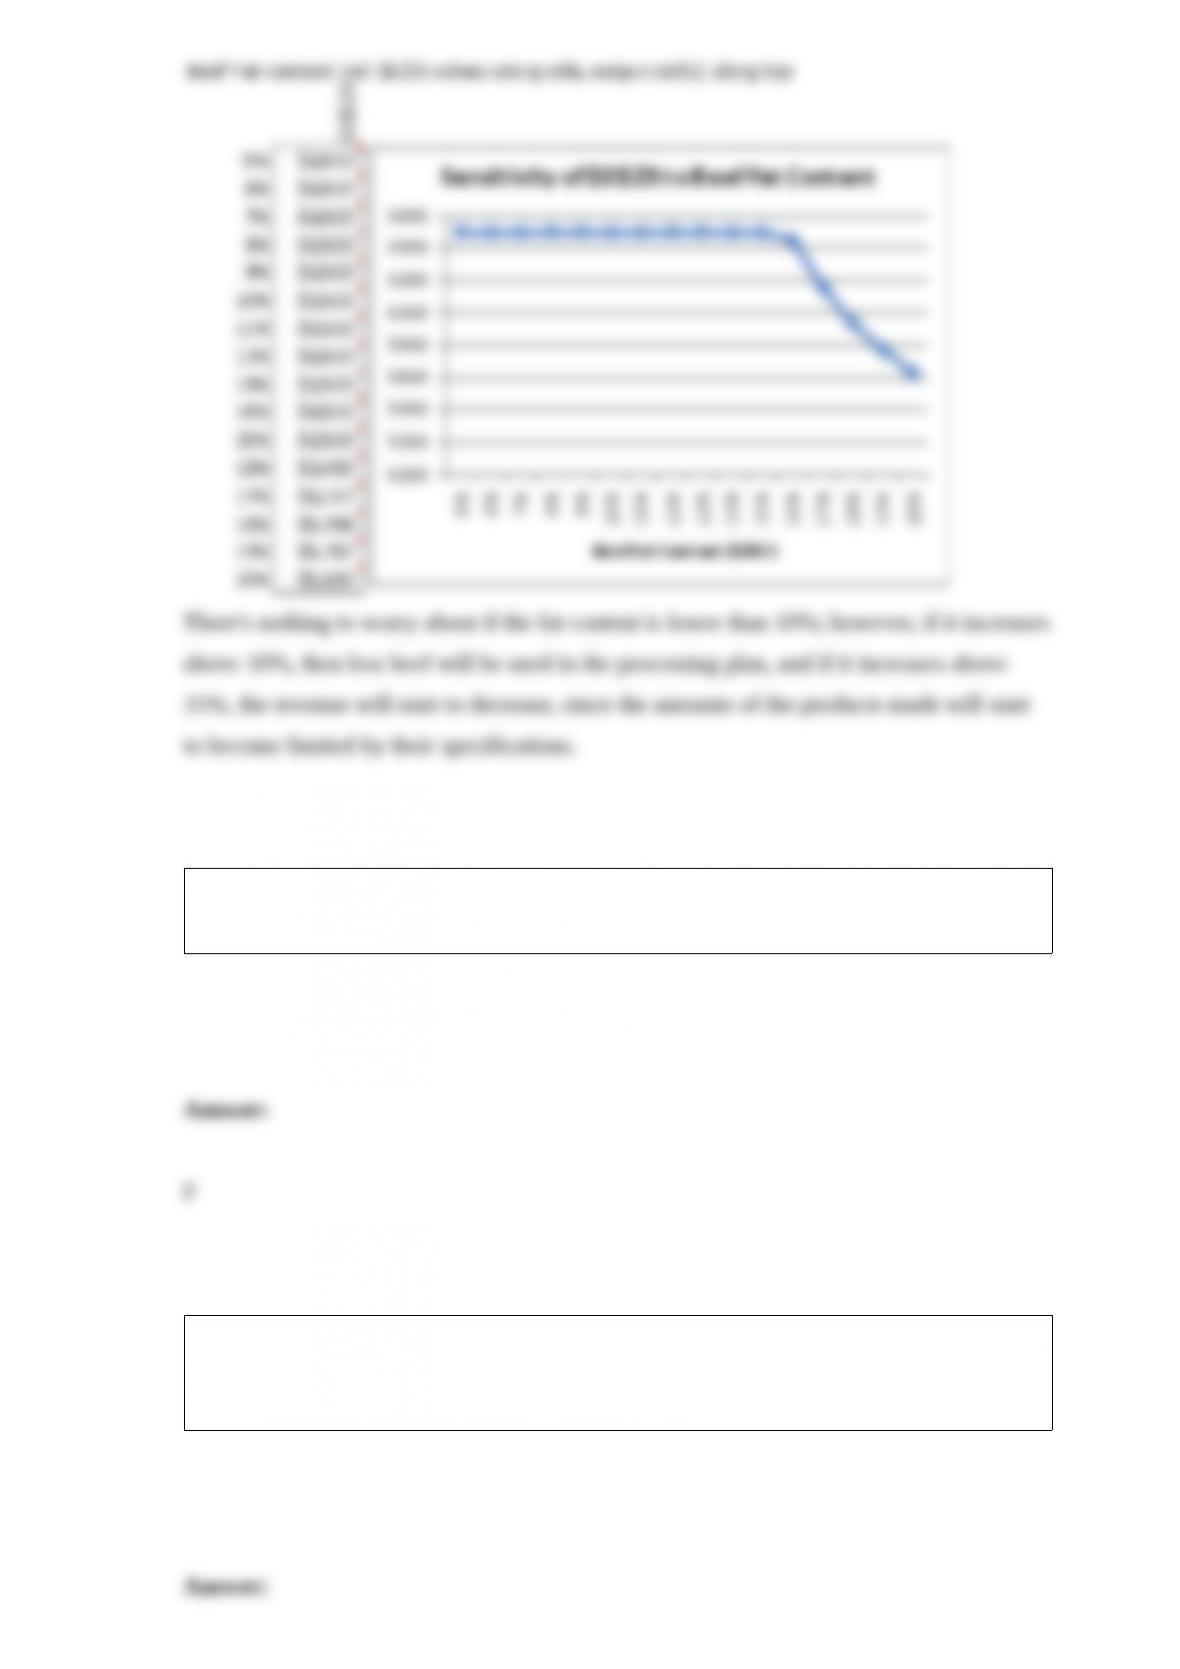
The market manager is concerned about variability in the fat content of beef, noting that
it actually can be as high as 20% and as low as 5%. For the model in Question 117,
perform a sensitivity analysis to determine the effect, first on the amount of beef used,
and then on the revenue. What do the results indicate? Should the manager be
concerned?
Graphical models are the least intuitive type of model. Its purpose is simply to provide
enough quantitative details to enable us solve the problem of interest.
When you use the expected monetary value (EMV) criterion, you are not using all of
the information that is shown in the risk profiles of alternatives, since you are only
comparing the means.

NARRBEGIN: SA_66_71
The weekly demand for a particular automobile manufacturer follows a normal
distribution with a mean of 40,000 cars and a standard deviation of 10,000. Below you
will find probability and percentile calculations related to the customer purchase
amounts. Use this information to answer the following questions.
Probability Calculations
P(Sales < 2,000,000) = 0.134, P(Sales < 2,050,000) = 0.339
P(Sales < 2,100,000) = 0.609, P(Sales < 2,150,000) = 0.834
Percentiles Calculations
1st percentile = 1,912,245, 5th percentile = 1,961,388
95th percentile = 2,198,612, 99th percentile = 2,247,755
NARREND
What is the probability that this company will sell more than 2 million cars next year?
Using the standard normal curve, the Z– score representing the 75th percentile is 0.674.

Approximate the percentage of these Internet users who are married with formal
education beyond high school.
A one-tailed alternative is one that is supported by evidence in either direction.
A nonlinear programming problem (NLP) is an optimization problem in which the
objective function and/or the constraints are not linear functions of the decision
variables.
Suppose the allowable increase and decrease for an objective coefficient of a decision
variable that has a current value of $50 are $25 (increase) and $10 (decrease). If the
coefficient were to change from $50 to $60, the optimal value of the objective function
would not change.

In investment models, we typically must simulate the random investment weights
Of those in the sample who did well in the final exam, what percentage of them spent
the weekend before the exam studying?
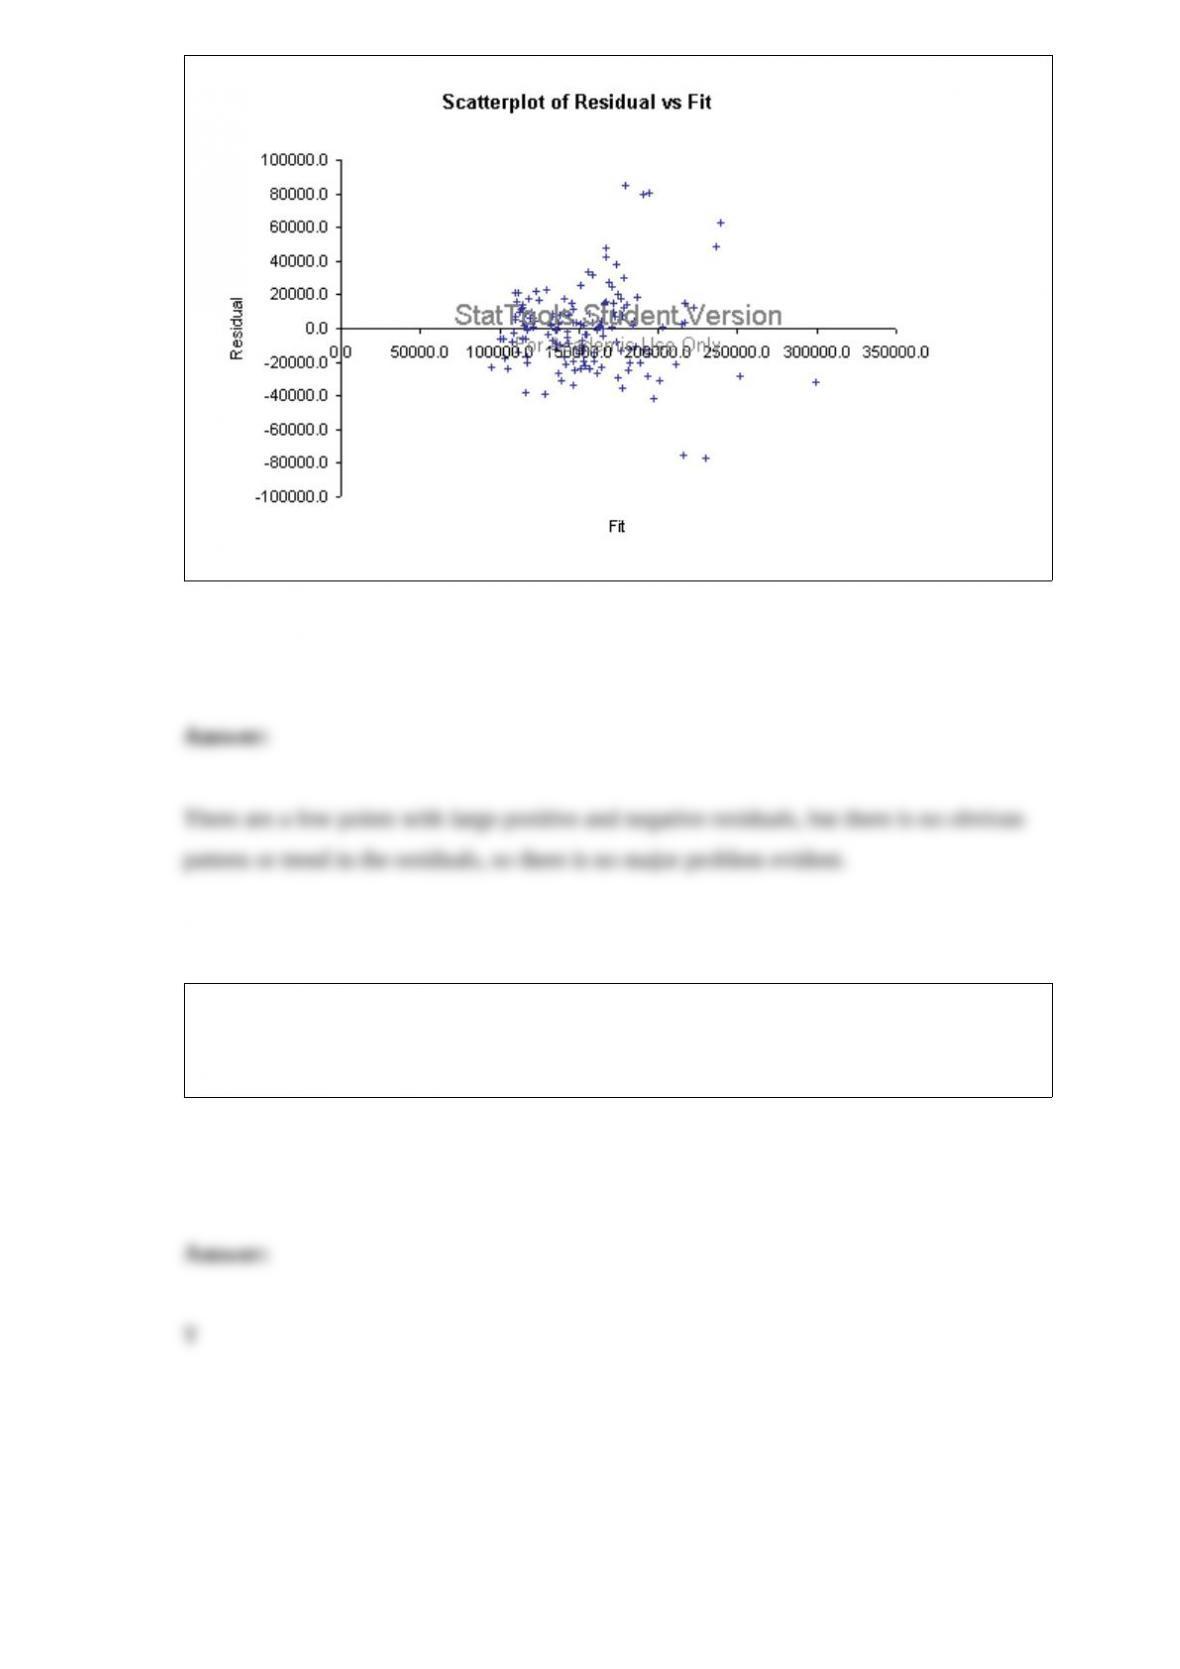
Do you see any problems evident in the plot below of residuals versus fitted values
from a multiple regression analysis? Explain your answer.
A variable (or field) is an attribute, or measurement, on members of a population,
whereas an observation (or case or record) is a list of all variable values for a single
member of a population.