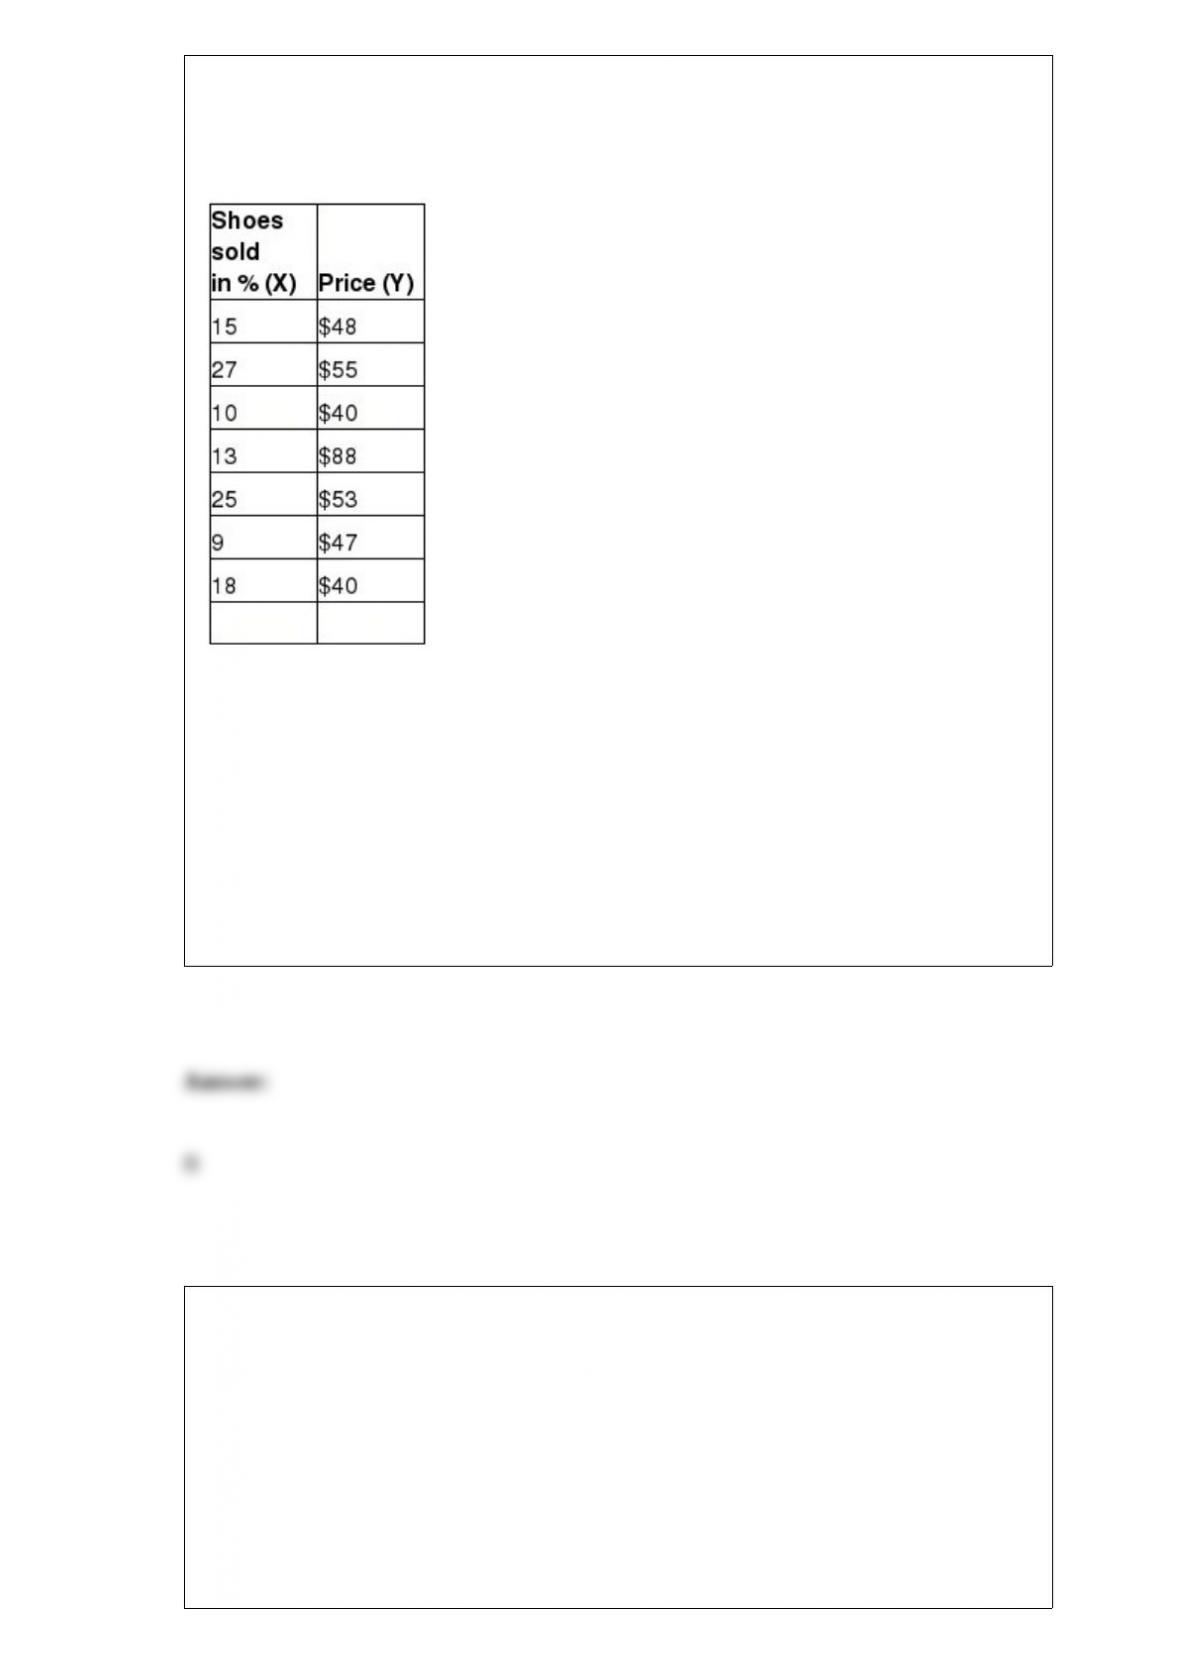
Below is the table showing rate of shoes sold per day and the highest-priced shoe sold
that day for a one-week period. The rate of shoes sold per day (X) and the price of the
shoes (Y).
Use Excel to calculate the correlation between variables X and Y.
A) 16.47
B) 0.02
C) 16.71
D) 7.04
Pickson Luthiers Corporation is studying where to locate a phone charging point on the
factory floor. The locations of five production cells are expressed as X– and
Y-coordinates on a rectangular grid of the factory layout. The daily demand for the
charging point (measured as the number of trips to the charging point) at each
production cell is also known. Because of the nature of the equipment layout in the
factory and for safety reasons, workers must travel along marked horizontal and vertical
aisles to access the charger. Thus, the distance from a cell to the charger is measured as
rectilinear distance.
The table below provides the relevant information.
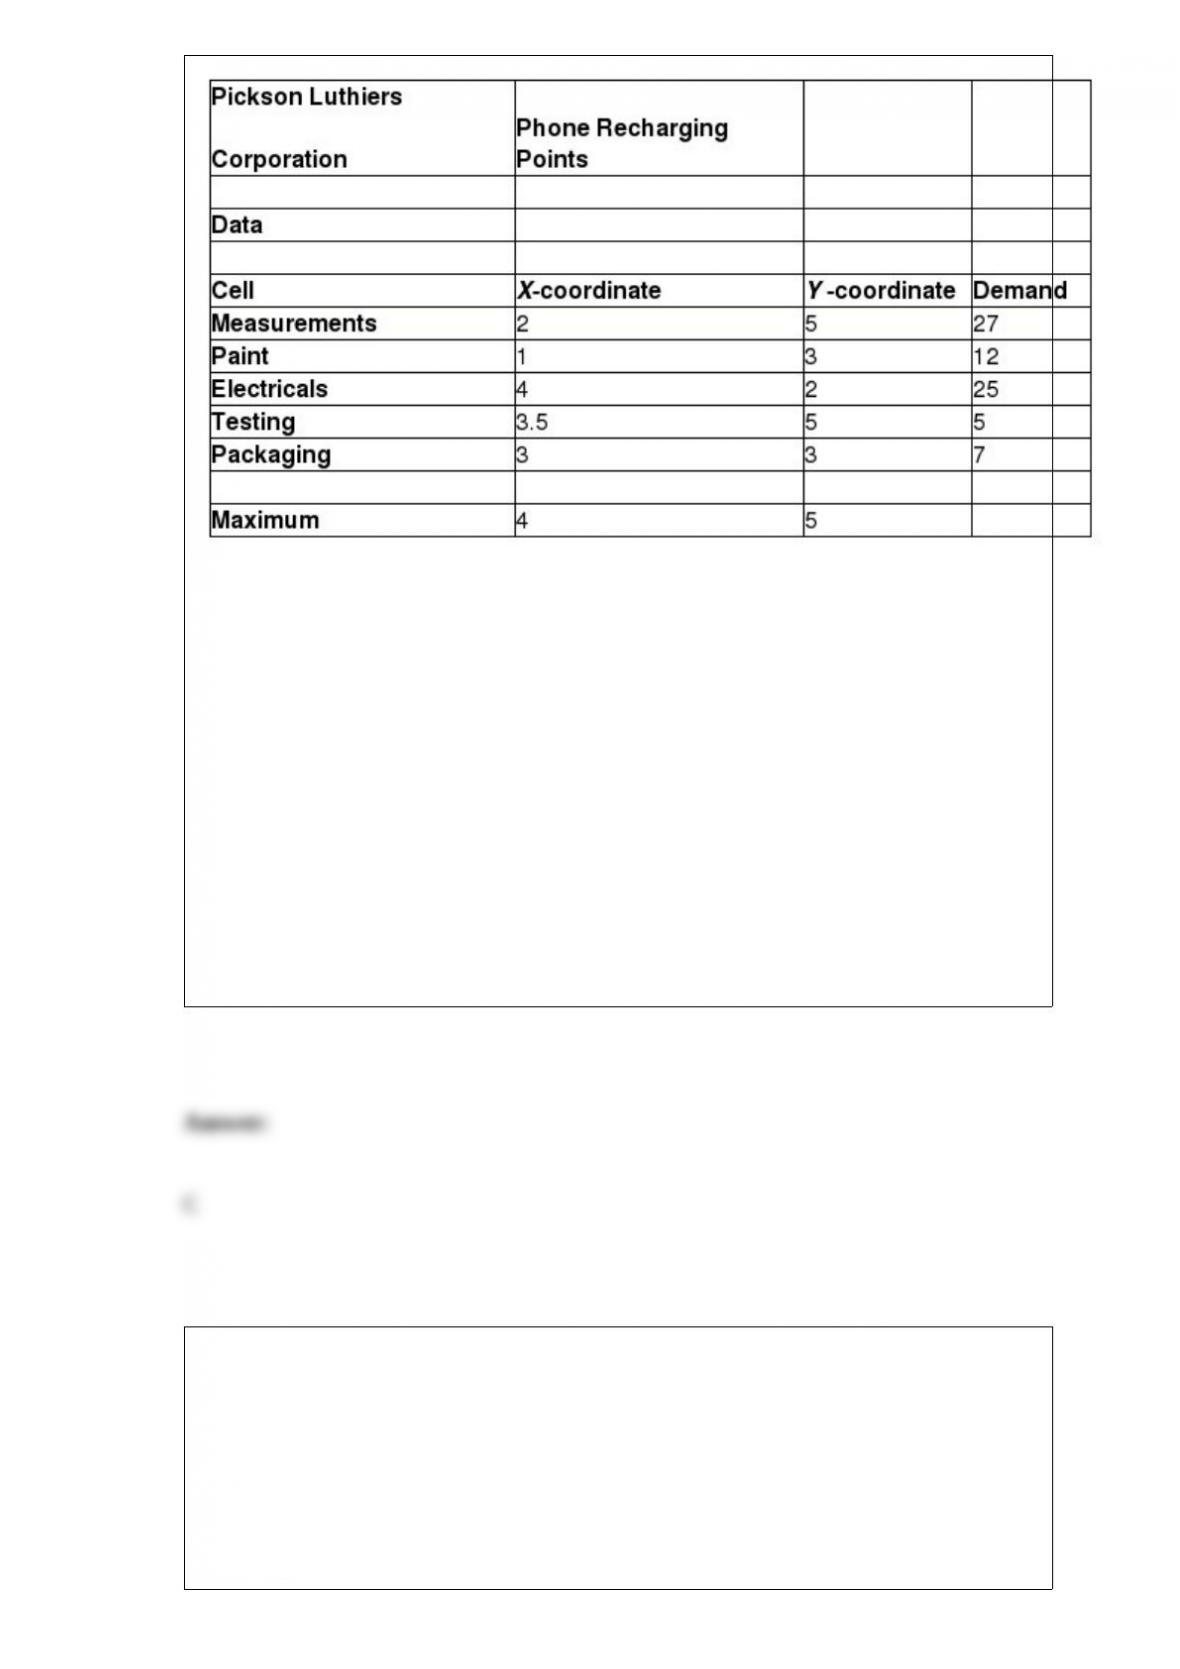
The optimal location should minimize the total weighted distance between the charging
point and all production cells, where the weights are the daily number of trips to the
phone charging point.
According to the model, which of the following is the weighted distance between the
phone charger and Packaging cell?
A) 10.50
B) 0
C) 7.00
D) 14.00
Shirley Templeton is a real estate agent for Paralol Realty. Shirley is given the
responsibility to manage potential customers for 5 of the Realty’s bungalows. These 5
bungalows are situated in close proximity. In order to make traveling easier, Shirley
decides to move to a location closer to the 5 bungalows. The table below gives the
location (X and Y coordinates) of the 5 bungalows along with the number of trips she
would have to make to each bungalow. Create a nonlinear model based on the data
given in the table below noting that the objective is to reduce the weighted distance
between Shirley’s accommodation and the 5 bungalows.
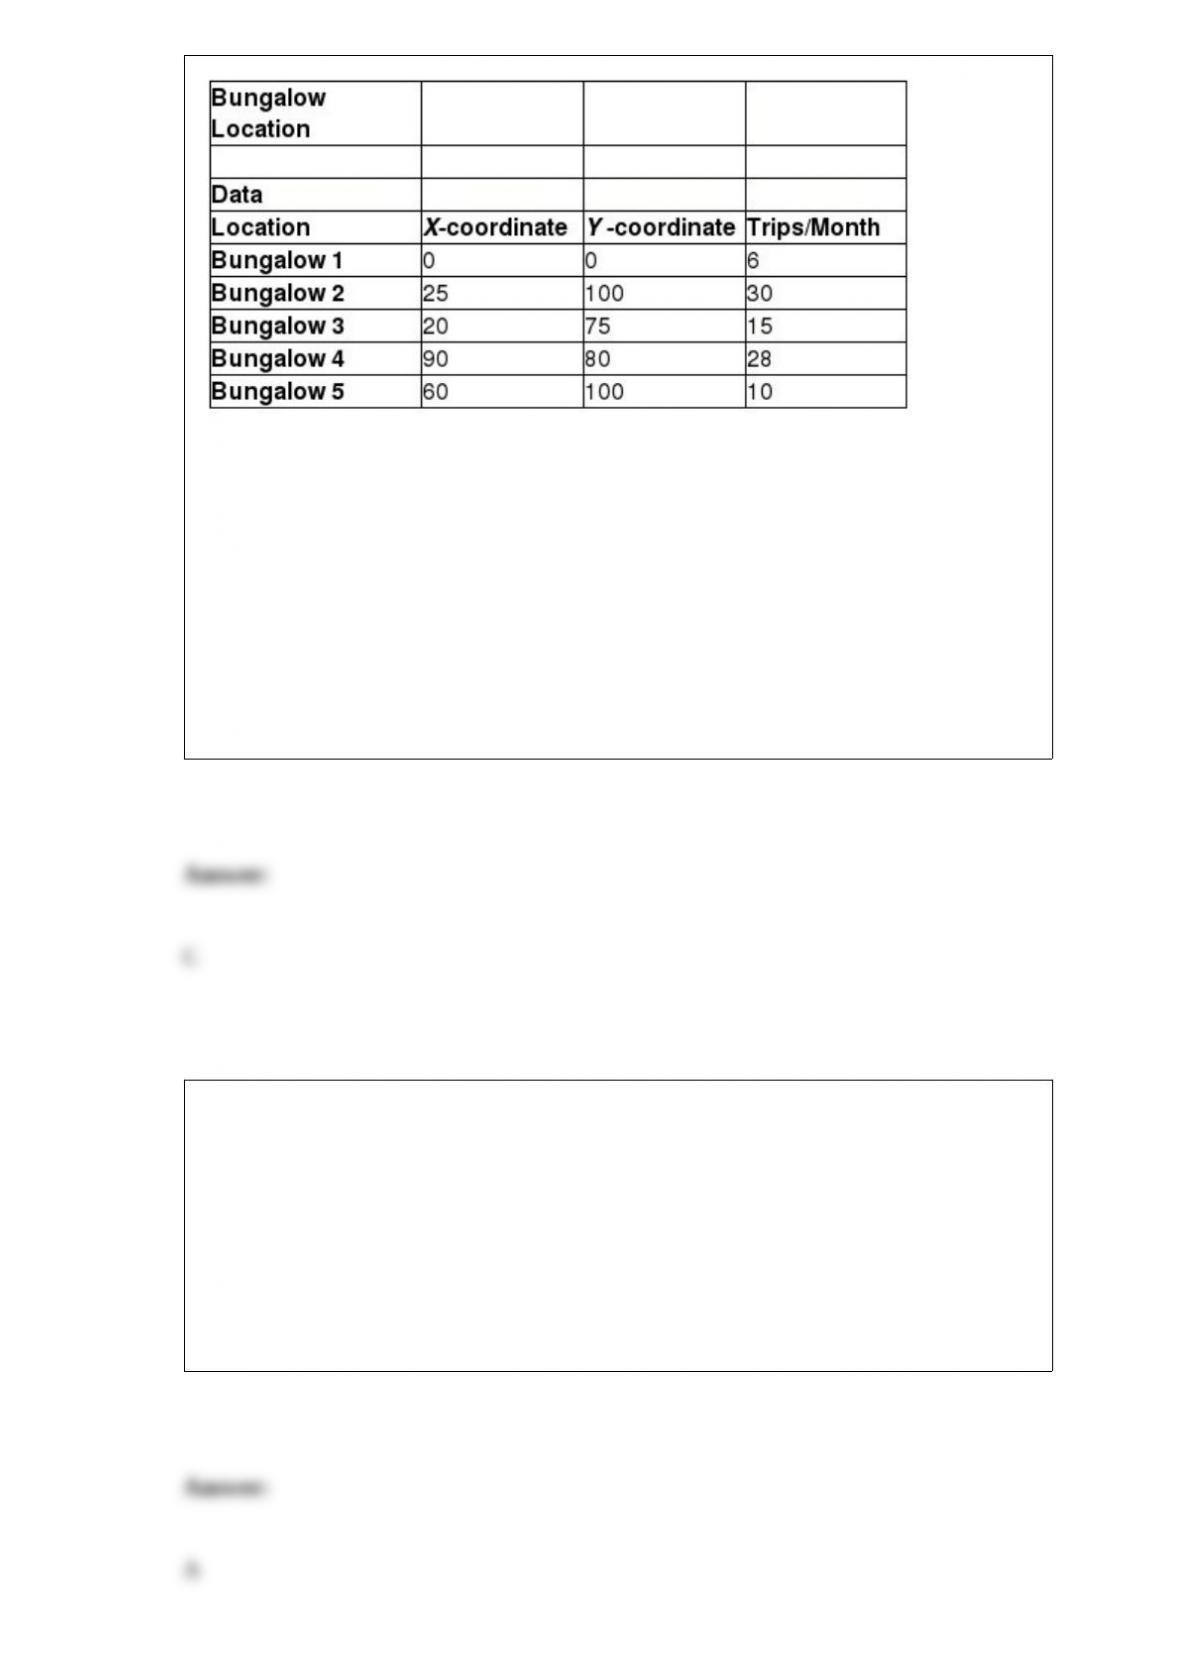
According to the model, what is the weighted distance between Shirley’s new
accommodation and Bungalow 4?
A) 589.25
B) 346.77
C) 1529.39
D) 3152.08
Which of the following is true about cross-tabulation?
A) All subcategories together must constitute the complete data set.
B) A cross-tabulation table is often called a latent class model.
C) Each observation can be classified into many subcategories.
D) The table displays the number of categorical variables between two observations.
The Excel function of
A) SUM(range)
B) COUNT(range)
C) MAX(range)
D) COUNTIF(range, criteri A)
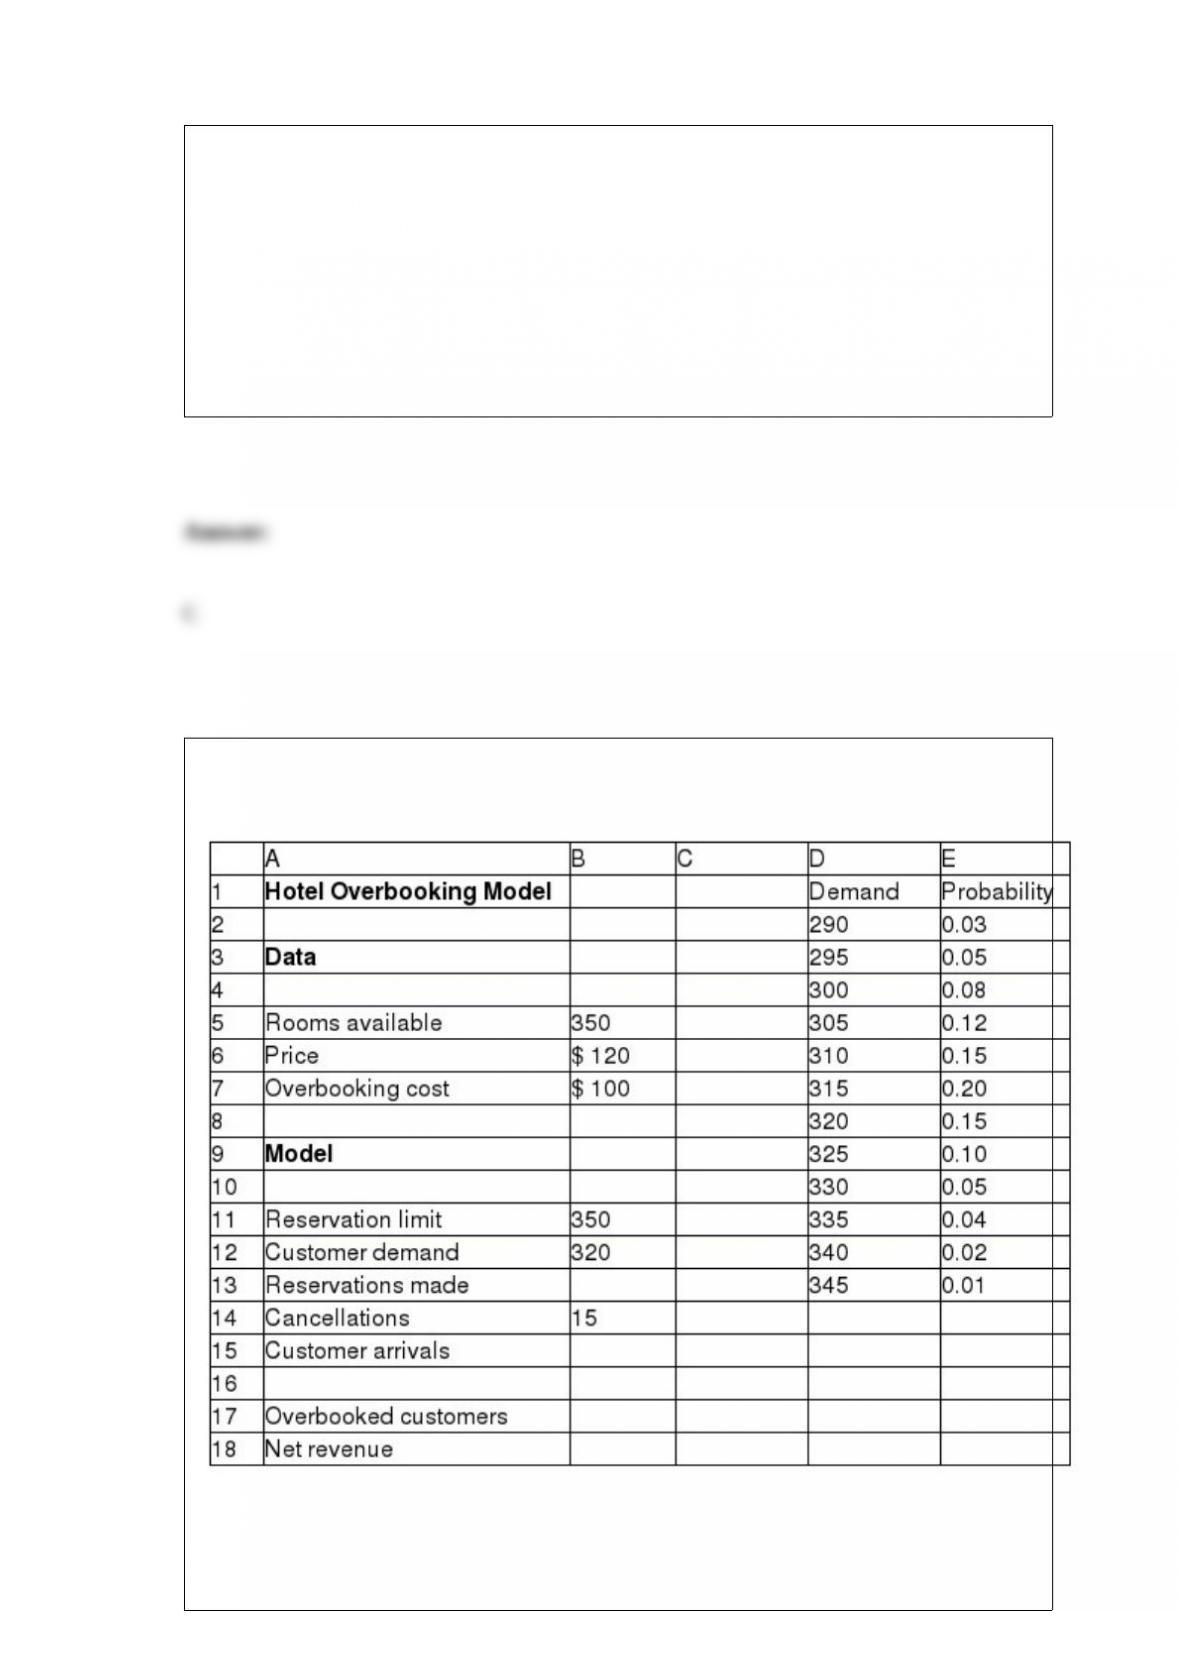
Below is a spreadsheet for a hotel overbooking model.
Assume that each reservation has a constant probability p = 0.04 of being cancelled.
Answer the question(s) using the Risk Solver Platform.
With respect to B12, what is the range for values given in the Parameters section in the
Discrete dialog?
A) $E$2:$E$13
B) $D$2:$D$8
C) $D$2:$D$13
D) $E$2:$E$8
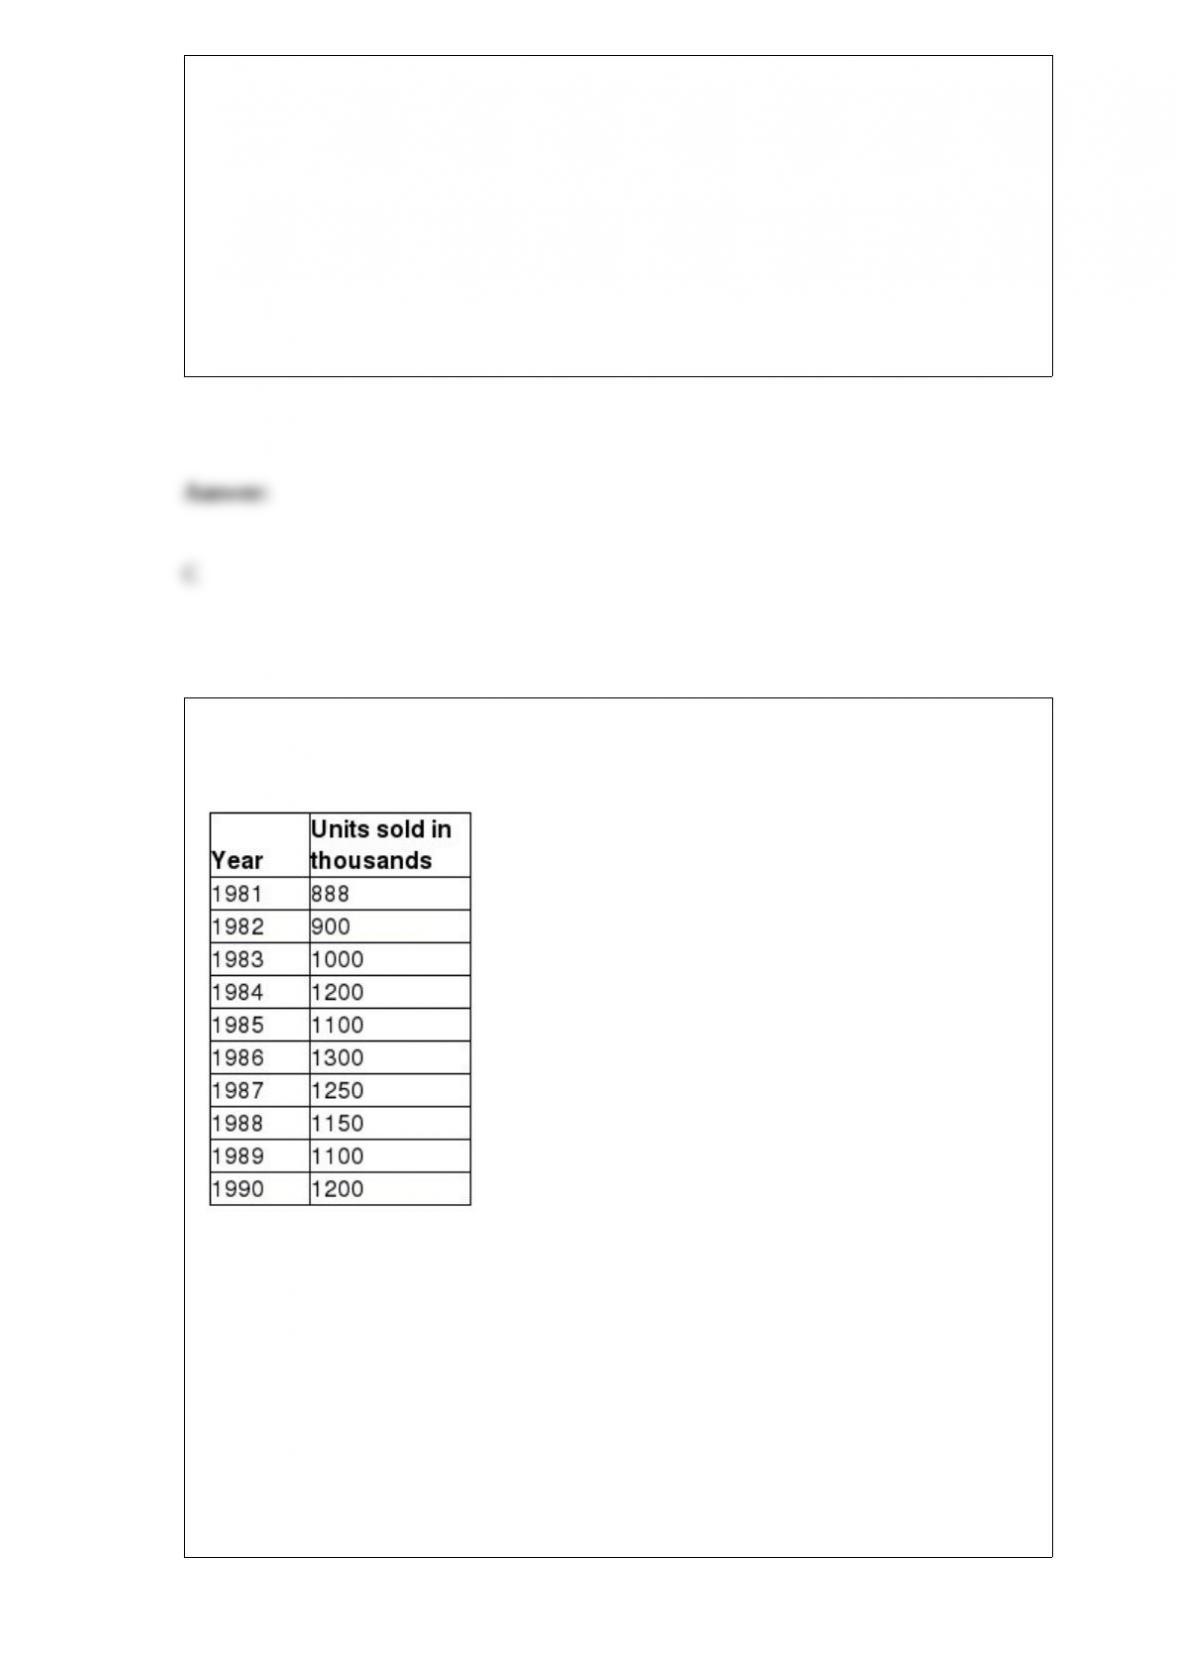
The worldwide sales of cars from 1981-1990 are shown in the table below. Given: α =
0.2 and β = 0.15 (Hint: Use XLMiner)
Using the double exponential smoothing, calculate the value of the mean absolute
deviation for the given data.
A) 8.10
B) 1.80
C) 91.27
D) 11976.17

The manager at Soul Walk Inc., a shoe manufacturing company, wants to set a new
price (P) for a shoe model to maximize total profit. The demand (
D) as a function of price is represented as:
D = 1,500 – 2.5P
The total cost (C) as a function of demand is represented as:
C = 3,200 + 3.5D
Which of the following is a model for total profit as a function of price?
A) (1,508.75 price) – (2.5 price2) – 8,450
B) (3.5 price2) + 3,200 – (1925.50 price)
C) (1,250 price) + (5 price2) – 8,320
D) [4521 + (4.5 price)] price – 9684.25
For a two-sample hypothesis test for differences in population parameters (1) and (2),
which of the following is the correct form of an upper-tailed test?
A) H0: population parameter (1) – population parameter (2) ≥ 0 vs. H1: population
parameter (1) – population parameter (2) < 0
B) H0: population parameter (1) – population parameter (2) > 0 vs. H1: population
parameter (1) – population parameter (2) ≤ 0
C) H0: population parameter (1) – population parameter (2) < 0 vs. H1: population
parameter (1) – population parameter (2) > 0

D) H0: population parameter (1) – population parameter (2) ≤ 0 vs. H1: population
parameter (1) – population parameter (2) > 0
Philip wishes to understand the relative proportion of each data source to the total.
Which of the following charts must Philip use?
A) Pie chart
B) Bar chart
C) Scatter chart
D) Column chart
The R2 value:
A) is the variability of the observed Y-values from the predicted values.
B) indicates that as the independent variable increases, the intercept term does too.
C) gives the proportion of variation in the dependent variable that is explained by the
independent variable.
D) transforms the cumulative probability scale (vertical axis) so that the graph of the
cumulative normal distribution is a straight line.

Greg is indifferent between receiving $2,000, and taking a chance at $2,500 with
probability 0.7 and losing $1200 with probability 0.5. What is the expected value of this
gamble?
A) $ 1,150
B) $ 1,800
C) $ 1,460
D) $ 2,045
Fiberia Accessories, a clothing retailer, is planning to introduce a new line of sweaters
as part of the winter collection for $65 with an inventory of 1500. The main selling
season is 60 days between November and December. The store then sells the remaining
units in a clearance sale at 65 percent discount. Out of the 60 main retail days, Fiberia
sells the sweaters at full retail price for only 45 days, while giving a discount of 25
percent for the remaining 15 days. The demand functions a, and b are given as 79.5 and
1.1 respectively.
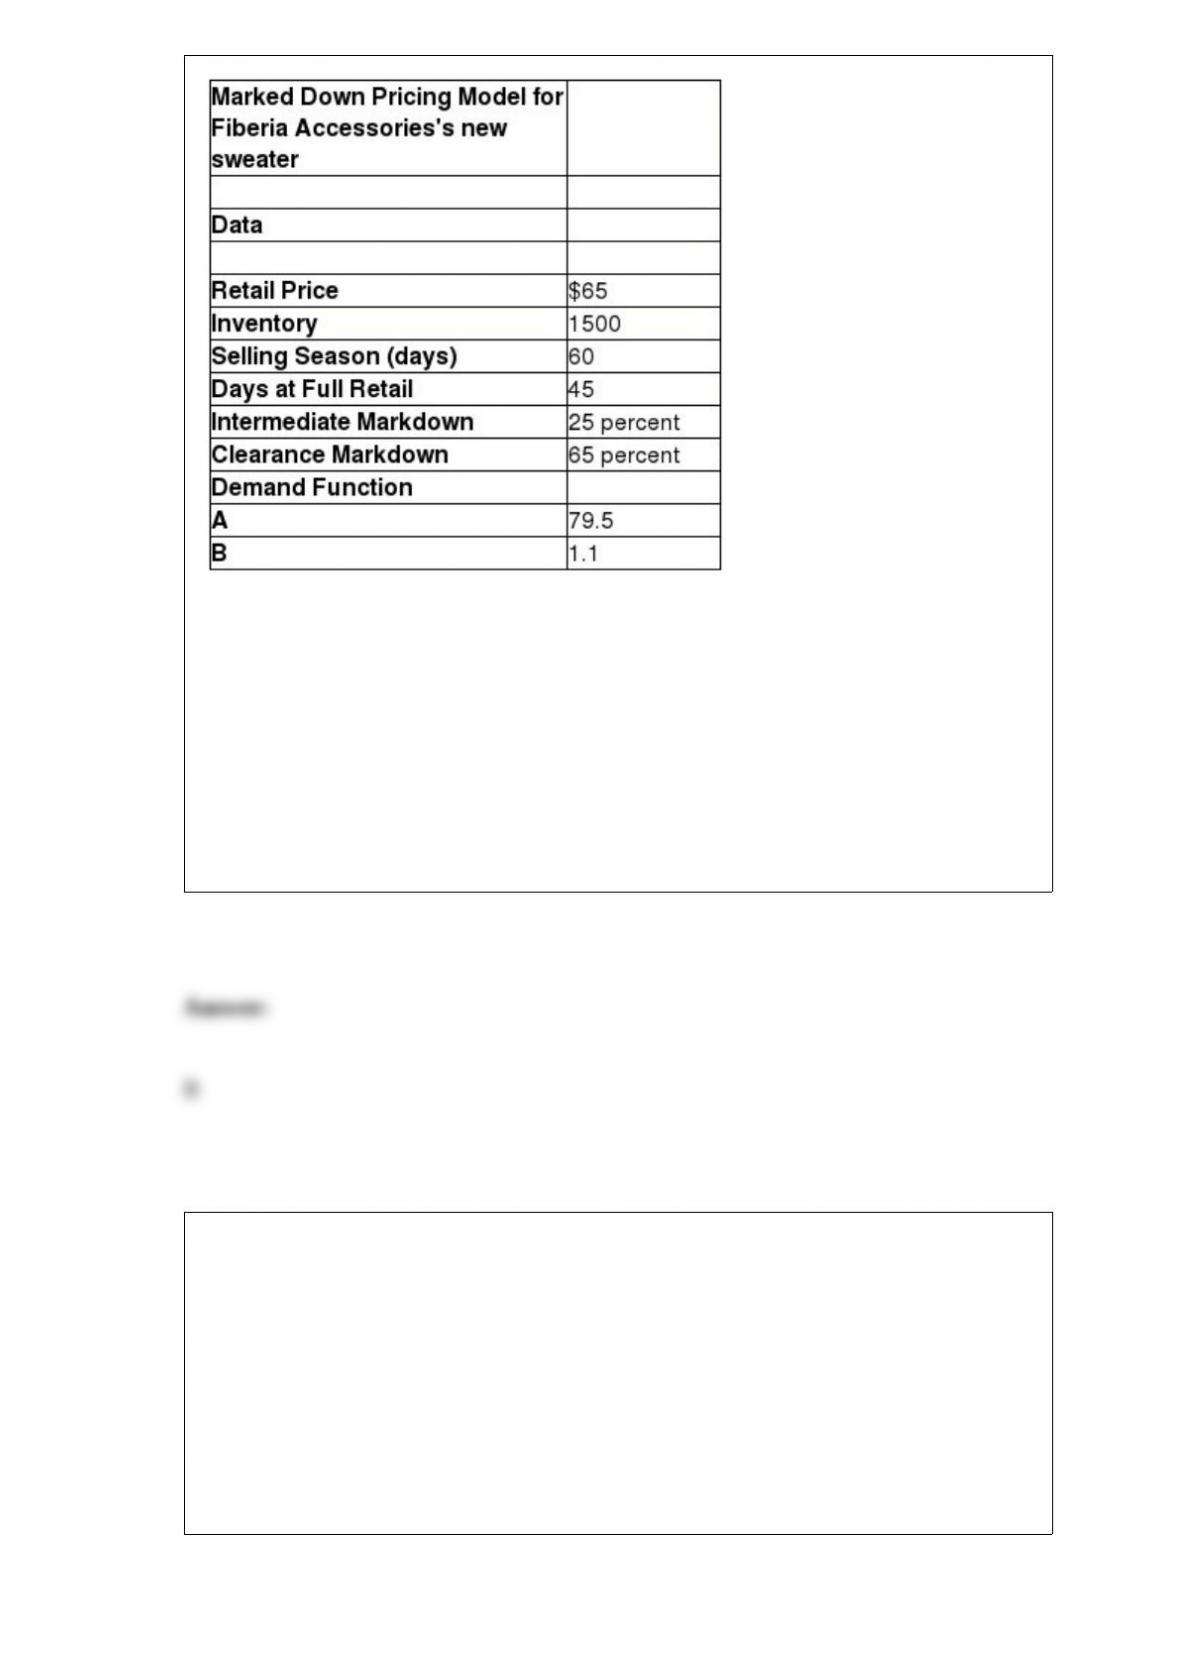
Calculate the total revenue during the discount sales period.
A) $4,478.91
B) $18,921.09
C) $10,042.73
D) $43,321.09
________ is the term used by Analytic Solver Platform for systematic methods of
“what-if” study.
A) Scenario
B) Validity
C) Parametric sensitivity analysis
D) Goal Seek
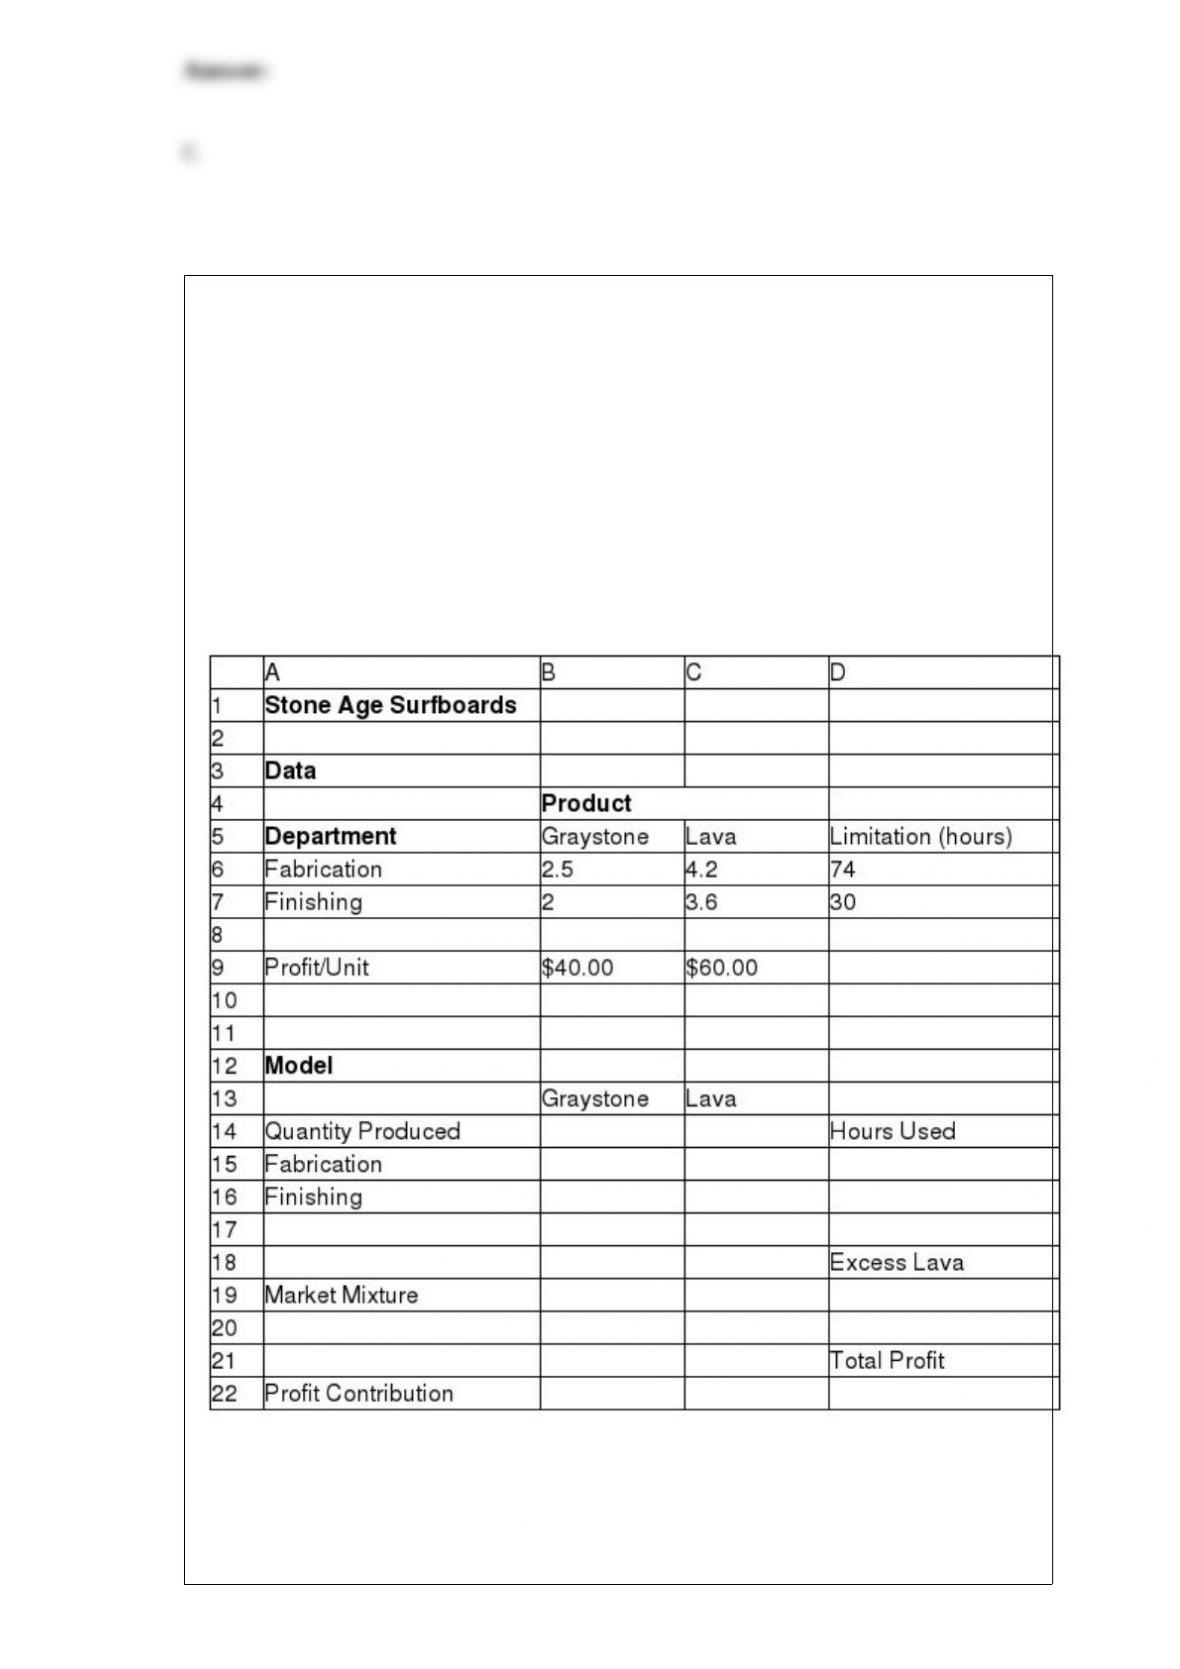
Stone Age Surfboards is a small manufacturer of two types of popular low-tide
surfboards, the Graystone and the Lava models. The manufacturing process consists of
two departments: fabrication and finishing. The fabrication department has 8 skilled
workers, each of whom works 9.25 hours per day. The finishing department has 5
workers, each of whom works a 6 -hour shift per day. Each pair of Graystone
surfboards requires 2.5 labor hours in the fabrication department and 2 labor hours in
finishing. The Lava model requires 4.2 labor-hours in fabrication and 3.6 labor-hours in
finishing. The company operates 6 days a week. It makes a per unit profit of $40 on the
Graystone model and $60 on the Lava model. The company anticipates selling at least
twice as many Lava models as Graystone models.
What is the total profit generated?
A) $ 675.68
B) $ 920.57
C) $ 521.74
D) $ 788.32
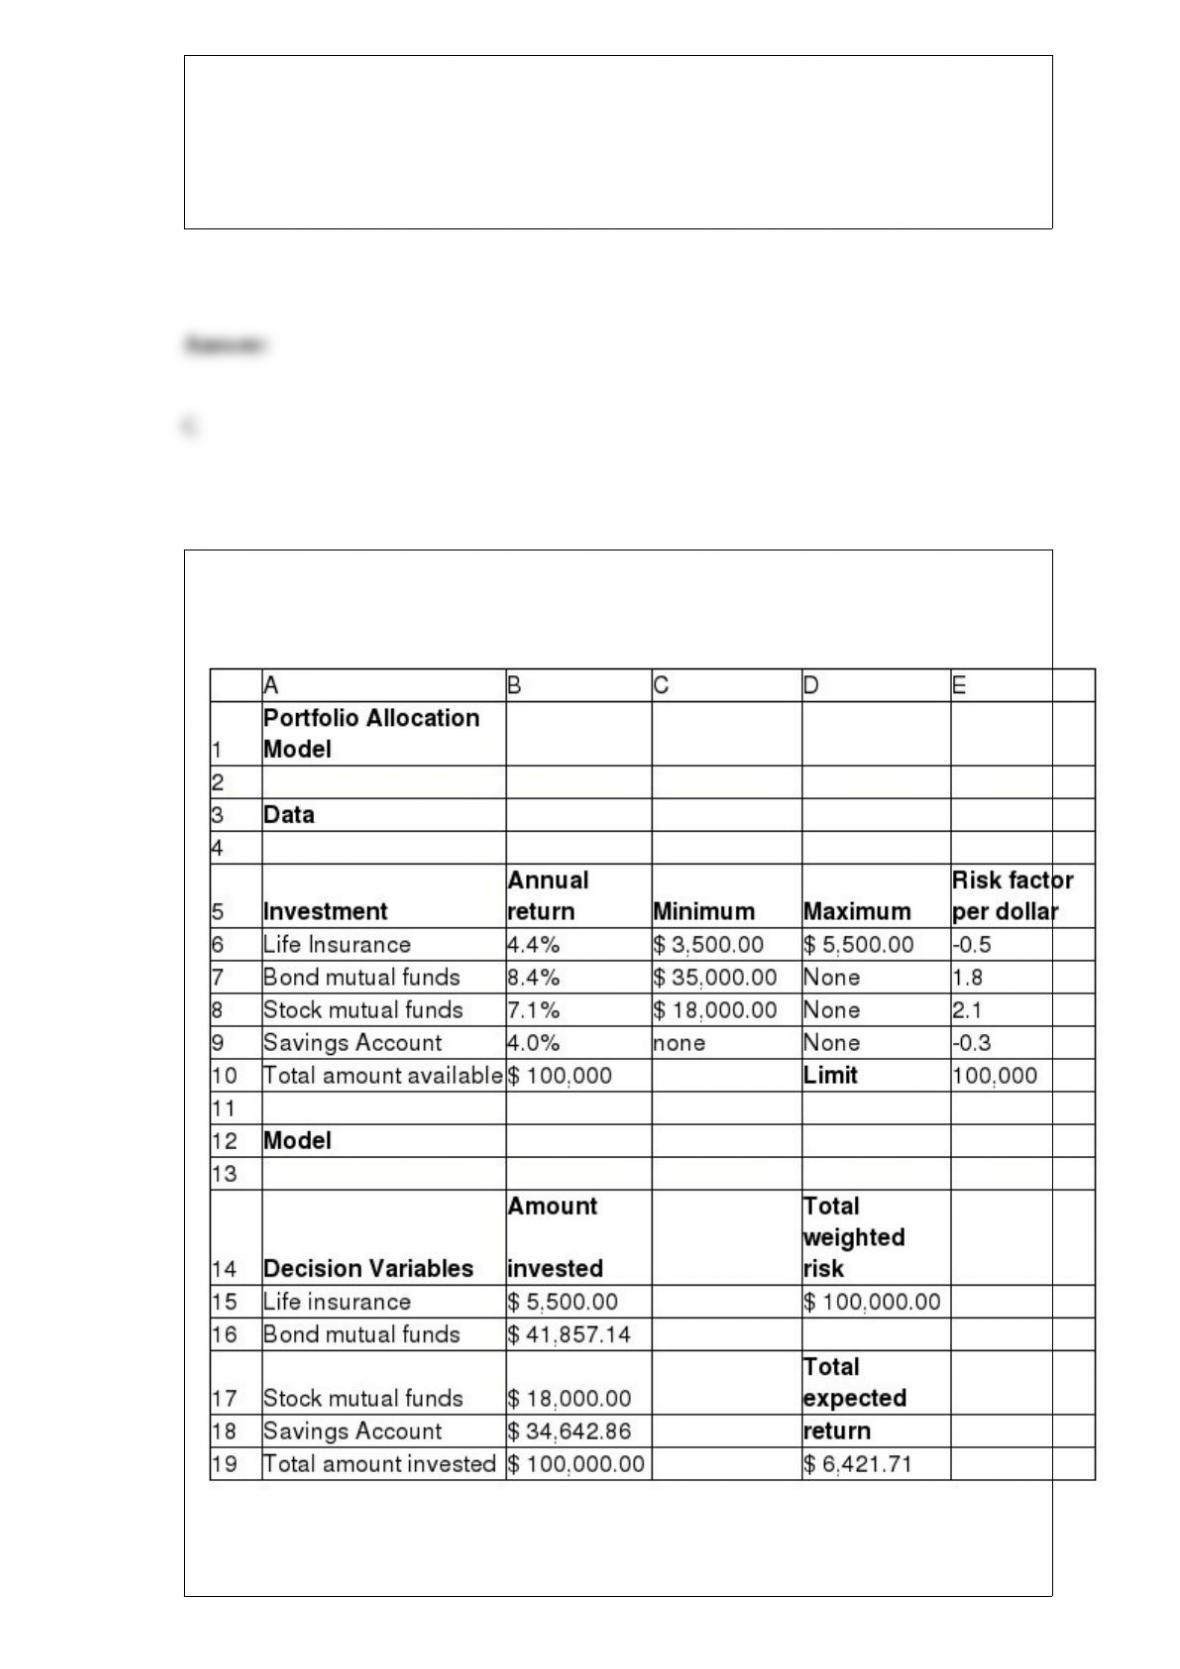
Below is the spreadsheet for a portfolio allocation model.
Answer the following question(s) using a model with uncertainty on type of investment
return. Assume that the distributions of life insurance annual return is uniform with

minimum 4% and maximum 6%, bond mutual funds annual return is normal with mean
7% and standard deviation 1%, stock mutual funds annual return is lognormal with
mean 11% and standard deviation 4%. Use 10,000 trials and 1 for random seed for the
simulation.
What is the value of standard deviation obtained from the simulation results for
maximizing the total expected return? [Hint: Choose the approximate value.]
A) $ 1,346.78
B) $ 1,890.25
C) $843.52
D) $ 1,578.64
Give the logical function for the following: If cell B7 equals 12, check contents of cell
B10. If cell B10 is 10, then the value of the function in the string is YES; if not, it is a
blank space. If cell B7 does not equal 12, then the value of the function is 7.
A) =IF(B7=12,(AND(B10=10, “”)(YES)),7)
B) =IF(B10=10,(OR(B7=12,””)”YES”)7)
C) =IF(B7=12,(IF(B10=10,”YES”, “”)),7)
D) =IF(B7=12,(AND(B10=10,”YES”,””)(B10=”NO”),7)
Which of the following is true for a mode?

A) Modes are the mid values of data arranged from least to greatest.
B) Modes are affected by outliers.
C) Modes cannot be used in data having repetitious values.
D) The highest bar in a histogram is its mode.
Identify the correct statement from the following.
A) The events that a respondent is female and chooses Math are not independent.
B) All events are independent of each other.
C) The events that a respondent is male and chooses Science are not dependent.
D) The events that a respondent is female and that she chooses Science are independent.
Use the table below to answer the following question(s) using the standard Solver.
Below is the spreadsheet for a plant location model:
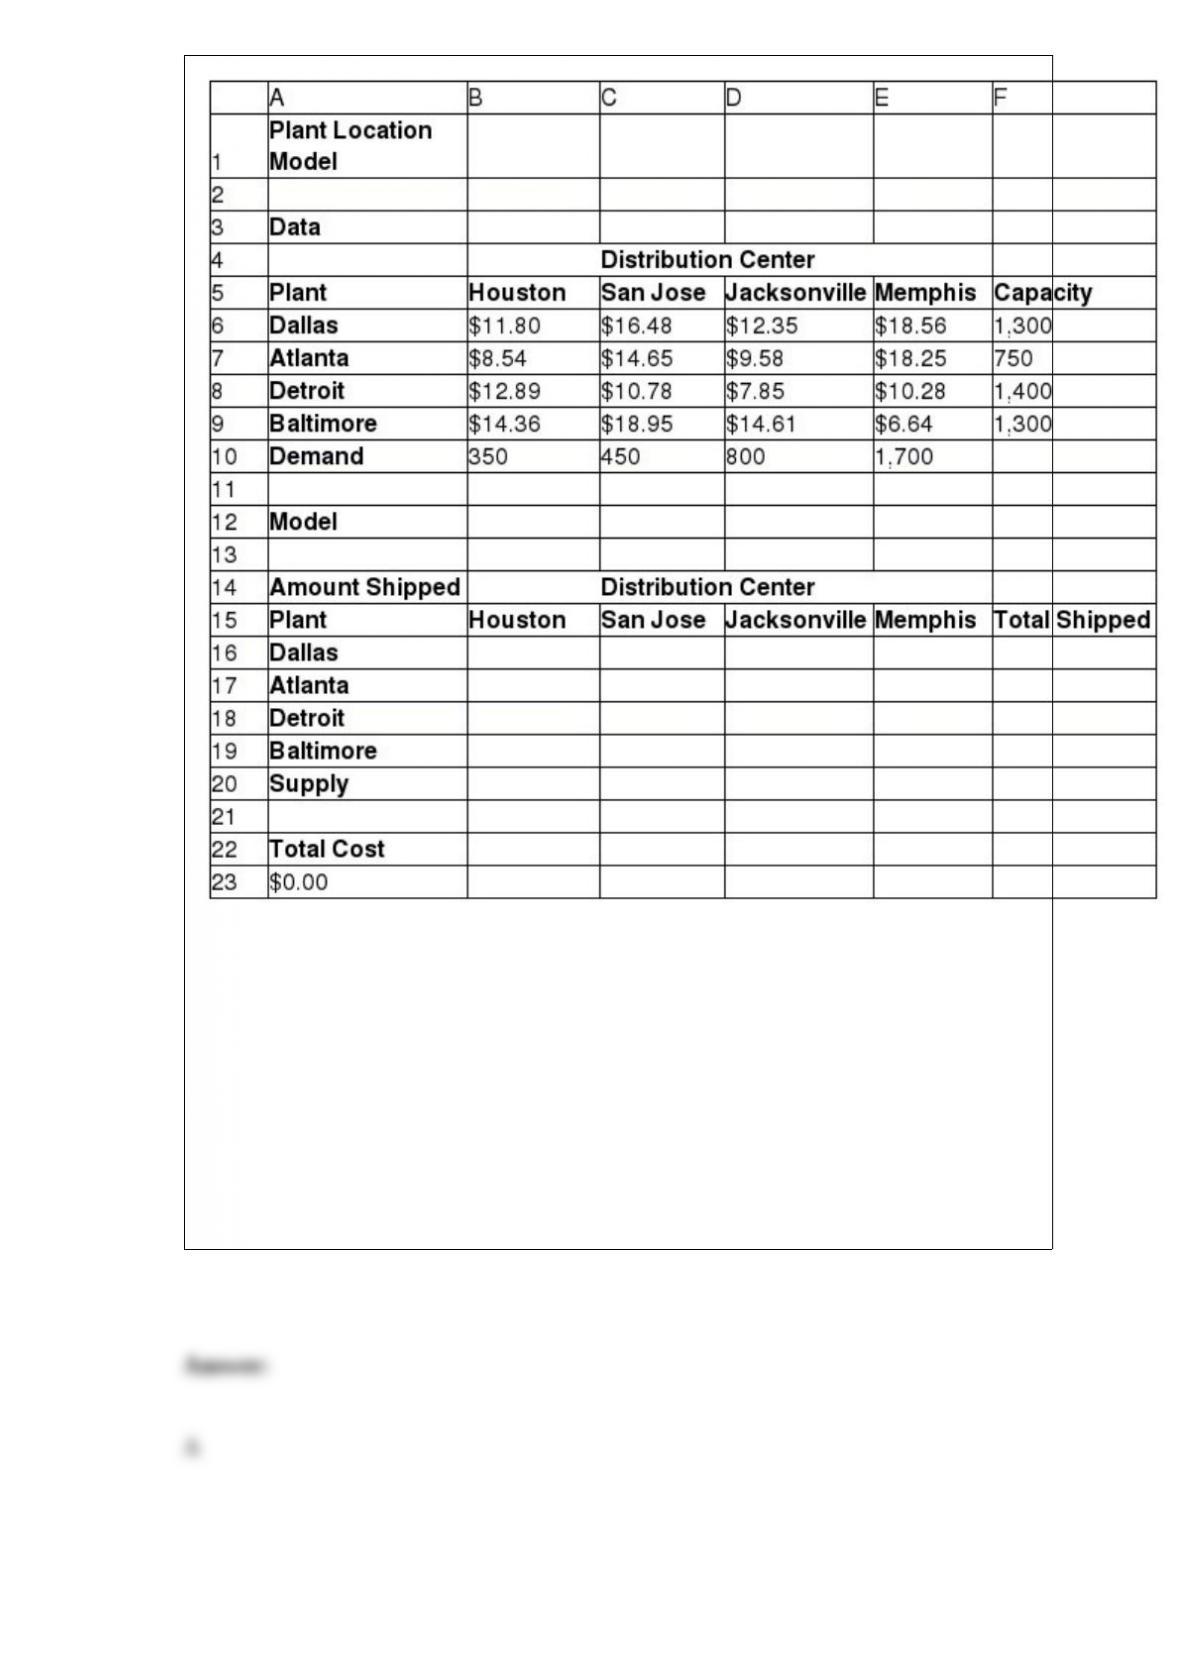
In which of the following plants is the total amount shipped to the distribution centers
equal to zero?
A) Dallas
B) Atlanta
C) Detroit
D) Baltimore
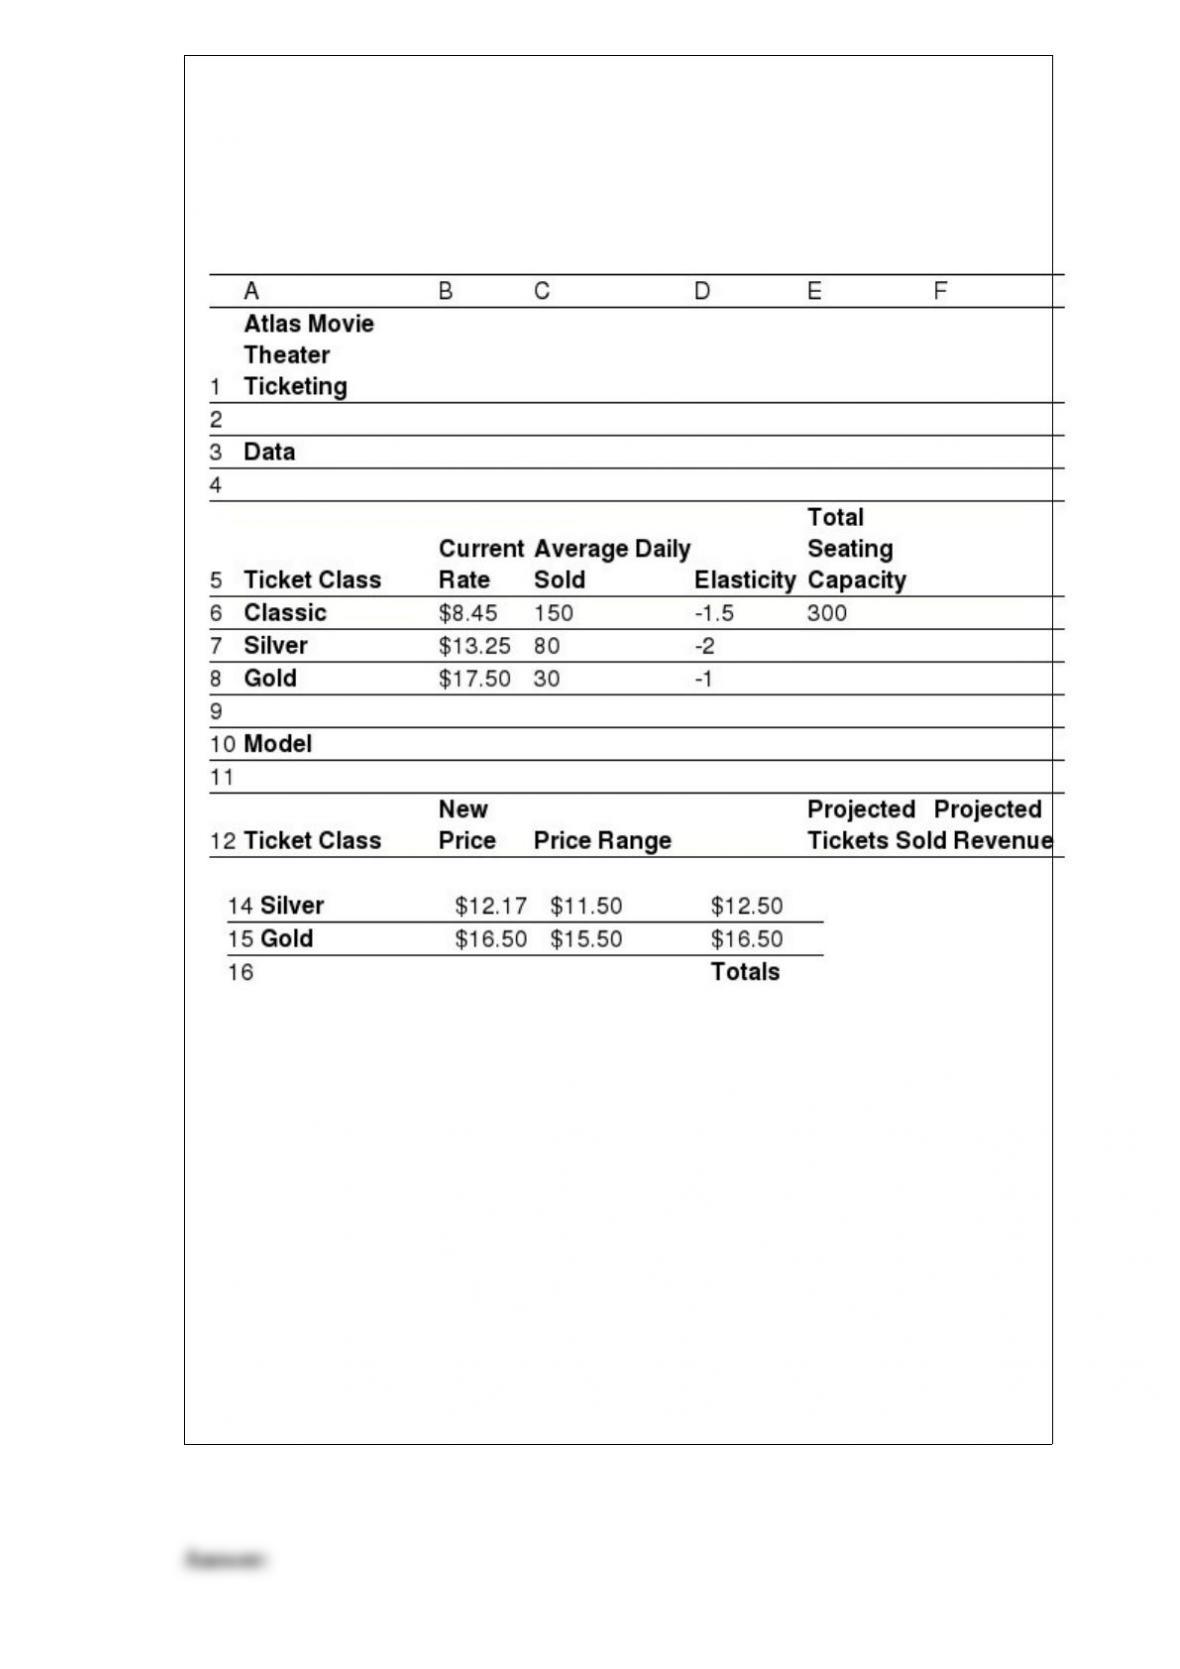
The Atlas Movies Theater has repriced their ticket rates to maximize revenues. They
have three classes of tickets: Classic, Silver, and Gold. The table below provides
information on the average ticket sales, revenue and price elasticity on demand. They
have a total seating capacity of 300. The table also provides the new price for the three
classes obtained using Solver.
Assume the distributions of elasticities for three classes of tickets are uniform with
minimum and maximum values equal to 75% and 125% of their estimated values,
respectively. Under this assumption, use Monte Carlo simulation to see what happens to
the prediction of tickets sold. The model is simulated for 10,000 trials.
Which of the following cells are defined to be uniformly distributed?
A) B6:B8
B) C6:C8
C) D6:D8
D) B13:B15
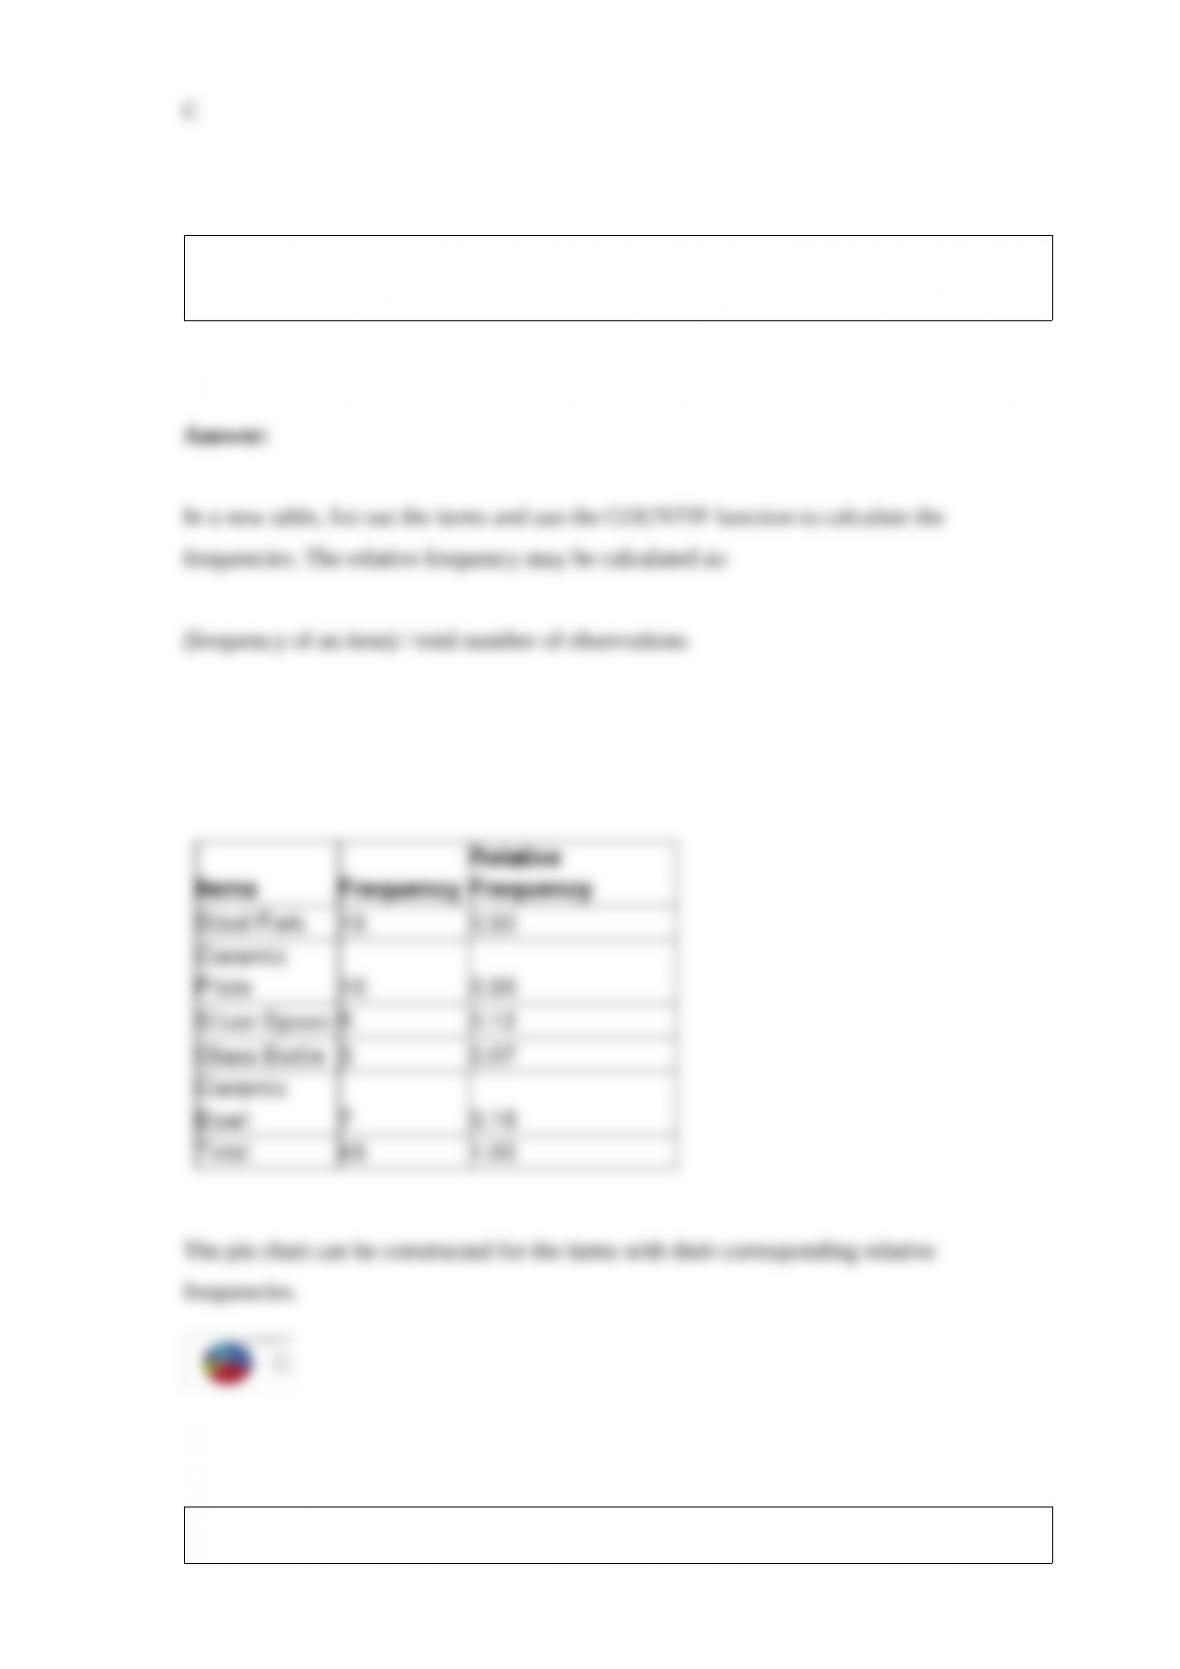
Construct a relative frequency distribution for items in the purchase order database and
show the proportions of the frequencies visually using a pie chart.
Explain selecting a sample using the continuous process sampling methods.

What is a conditional value at risk constraint?
The table below shows the weights of female individuals in Catherine’s family.
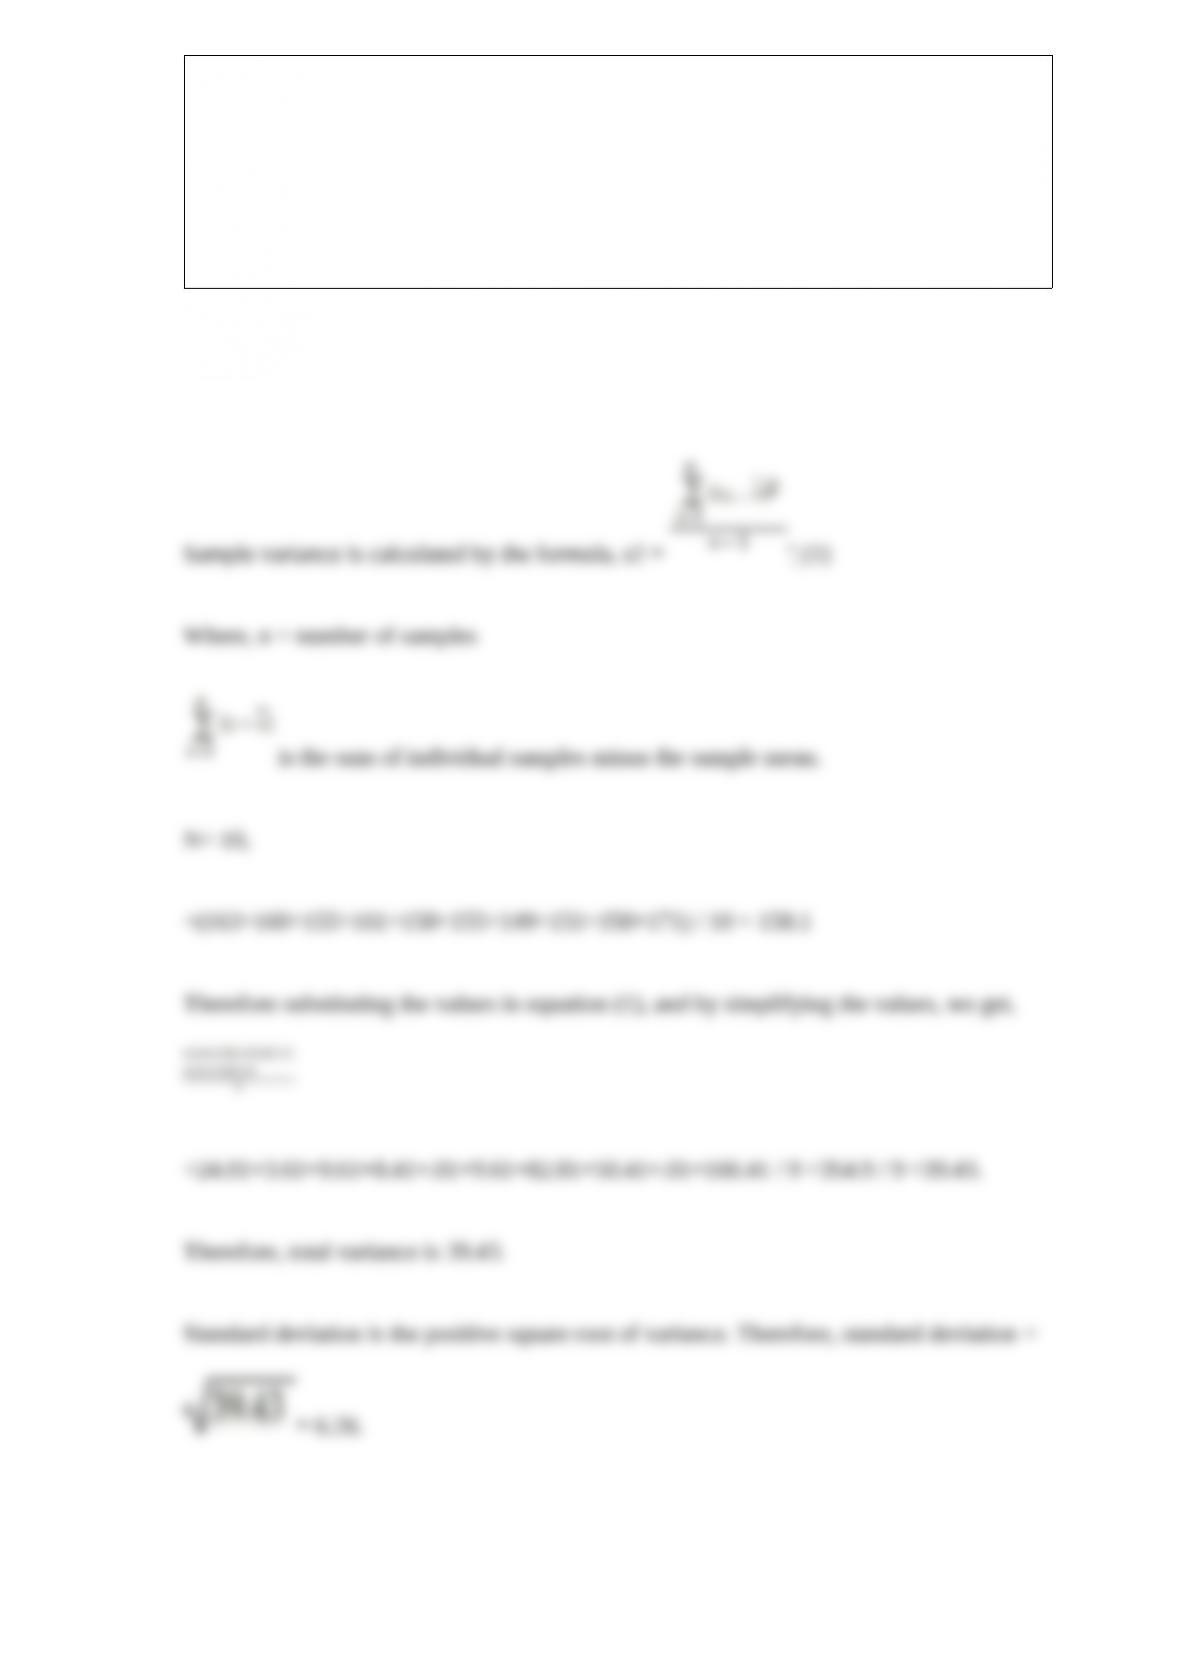
Calculate the sample variance in the weights, and the standard deviation.
Weights of female individuals in Catherine’s family (in lbs)
163
160
155
161
158
155
149
151
158
171
What are the Excel functions to avoid in linear optimization?
Why is testing for independence important for businesses?
What is degeneracy in linear optimization? Give an example.
What is a job-sequencing problem? How can we find an optimal solution for such
problems?
Explain how the Markowitz portfolio model is a quadratic optimization model.
Give an account of Excel’s Descriptive Statistics Tool.