The question, “Do you feel the government should be forced to stop picking our
pockets with excessive taxes and return a portion of the taxes collected to taxpayers?”
a. is leading.
b. contains an implicit alternative.
c. is double-barreled.
d. Both a and c.
e. None of the above.
Cramer’s V is scaled to range between
a. 0.0 and 1.0.
b. -1.0 and 0.0.
c. -1.0 and 1.0.
d. 0.0 to ∞.
e. Â∞8 to ∞.
Assume that a researcher determines that a -value of 0.01 or below determines
significance. Listed below are several correlation coefficients and their respective
significance levels. Which correlation coefficient demonstrates an association not likely
due to chance (i.e., significant)?
a. 0.22, 0.06
b. 0.75, 0.00
c. -0.32, 0.15
d. -0.76, 0.95
e. 0.26, 0.10
Long questionnaires can usually be handled best by_____________
a. telephone interview.
b. mail questionnaire.
c. personal interview.
d. a focus group interview.
e. a depth interview.
Ten volunteers are requested from your class to test a new bicycle. Of these ten, two are
selected at random for the actual tests. The sampling frame consists of
a. the students who were selected for the actual tests.
b. the students who volunteered.
c. all the students in the class.
d. the students who were not selected.
e. all the students in the school.
Exploratory studies typically :
a. Consume most of the research budget.
b. Are large scale and highly structured.
c. Are small scale and flexible
d. Both A and C
e. None of the above are correct.
The PGA conducts a study in which they use a simple random sample of 600 golfers.
They examine the data from the sample and calculate that 28% of them own golf clubs
made in the USA. The 28% is the
a. average handicap of these golfers.
b. sample statistic.
c. population mean for all golfers.
d. population parameter.
e. None of the above.
When comparing the independent samples t-test for means and the paired sample t-test
for means, one is for
a. univariate analysis while the other is for multivariate analysis.
b. small sample sizes while the other is for large sample sizes.
c. continuous variables while the other is for categorical variables.
d. measures from separate groups while the other is for measures from the same group.
e. All of the above.
Which of the following does NOT affect a respondent’s willingness to produce a
response?
a. Amount of work involved.
b. The person’s ability to articulate an answer.
c. The sensitivity of the issue.
d. The individual’s ability to remember the event.
e. All of the above affect a respondent’s willingness to provide a response.
Which of the following statements is TRUE?
a. A research project is a failure if you can’t communicate the results effectively.
b. The written report has a huge impact on whether the information generated by the
research is actually used.
c. Reports are all that most executives will see of the project.
d. A solid written report sends an important signal about the likely quality of the overall
project.
e. All of the above are true.
Which kind of research uses experiments to identify cause-and-effect relationships
between variables?
a. Descriptive
b. Exploratory
c. Primary
d. Secondary
e. Causal
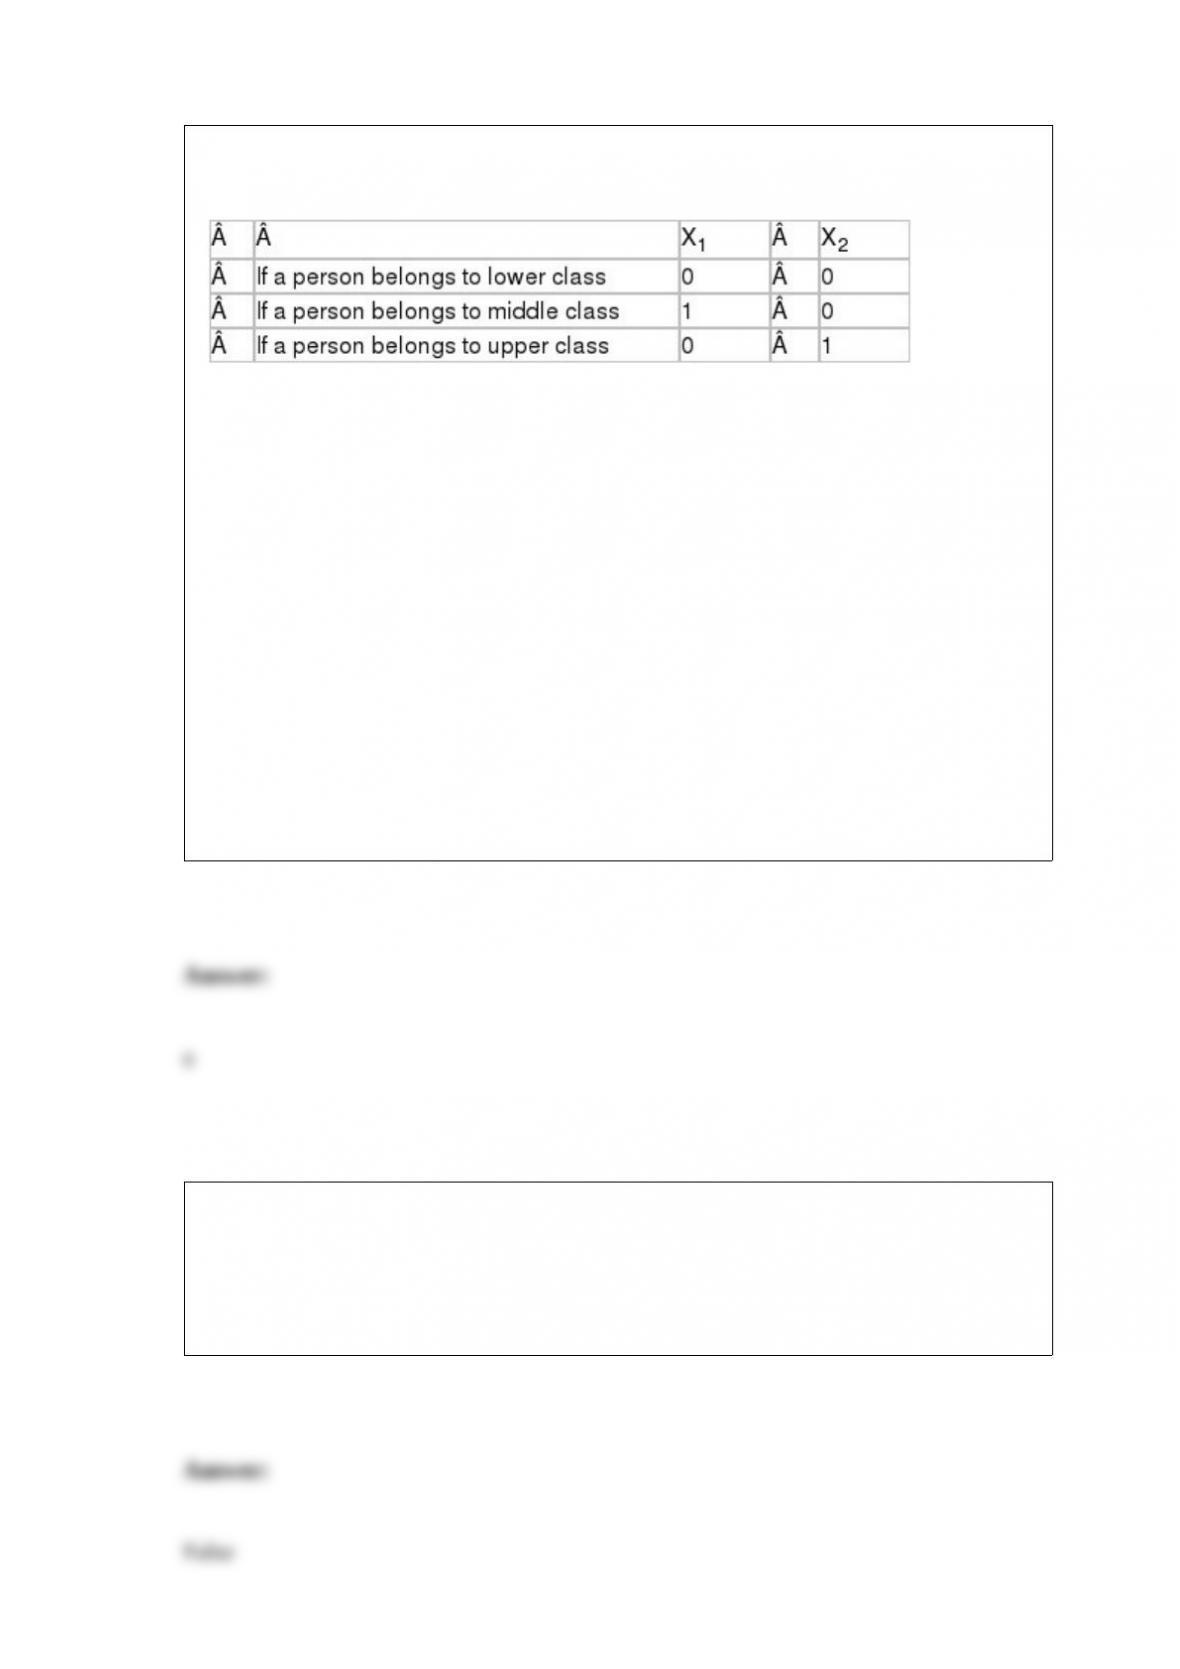
Consider the regression equation Y = 5 + 16X1+ 38X2relating annual expenditures on a
particular product Y to X1 and X2,where
Which of the following is FALSE? The equation suggests
a. An upper class person could be expected on the average to spend $38 per year more
than a lower class person on the product.
b. A middle class person could be expected on the average to spend $16 more per year
on the product than a lower class person.
c. A lower class person could be expected on the average to spend $5 per year on the
product.
d. An upper class person could be expected on the average to spend $22 more per year
on the product than a middle class person.
e. An upper class person could be expected on the average to spend $38 per year on the
product.
You can “prove” that the alternative hypothesis is true if the null hypothesis is rejected.
a. True
b. False