The slope of a straight line is:
a. positive.
b. negative.
c. zero.
d. constant.
e. nonconstant.
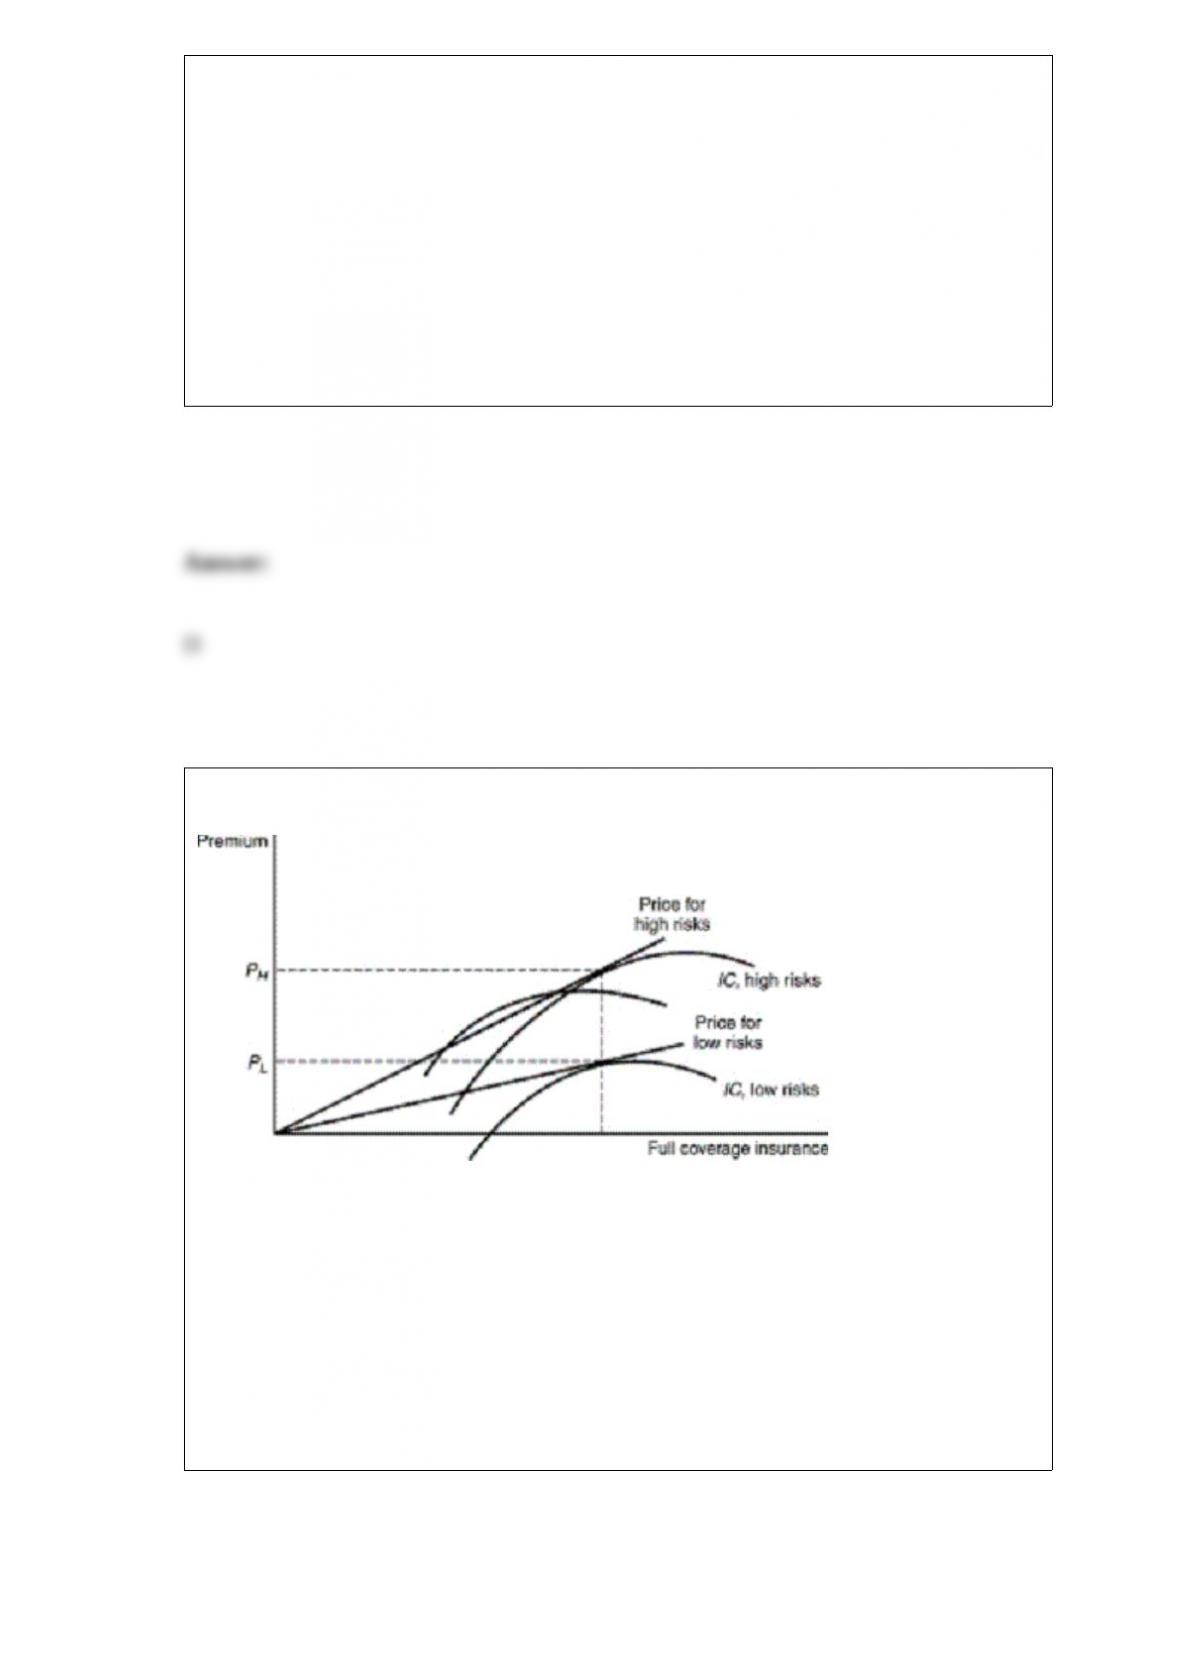
The best possible pricing scheme in this figure would:
a. encourage high-risk individuals to obtain full coverage.
b. encourage all individuals to obtain full coverage.
c. establish a single premium for all individuals.
d. encourage only low-risk individuals to buy any insurance.
e. result in no coverage purchased by low- or high-risk individuals.

Betty has bid $2,000 on a painting that she is buying for investment purposes. If she has
a 40% chance of winning the auction and the price paid by the auction winner is
$1,500, the expected profit of the auction is:
a. $0.
b. $200.
c. $500.
d. $800.
e. $2,000.
A competitive market with demand Q = 120 ” 4P and supply Q = “30 + 2P is in
equilibrium. If government imposes a price floor of 26, what quantity will be traded on
the market?
a. 28
b. 16
c. 20
d. 22
e. None of the above.
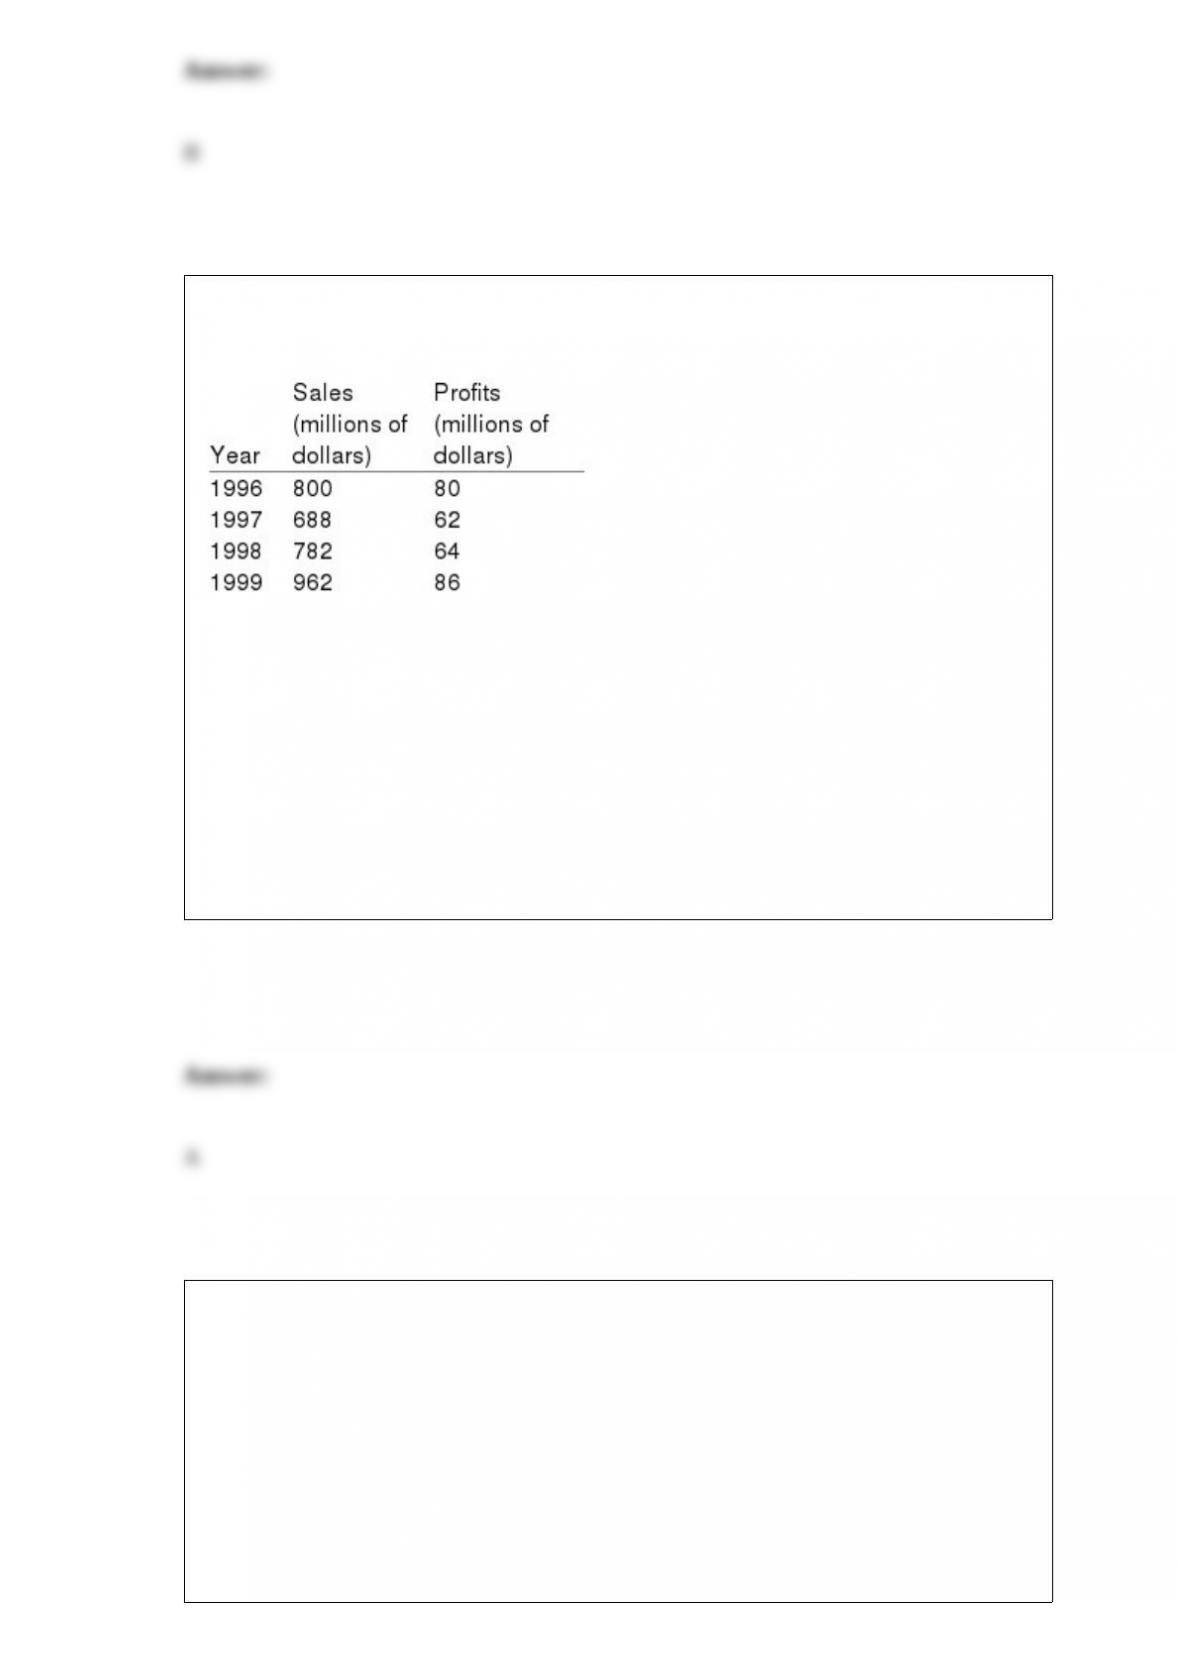
Annual sales and profits in the coal industry are given in the following table. What is
the slope coefficient estimate b of the regression of profits as a function of sales?
a. 0.09
b. 0.9
c. 1.2
d. 0.12
e. 0.06
Hedge Fun is a landscaping firm that specializes in topiary. Last year, the firm had 30
employees and served 120 customers. This year, it had 35 employees and served 135
customers. What is the marginal product of labor?
a. 2
b. 3
c. 4

d. 5
e. None of the above.
The difference between the observed value of a dependent variable and the value we
estimate using regression analysis is known as a(n):
a. aberration.
b. correlation.
c. dependent variable.
d. mistake.
e. residual.
The formula for the arc price elasticity can be written (where DQ denotes the change in
Q) as:
a. h = [DQ /(Q1 + Q2)]/[DP/(P1 + P2)].
b. h = [DQ /(Q1 + Q2)]/[DP/(Q1 + Q2)].
c. h = [DQ /(P1 + P2)]/[DP/(Q1 + Q2)].

d. h = [DP /(P1 + P2)]/[DQ/(Q1 + Q2)].
e. none of the above.
The market concentration ratio:
a. shows the percentage of total sales or production accounted for by the four largest
firms in an industry.
b. is a widely used, reliable measure of an industry’s market structure.
c. was developed by a Swedish and a German statistician in the late 1890s.
d. shows the percentage of total sales or production accounted for by the 10 largest
firms in the United States.
e. is so flawed a measure of an industry’s market structure that it is almost never used.
If marginal revenue is less than marginal cost at every level of output, a
profit-maximizing firm should:
a. produce when the difference between marginal revenue and marginal cost is greatest.
b. produce when total revenue is maximized.
c. produce when the difference between total revenue and marginal cost is maximized.
d. produce when the difference between average revenue and average cost is equal to 1.
e. not produce any output.
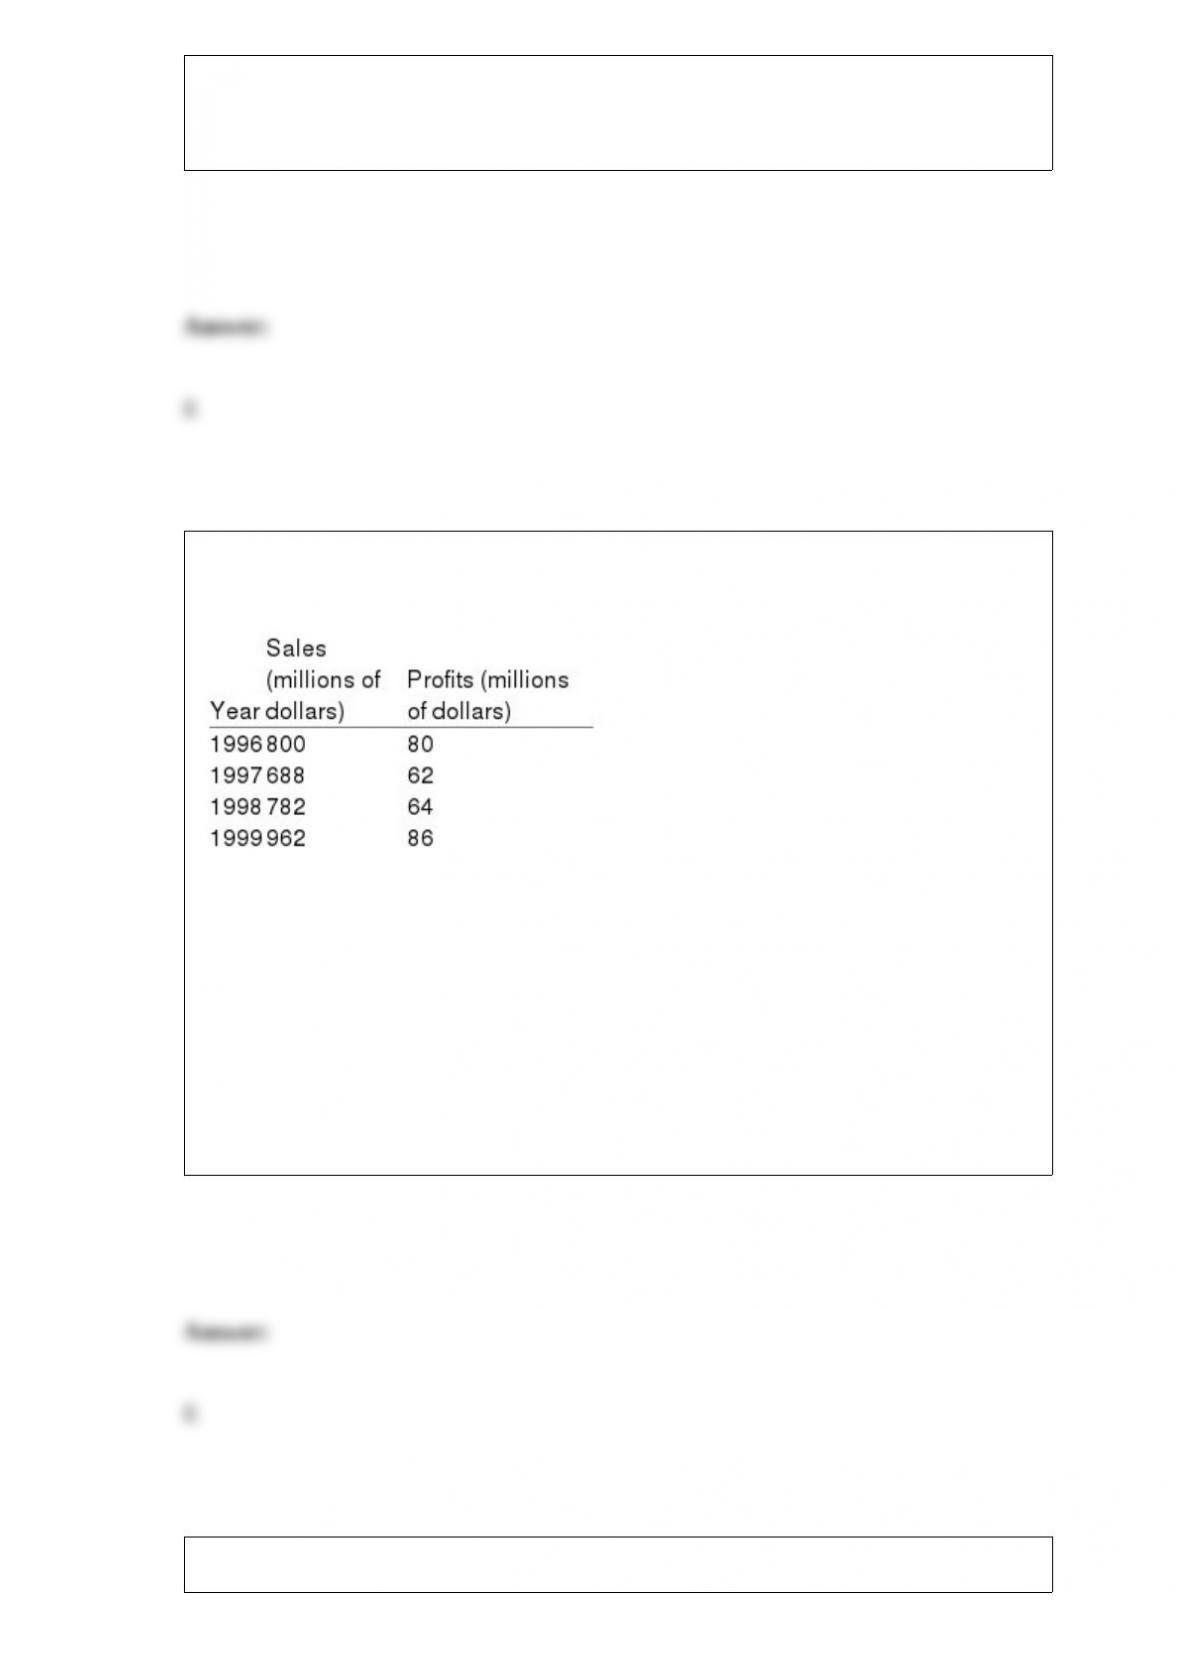
Coal industry sales and profits are given in the following table. What is the intercept
coefficient estimate a of the regression of profits as a function of sales?
a. 0.12.
b. 0.14.
c. 0.16.
d. 0.18.
e. 0.22.
Which of the following does not affect the shape of a consumer’s indifference curves?

a. Age.
b. Education.
c. Tastes.
d. Prices.
e. Advertising.
As we move down a linear demand curve, demand becomes:
a. more elastic.
b. less elastic at first and then more elastic.
c. steeper.
d. more elastic at first and then less elastic.
e. less elastic.
If the Durbin-Watson statistic is near 0, we can conclude that there is:
a. positive serial correlation.

b. negative serial correlation.
c. no serial correlation.
d. a multicollinearity problem.
e. not enough data to estimate the regression.
The income elasticity of demand is defined as the:
a. percentage change in the quantity demanded divided by the percentage change in the
price level.
b. change in the quantity demanded divided by the change in per capita income.
c. percentage change in income divided by the percentage change in the quantity
demanded.
d. change in per capita income divided by the change in the quantity demanded.
e. percentage change in the quantity demanded divided by the percentage change in per
capita income.
Output is produced according to Q = 4L + 6K, where L is the quantity of labor input and
K is the quantity of capital input. If the price of K is $12 and the price of L is $6, then
the cost-minimizing combination of K and L capable of producing 60 units of output is:

a. L = 5 and K = 6.66.
b. L = 7.5 and K = 5.
c. L = 6 and K = 6.
d. L = 0 and K = 10.
e. L = 15 and K = 0.
Managers may make decisions that are not consistent with the goals of stockholders.
This is referred to as the problem.
a. principal”agent
b. economic disincentive
c. incentive”compromise
d. efficiency”inefficiency
e. equilibrium
Campbell’s sells used trailers, U, and new trailers, N. Its profits are given by p = 100N +
68U ” 5N2 ” 5U2 ” 2NU. Campbell’s maximum profit is:
a. $455.
b. $588.
c. $620.
d. $495.
e. $640.
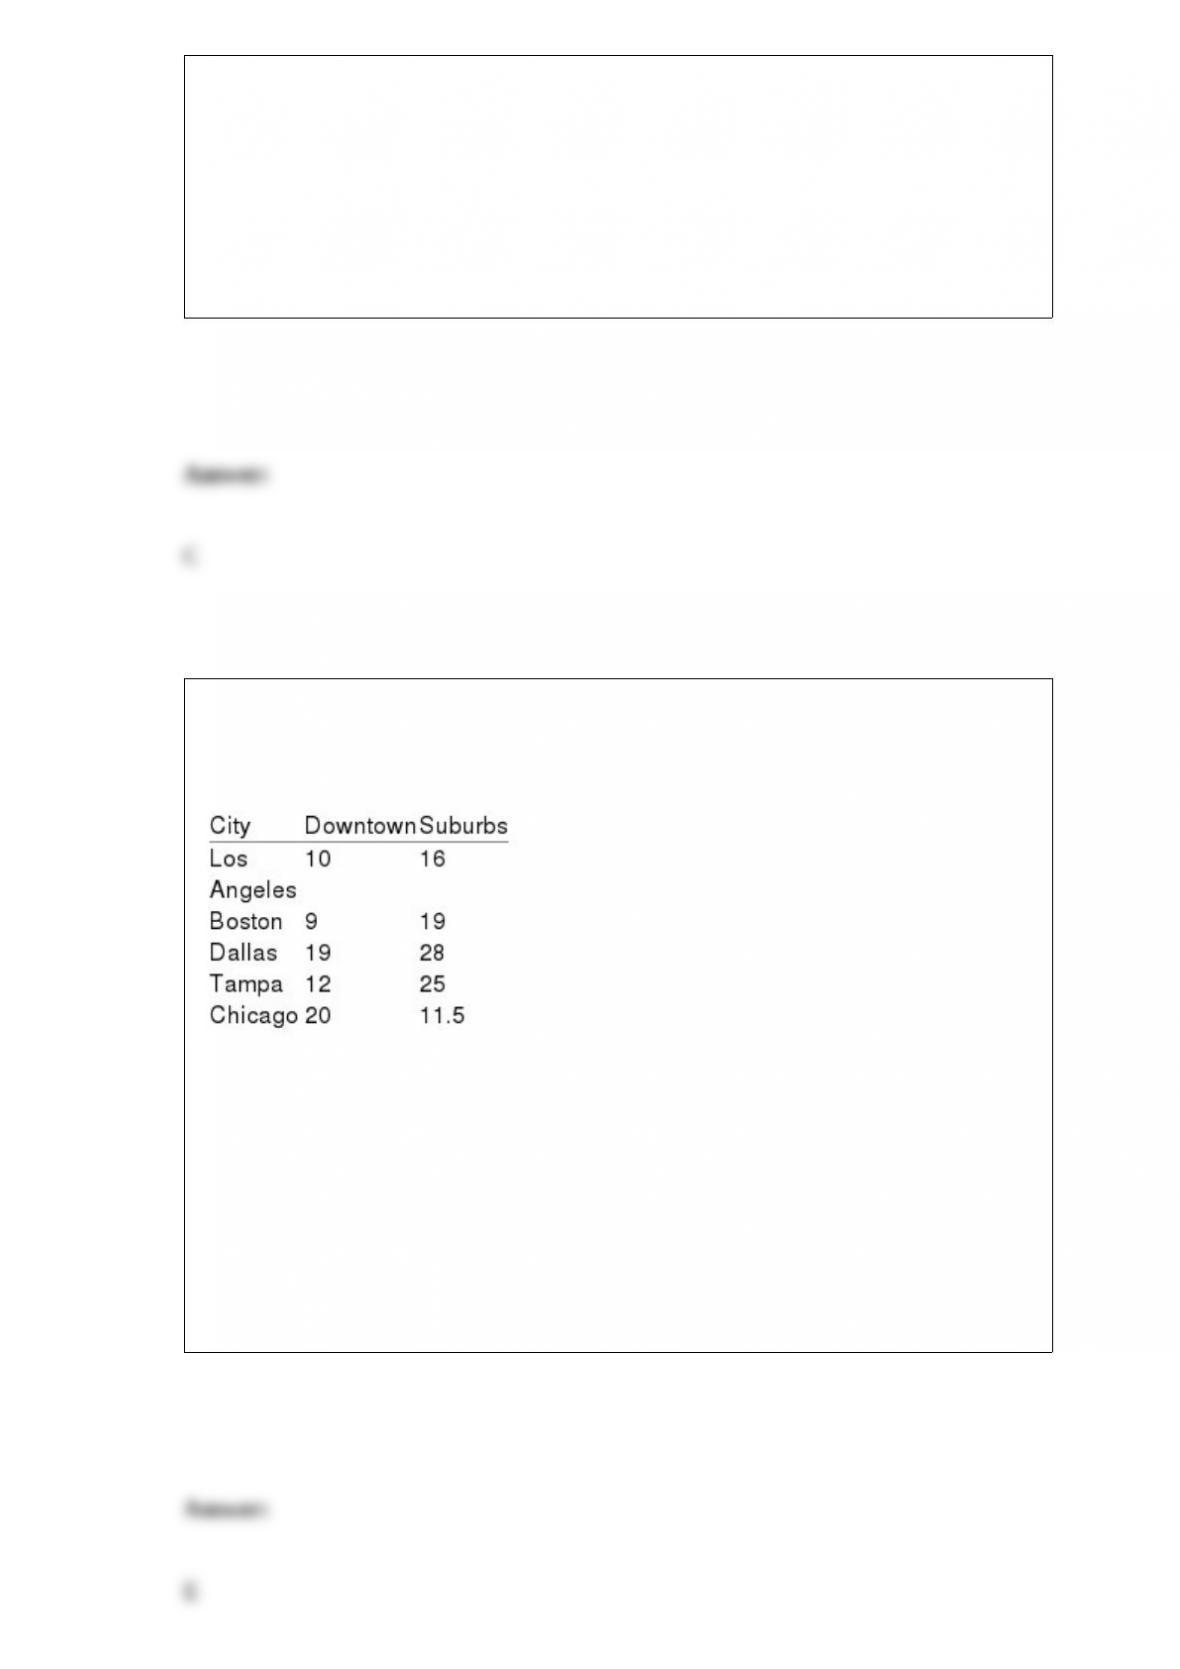
The vacancy rates for commercial office space in 2001 for selected cities are given in
the following table. What is the R-squared of the regression of the vacancy rate
downtown as a function of the vacancy rate in the suburbs?
a. 1.0.
b. 0.5.
c. 0.25.
d. 0.75.
e. 0.

A market demand curve is likely to shift to the right when:
a. average income falls.
b. prices fall.
c. prices rise.
d. population increases.
e. new firms enter the market.
If output is produced according to Q = K1/2 + 3L1/2, then this production process
exhibits:
a. increasing returns to scale.
b. decreasing returns to scale.
c. first increasing and then decreasing returns to scale.
d. constant returns to scale.
e. first decreasing and then increasing returns to scale.

Don consumes bagels and cream cheese. He likes to place 2 ounces of cream cheese on
each bagel, no more, no less. In this case, Don’s indifference curves for bagels and
cream cheese will be:
a. straight lines with slopes equal to “2.
b. L-shaped, or right angles.
c. upward-sloping.
d. horizontal lines.
e. vertical lines.
The optimal reservation price for a seller is:
a. the value of the object being auctioned off if it does not sell.
b. managerial estimates of the highest reservation price among buyers.
c. managerial estimates of the lowest reservation price among buyers.
d. the average of a and b.
e. equal to marginal cost.
When Exxoff Oil Corporation offers discounts based on credit card records of gas
quantities purchased, they are practicing:
a. first-degree price discrimination.
b. second-degree price discrimination.
c. third-degree price discrimination.
d. markup pricing.
e. tying.
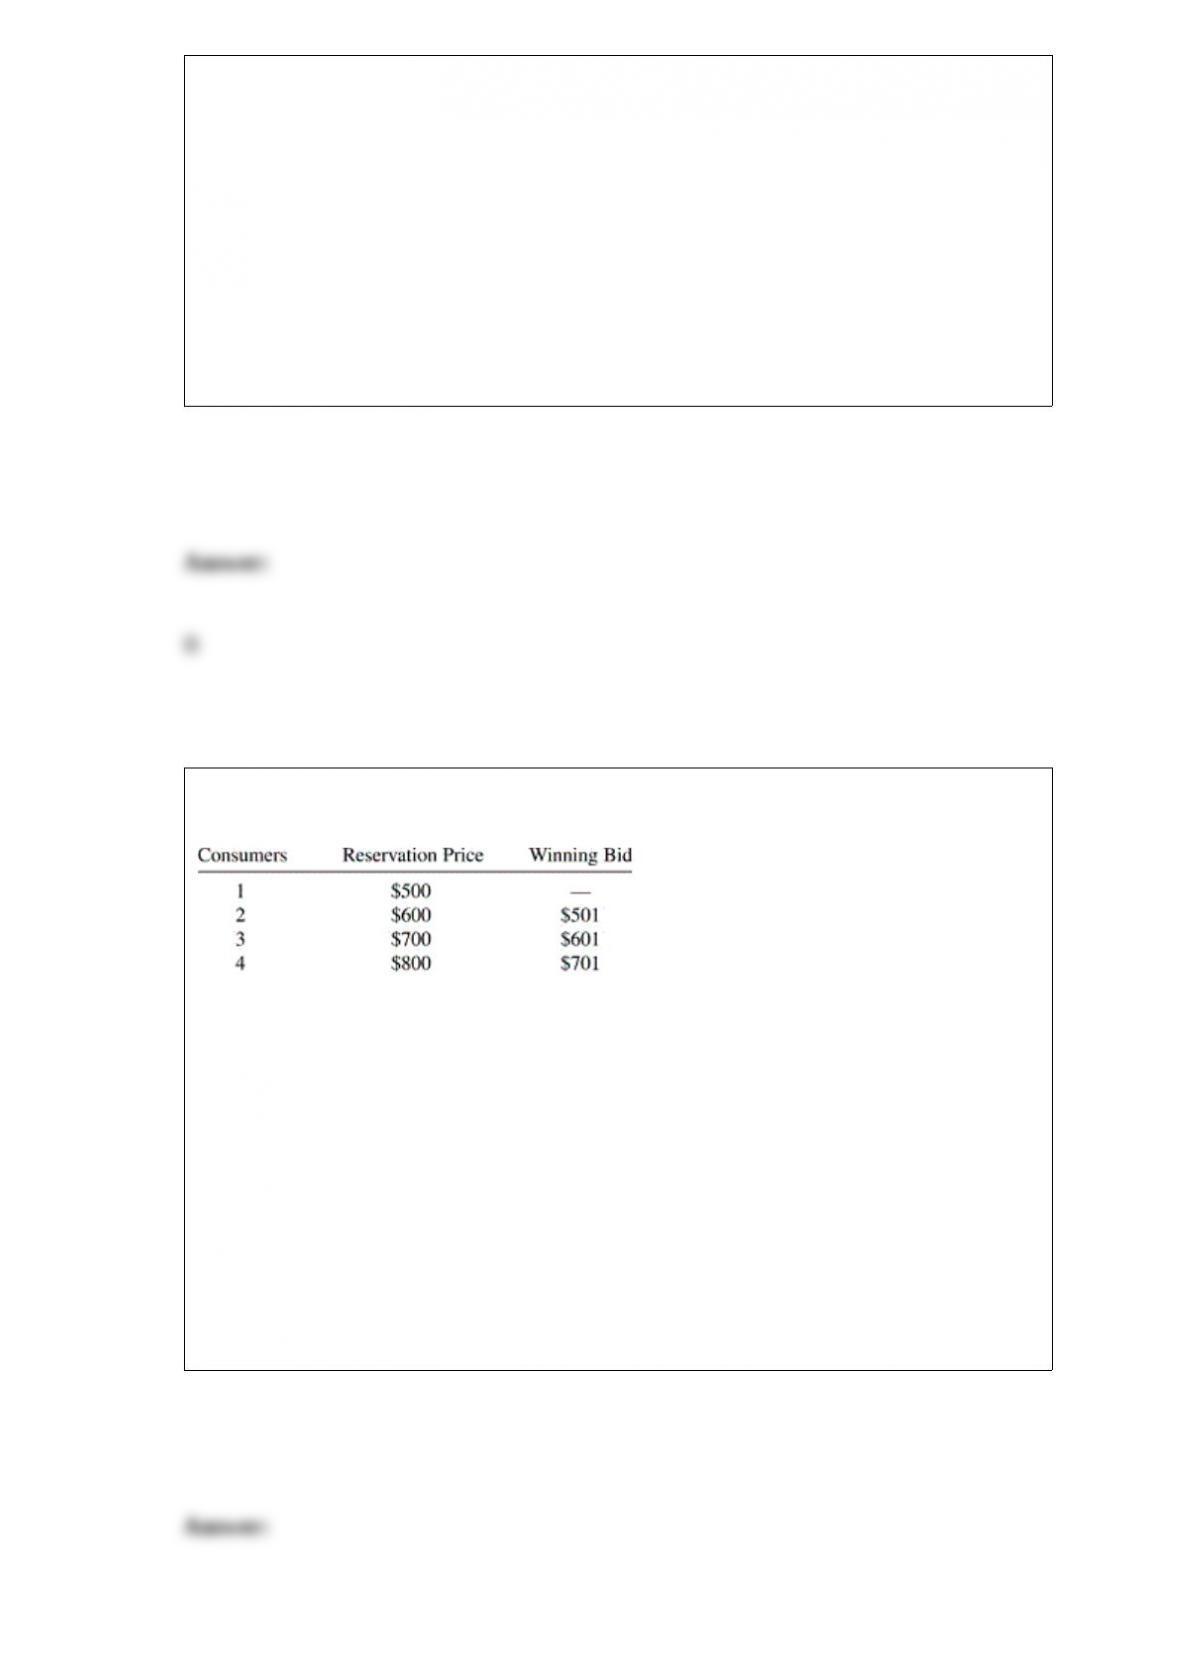
The following table describes the reservation prices and four bids for an auction of
three tickets to the recent Madonna concert.
If the marginal cost of providing a seat for one more Madonna fan is $0, the total
producer surplus that results from this auction is:
a. $0.
b. $297.
c. $1,803.
d. $2,100.
e. none of the above.

If revenues from selling quantities x and y of jointly produced goods X and Y were TRX
= 300 ” xy + 50x and TRY = 1,000 ” xy + 2y, and 10 units of y were produced, then
marginal revenue with respect to X would be:
a. $10.
b. $20.
c. $30.
d. $40.
e. $50.
Too Much Fun (TMF) sells board games for the discerning student. It estimates that its
total cost of sales is TC = Q + 27Q1/3. At 27 units of output, TMF’s marginal cost is:
a. $2.
b. $29.
c. $27.
d. $30.
e. $28.

The average product of labor is defined as the:
a. change in output divided by the change in labor input usage.
b. change in labor input usage divided by the change in output.
c. output divided by the labor input usage.
d. labor input usage divided by the output level.
e. output divided by the marginal product of labor.
The marginal rate of substitution:
a. remains constant as the consumer moves around an indifference curve.
b. is constant if the goods are perfect complements.
c. decreases as the consumer moves down a typical indifference curve.
d. cannot be defined if the goods are perfect substitutes.
e. none of the above

Shag Express, a retailer of lamps, has determined that its total cost of retailing lamps is
TC = 200 + 10Q + 5Q2. At 10 units of output, the firm’s marginal cost is:
a. $110.
b. $100.
c. $800.
d. $230.
e. $10.
Joe is risk-neutral with utility U = bR, where b is a positive constant and R is profit
from a venture. If a gamble has a 0.4 chance of R = 1 and a 0.6 chance of R = 2, Joe’s
expected utility E(U) is:
a. b.
b. 1.4b.
c. 1.5b.
d. 1.6b.
e. 2b.
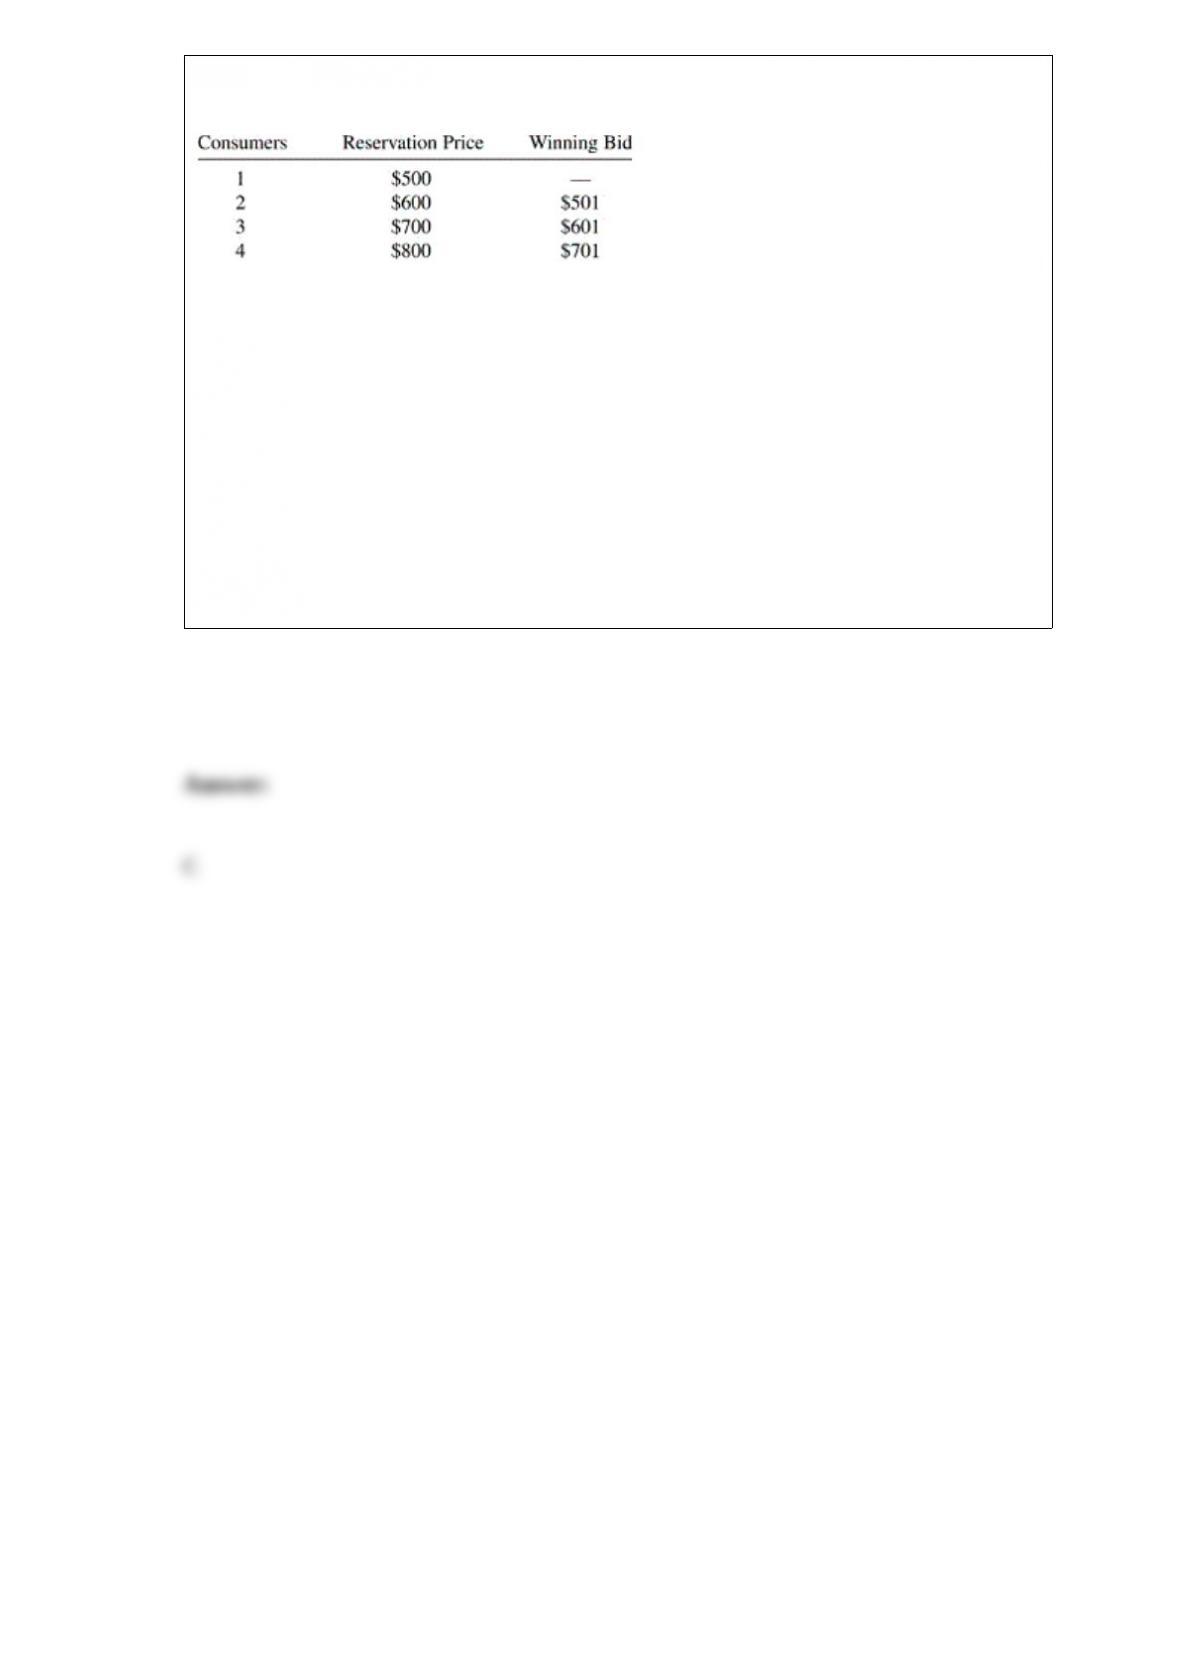
The following table describes the reservation prices and four bids for an auction of
three tickets to the recent Madonna concert.
The total consumer surplus that results from this auction is:
a. $0.
b. $99.
c. $297.
d. $100.
e. none of the above.