Evidence shows that for many people, delaying searching for a job for a year or longer
after they are laid off will contribute to a deterioration of their job skills, making it
harder for them to find employment. This deterioration in job skills and the subsequent
retraining that is necessary to obtain employment relates to which type of
unemployment?
A) cyclical
B) frictional
C) seasonal
D) structural
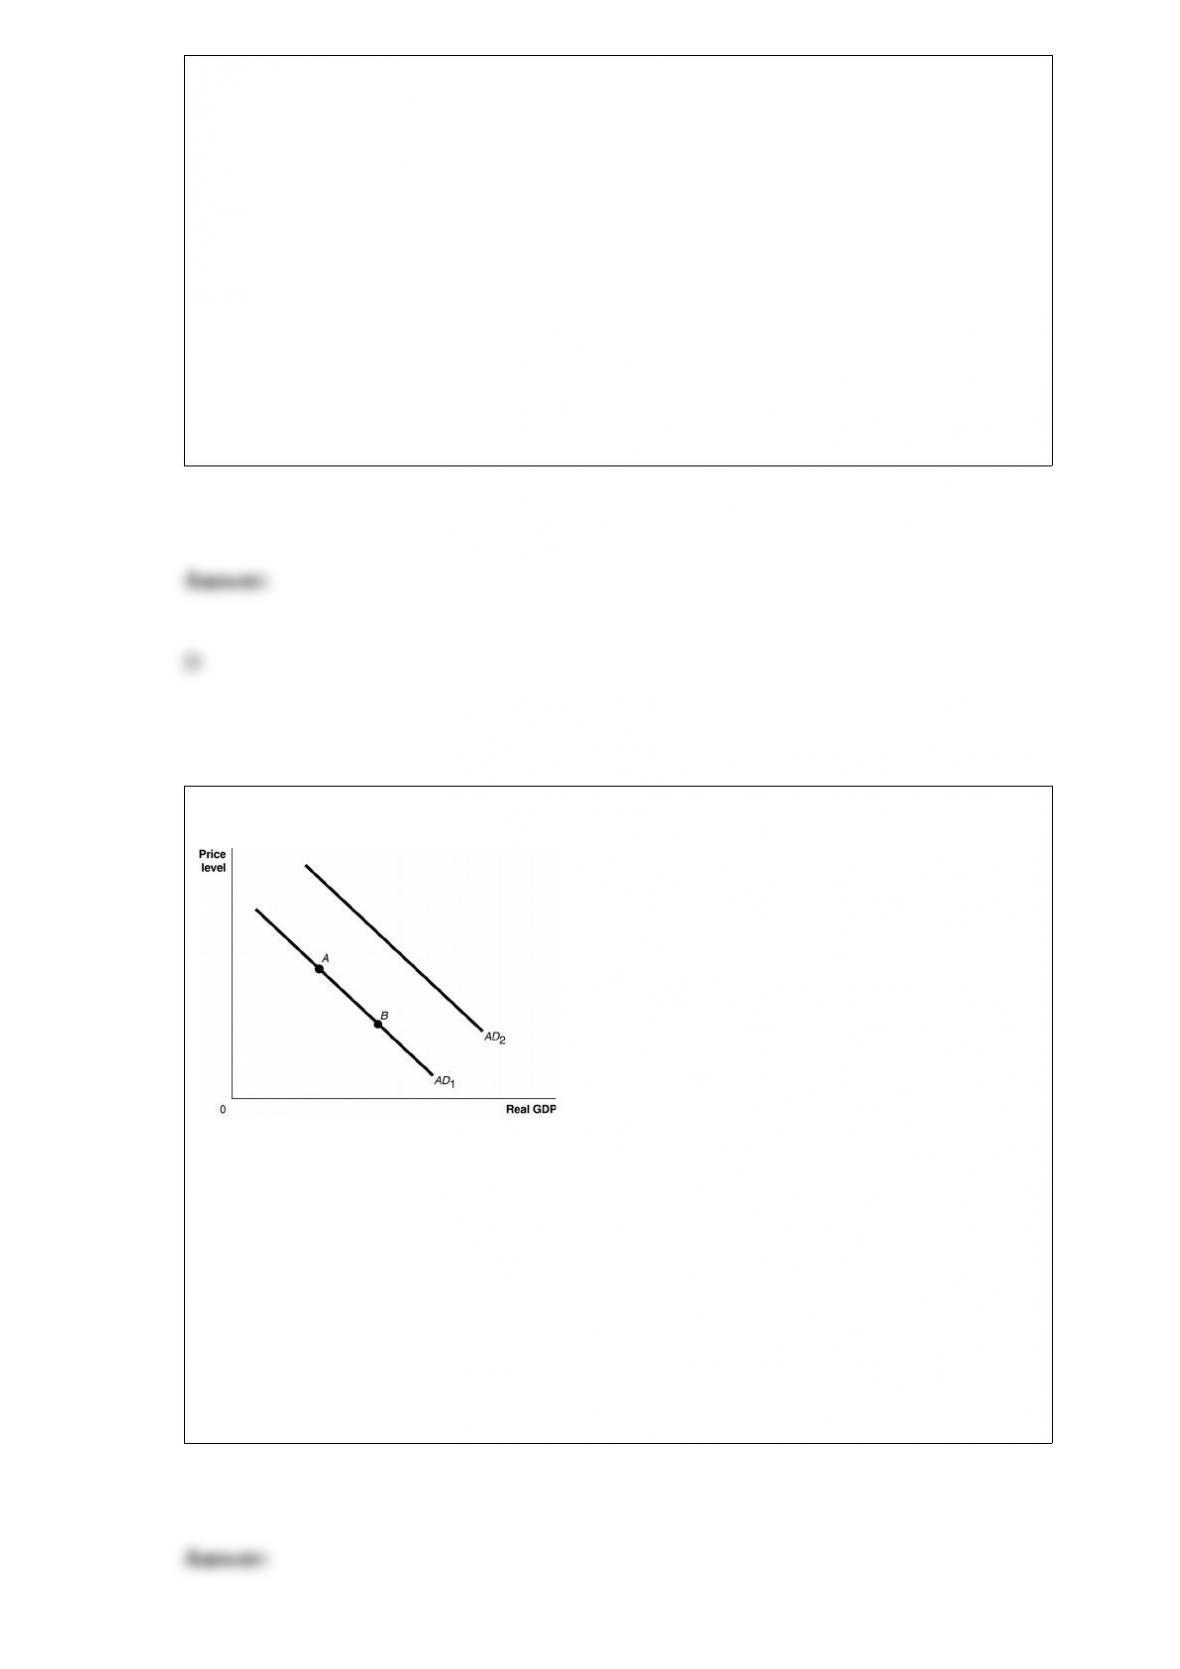
Figure 13-1
Refer to Figure 13-1. Ceteris paribus, an increase in the growth rate of domestic GDP
relative to the growth rate of foreign GDP would be represented by a movement from
A) AD1 to AD2.
B) AD2 to AD1.
C) point A to point B.
D) point B to point A.

If the economy receives an influx of new workers from immigration,
A) the long-run aggregate supply curve will shift to the right.
B) the long-run aggregate supply curve will shift to the left.
C) we will move up along the long-run aggregate supply curve.
D) we will move down along the long-run aggregate supply curve.
Jack just received a promotion at work and now works 50 hours per week instead of 35.
As a result,
A) the unemployment rate increased.
B) the unemployment rate decreased.
C) the labor force participation rate increased.
D) neither the unemployment rate nor the labor force participation rate changed.
Which of the following would not be considered a positive addition to household
wealth?
A) the equity in one’s home

B) 1,000 shares of Microsoft stock
C) a credit card balance
D) the balance in your checking account
Which of the following is not a durable good?
A) furniture
B) automobile
C) clothing
D) refrigerator
Table 8-28
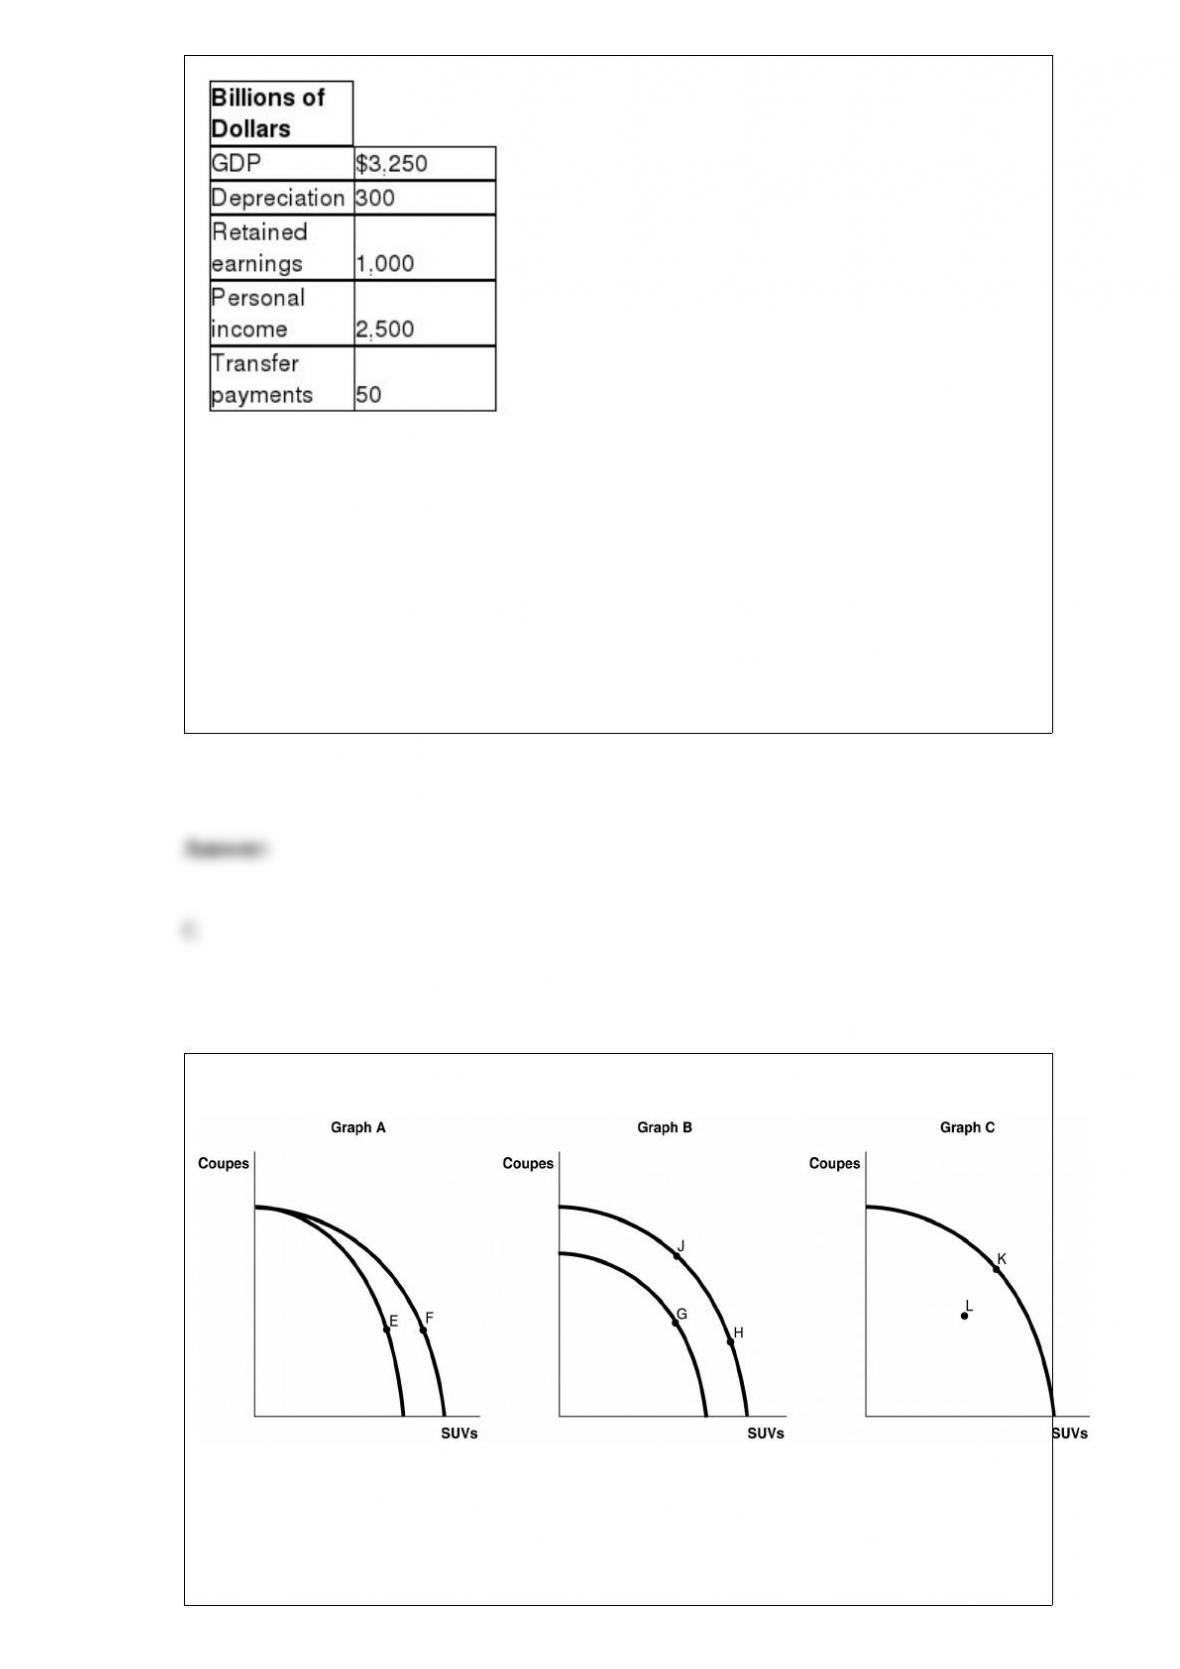
Refer to Table 8-28. Based on the table above, what is national income for this
economy?
A) $1,950 billion
B) $2,250 billion
C) $2,950 billion
D) $3,550 billion
Figure 2-7
Mercedes Benz produces a full line of luxury automobiles, including coupes, sedans,
and SUVs, at a variety of manufacturing plants across the globe. Assume Mercedes
Benz produces both coupes and SUVs at its Tuscaloosa, Alabama factory. Figure 2-7
shows changes to its production possibilities frontier in response to new developments
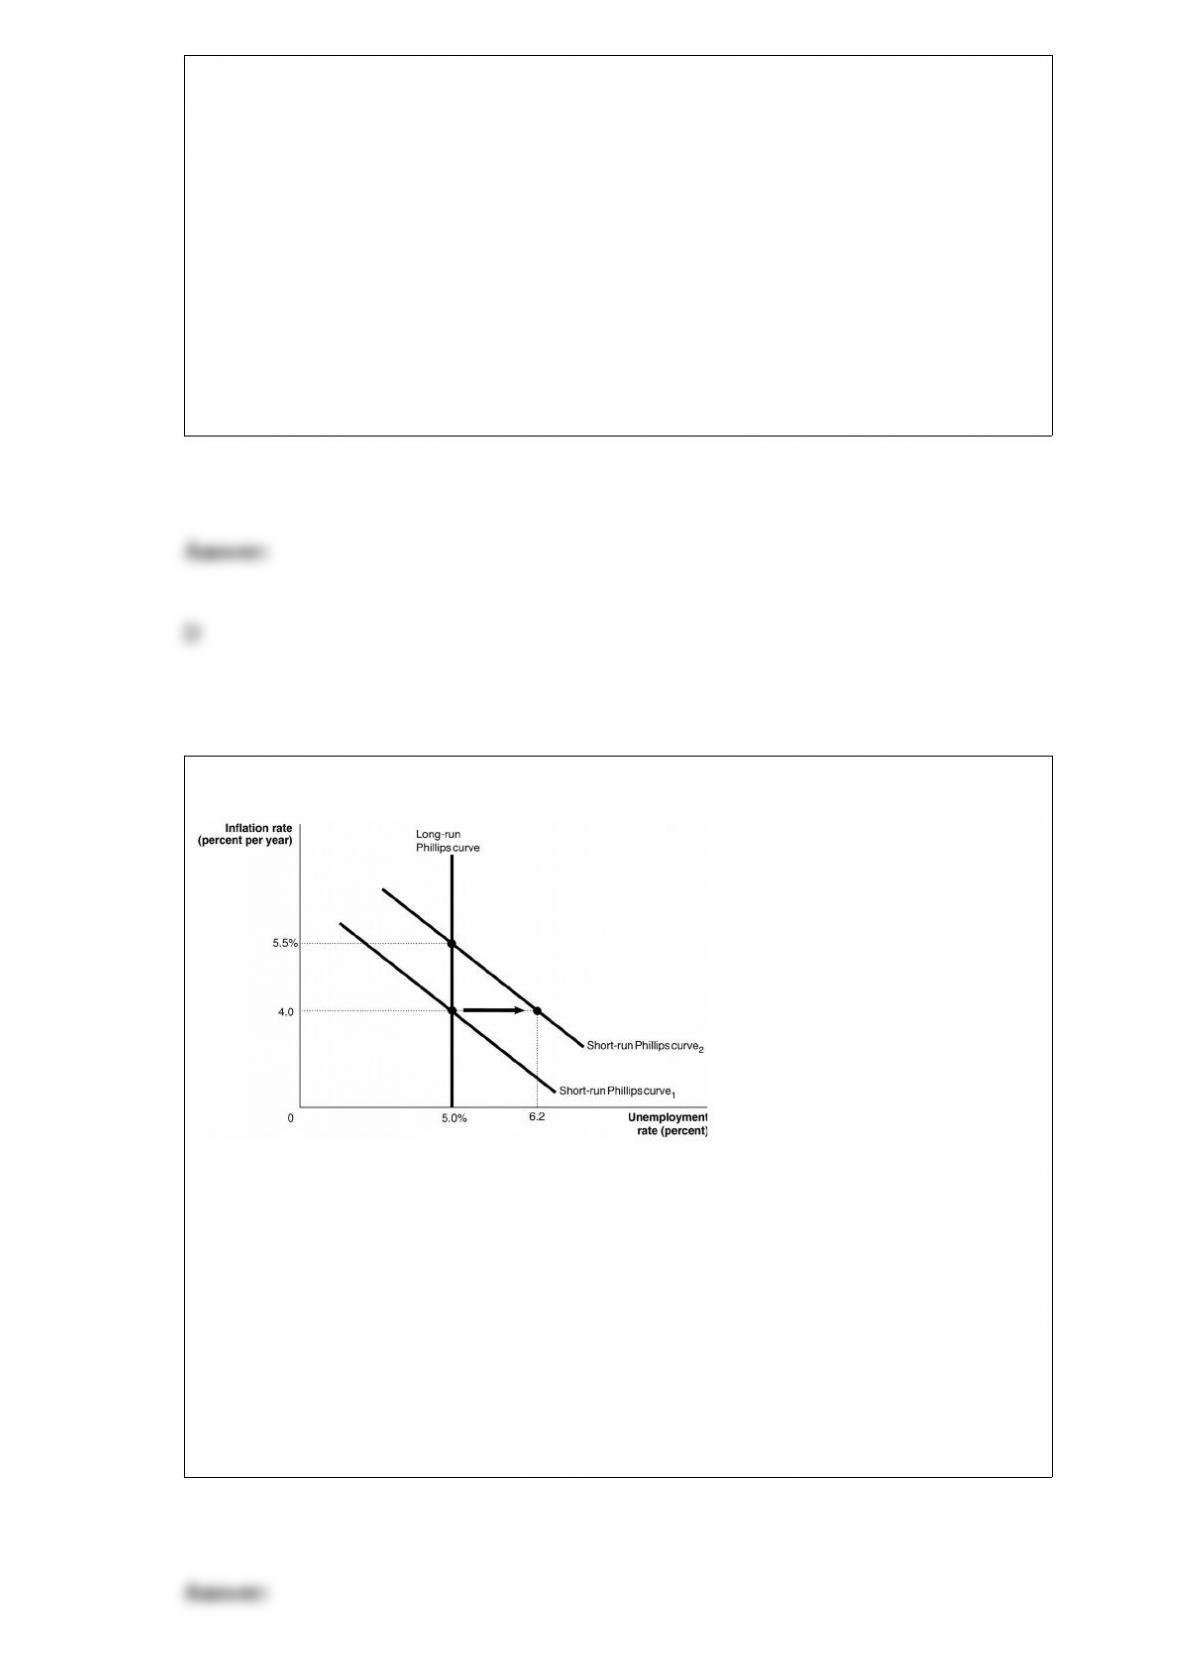
and different strategic production decisions at this factory.
Refer to Figure 2-7. In response to changing consumer demands, Mercedes-Benz cuts
back on the production of SUVs and increases its production of coupes. This strategy is
best represented by
A) movement from E to F in Graph A.
B) movement from G to H in Graph B.
C) movement from K to L in Graph C.
D) movement from H to J in Graph B.
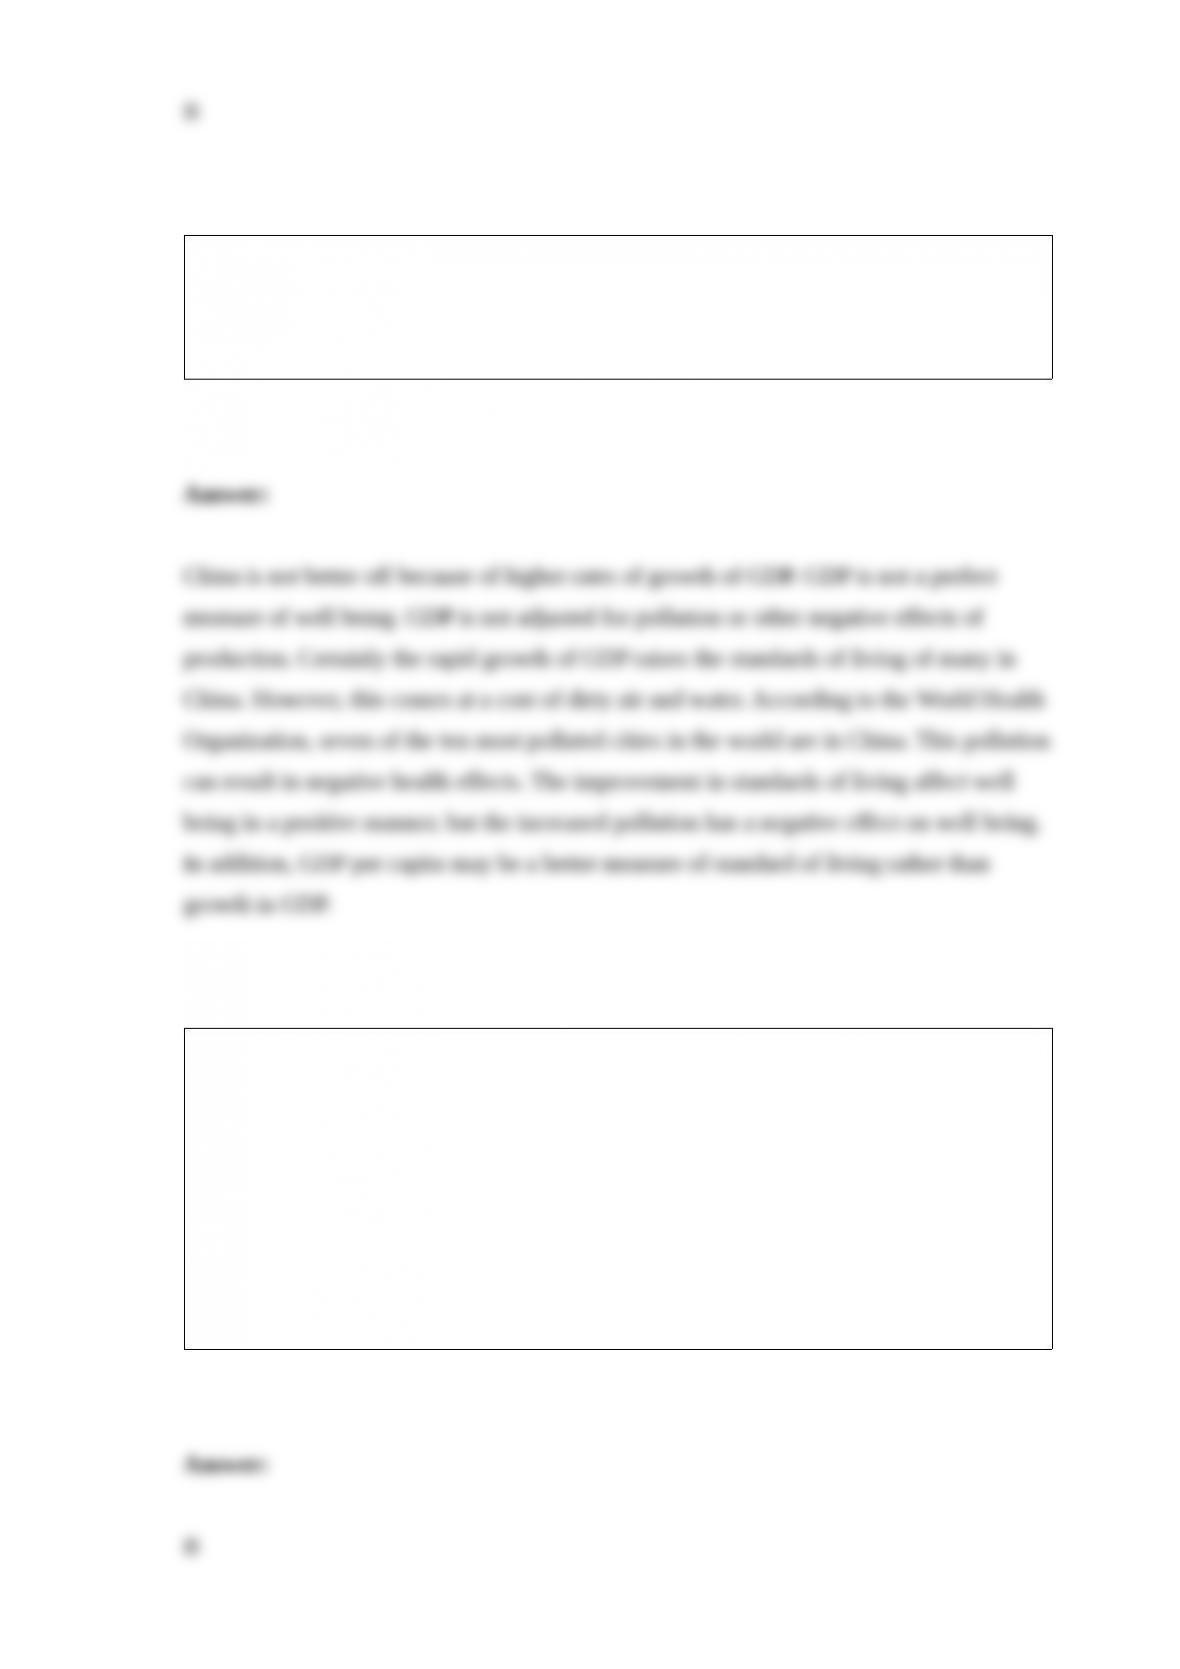
Figure 17-4
Refer to Figure 17-4. Consider the shift in the short-run Phillips curves shown in the
above graph. This shift may be explained by
A) an increase in the natural rate of unemployment from 5.0 to 6.2 percent.
B) an increase in the expected rate of inflation from 4.0 to 5.5 percent.
C) either an increase in the natural rate of unemployment from 5.0 to 6.2 percent or an
increase in the expected rate of inflation from 4.0 to 5.5 percent.
D) None of the above is correct.
China’s current rate of GDP growth is quite rapid. Its current growth rate is probably
three times that of the United States. However, the levels of pollution are much higher
in China. Would you consider China to be better off than the United States given this
information? Why or why not?
Farmers can plant either corn or soybeans in their fields. Which of the following would
cause the supply of soybeans to increase?
A) an increase in the price of soybeans
B) a decrease in the price of corn
C) an increase in the demand for corn
D) an increase in the price of soybean seeds
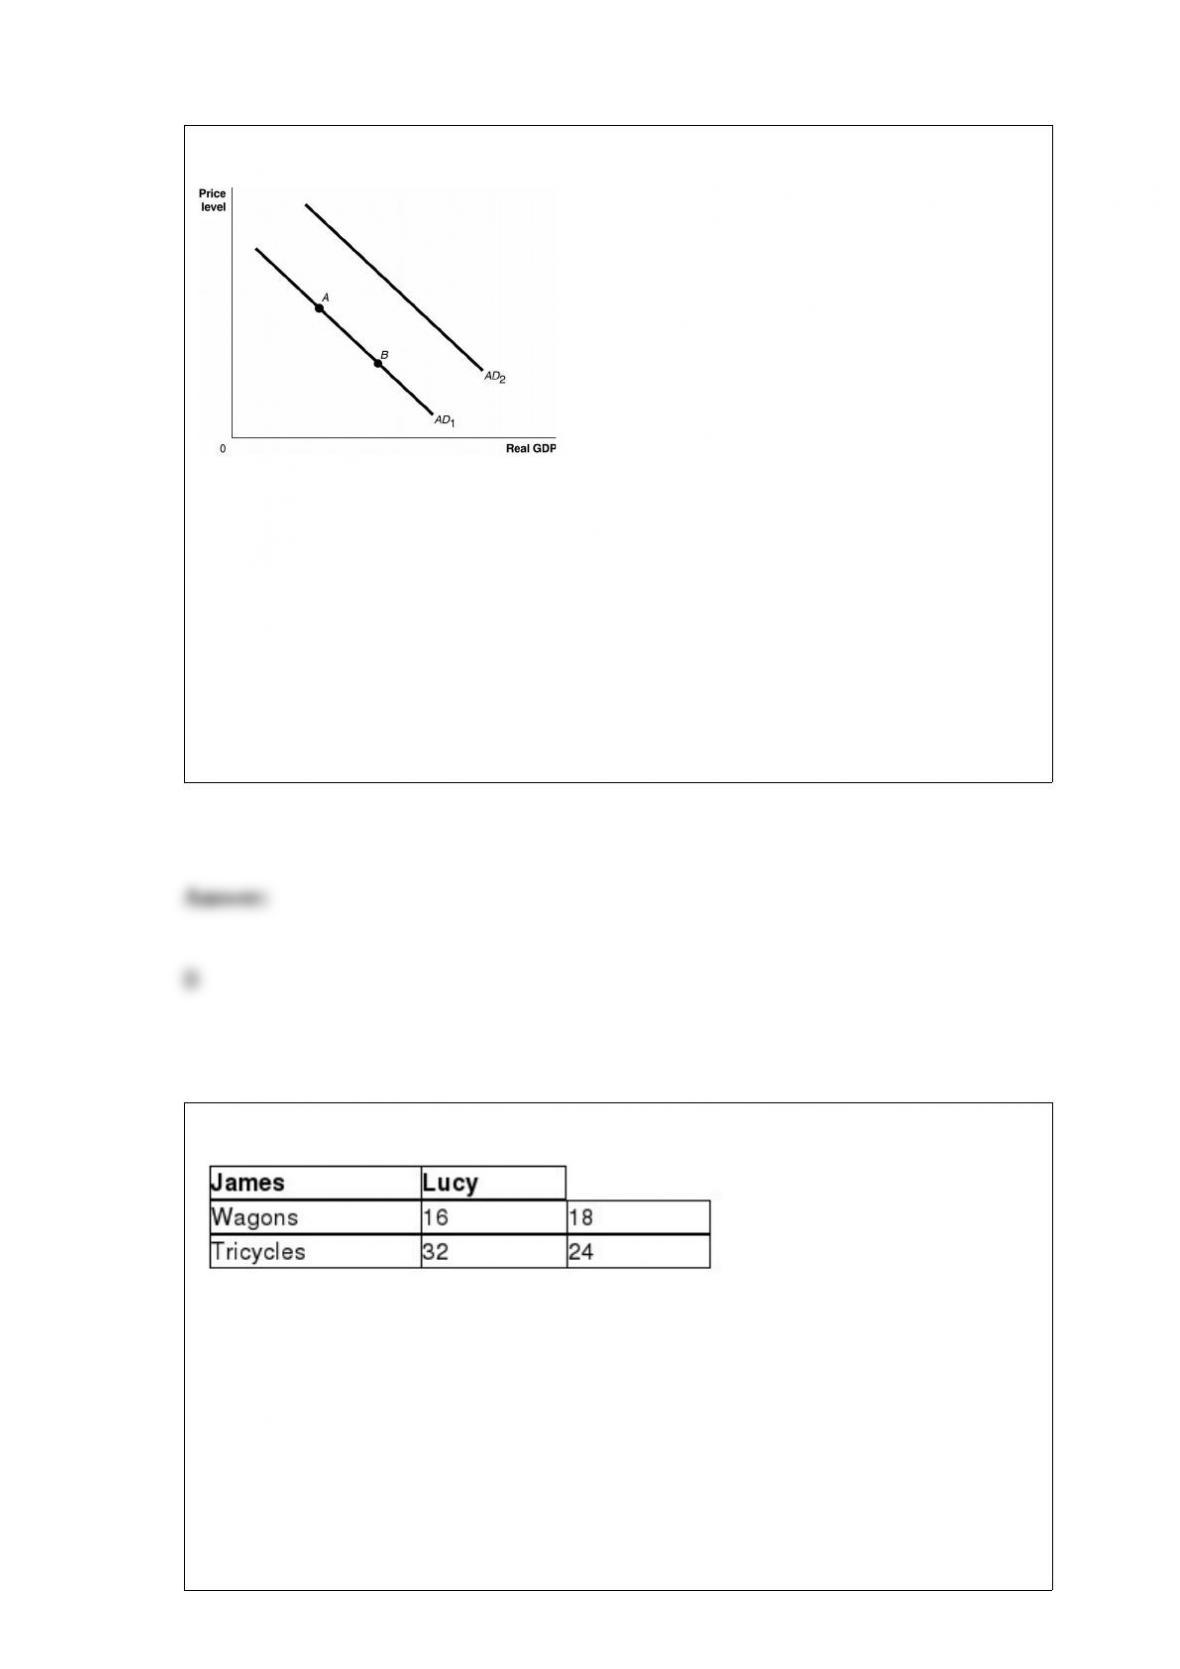
Figure 13-1
Refer to Figure 13-1. Ceteris paribus, an increase in interest rates would be represented
by a movement from
A) AD1 to AD2.
B) AD2 to AD1.
C) point A to point B.
D) point B to point A.
Table 2-6
Table 2-6 shows the output per week of two people, James and Lucy. They can either
devote their time to making bracelets or making necklaces.
Refer to Table 2-6. What is Lucy’s opportunity cost of making a wagon?
A) 3/4 of a wagon
B) 3 wagons
C) 1 1/3 tricycles

D) 2 tricycles