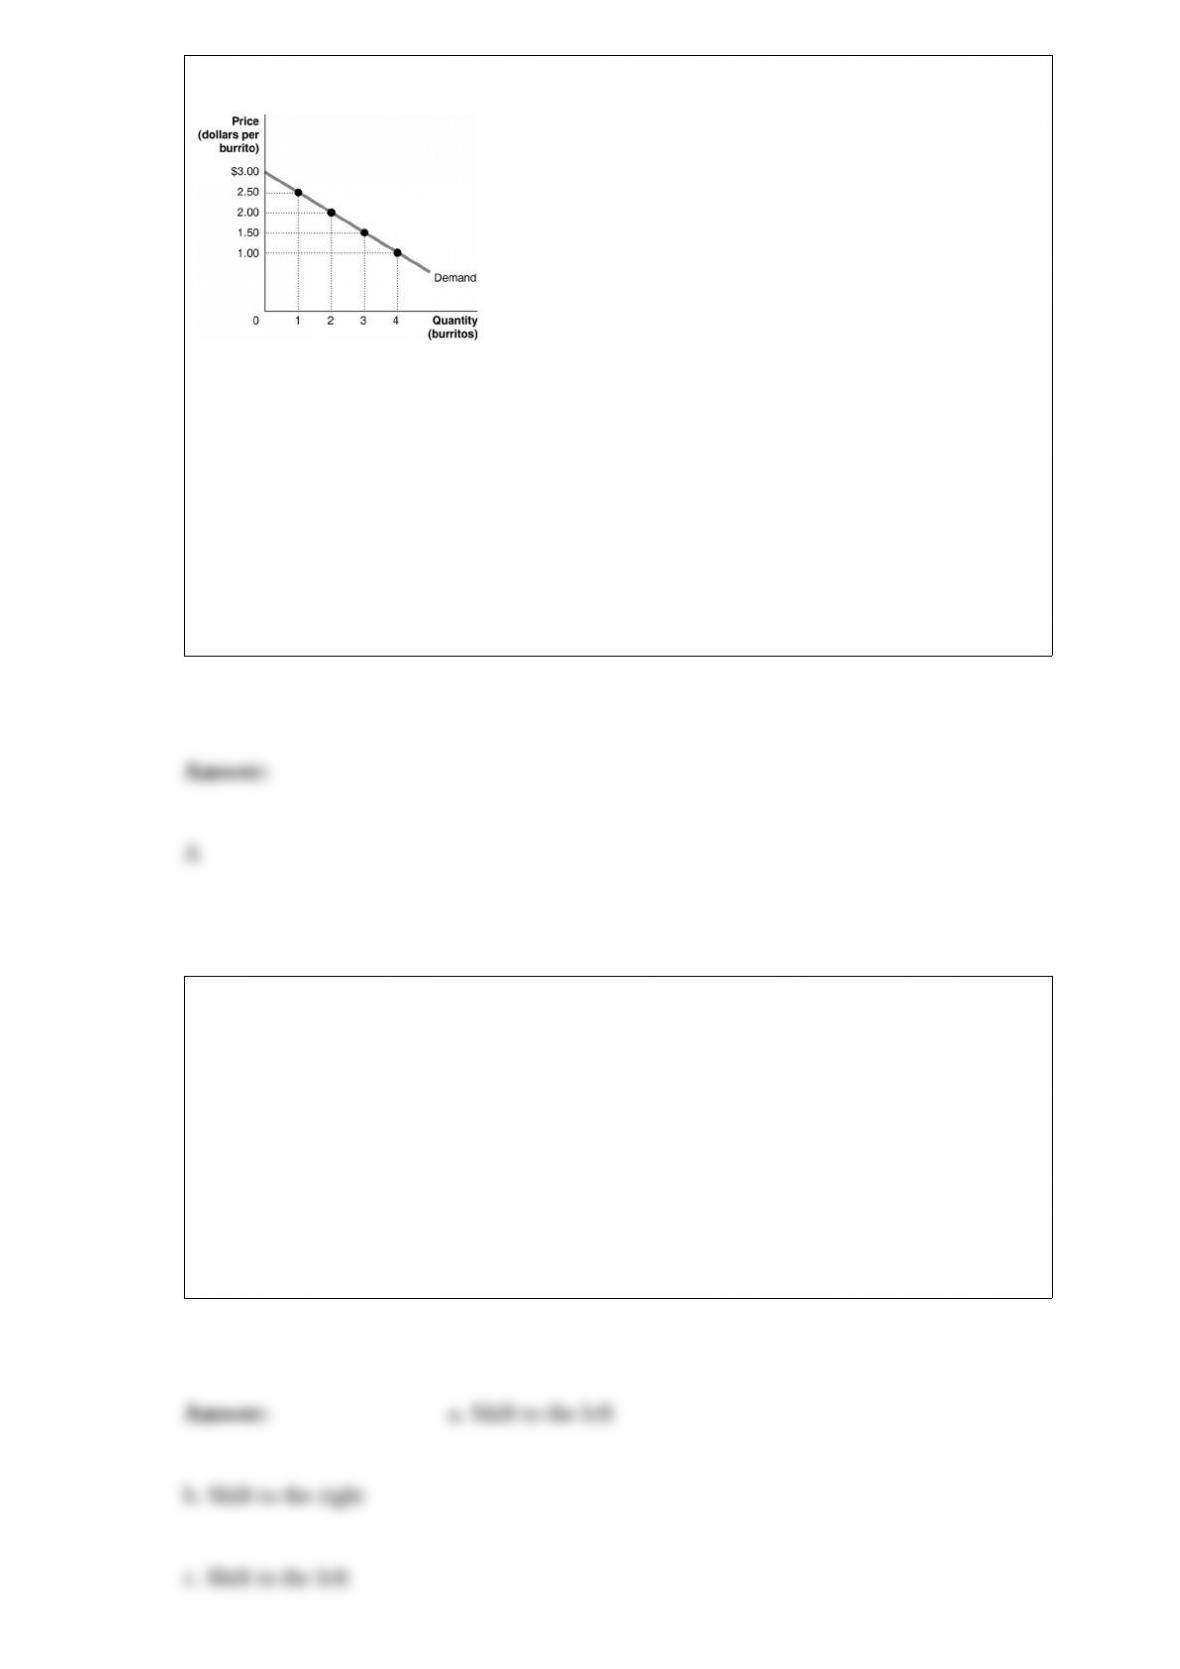
Figure 4-1
Figure 4-1 shows Arnold’s demand curve for burritos.
If the market price is $2.00, what is the consumer surplus on the second burrito?
A) $0
B) $1.00
C) $2.00
D) $4.50
Indicate whether each of the following situations would shift the supply curve to the
left, to the right, or not at all. a. An increase in the price of an input
b. An increase in productivity
c. An increase in the price of a substitute in production
d. A decrease in the expected future price of a product
e. A decrease in the current price of the product
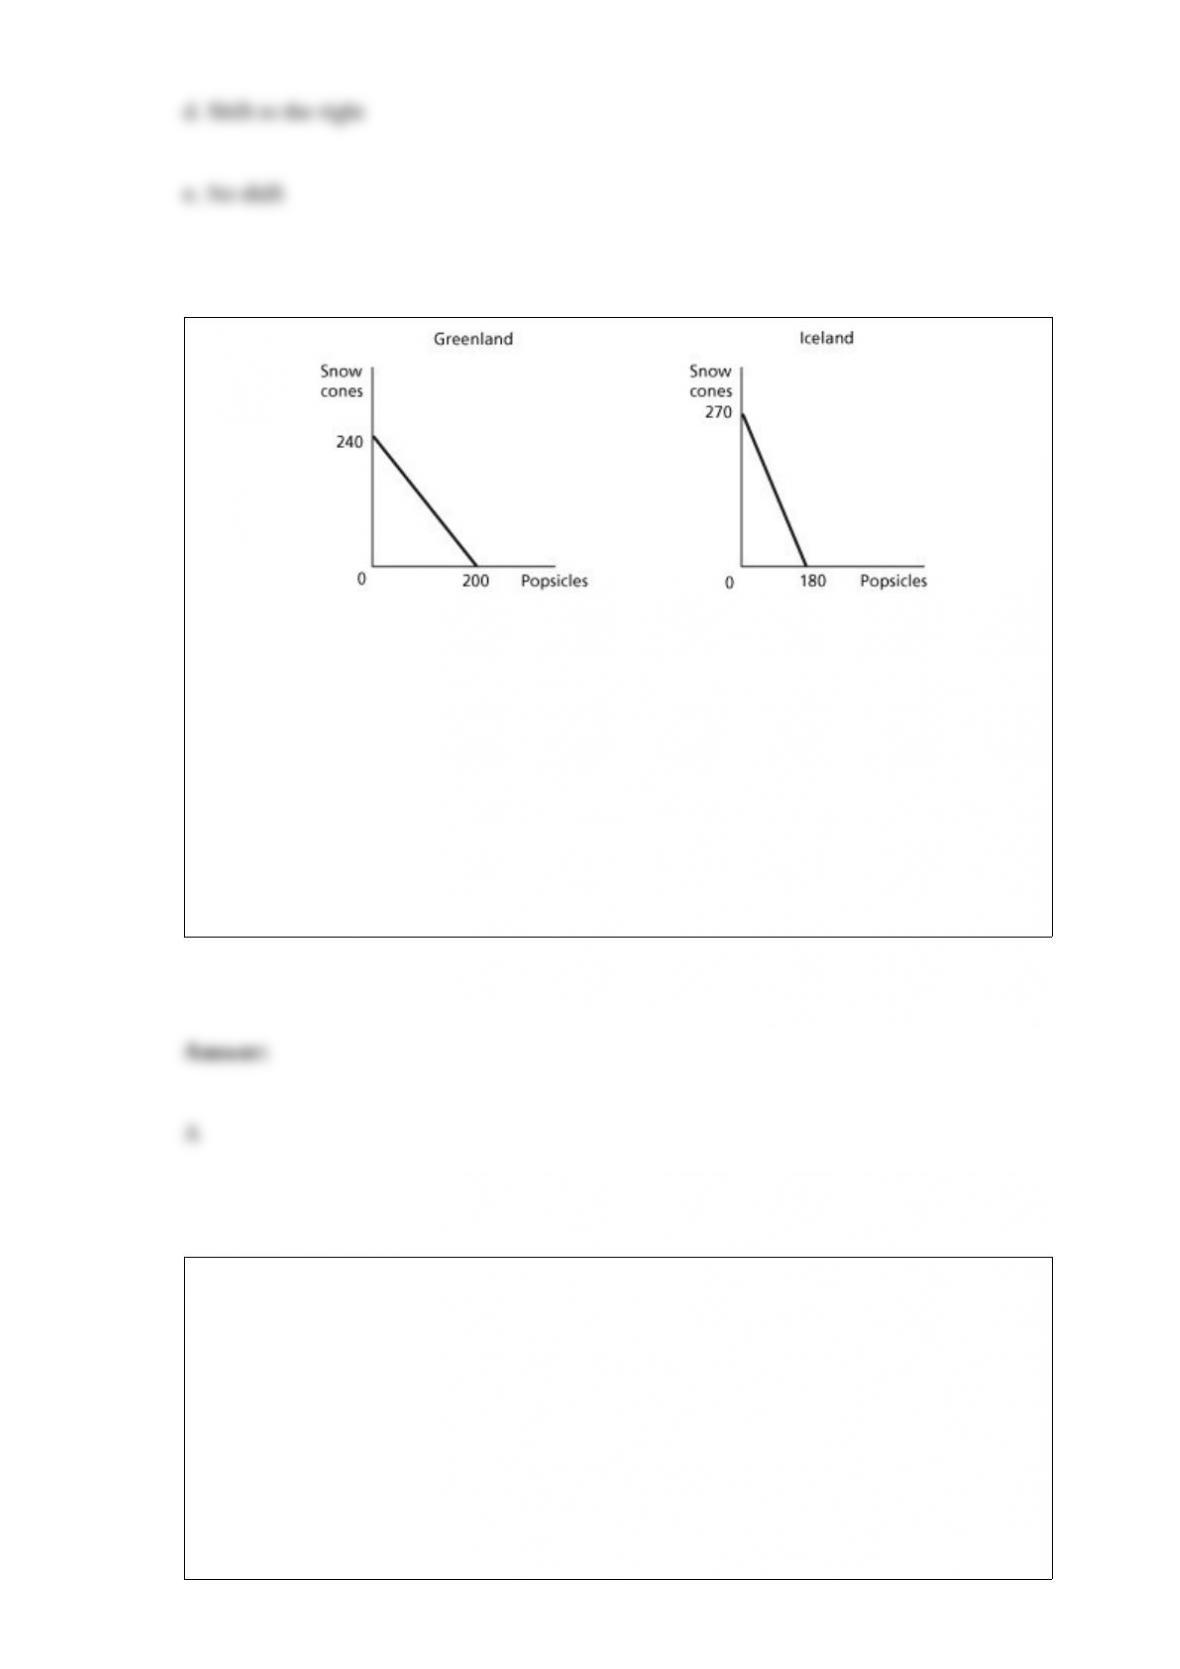
Figure 2-15 Figure
2-15 shows the production possibilities frontiers for Greenland and Iceland. Each
country produces two goods, snow cones and popsicles. What is the opportunity cost of
producing 1 snow cone in Iceland?
A) 2/3 of a popsicle
B) 3/4 of a popsicle
C) 1 1/2 popsicles
D) 180 popsicles
What is a secondary market?
A) a market where factory seconds and damaged merchandise are sold
B) a market where newly issued bonds are sold to initial buyers by the borrowing firm
C) a market where a newly issued stocks are sold to initial buyers by the borrowing
firm
D) a market where you can sell any stocks you own as a private investor
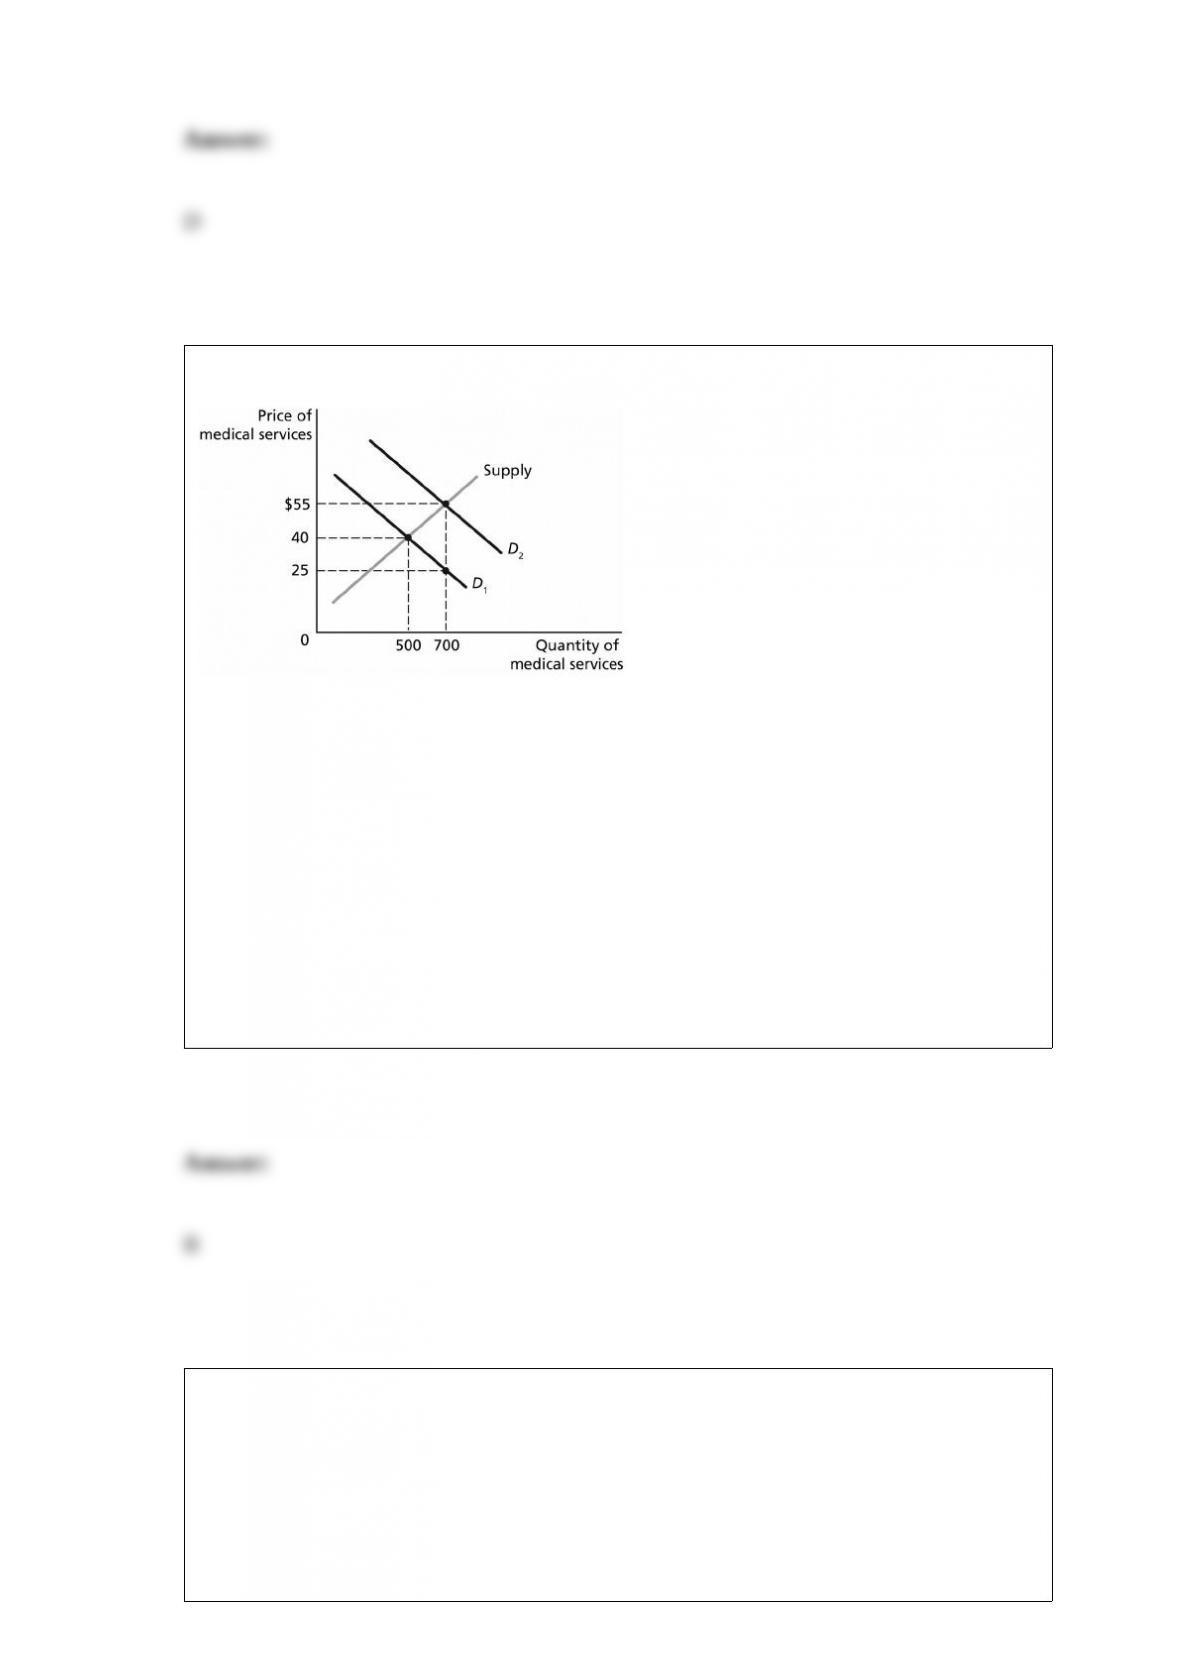
Figure 7-2
Figure 7-2 represents the market for
medical services with and without insurance, and the effect of a third-party payer
system on the demand for medical services.
If consumers paid the full price of medical services, the price they would pay is
A) $25.
B) $40.
C) $55.
D) >$55.
Mike has been unemployed for over a year. He hasn’t looked for a job in the last three
months, but he’s just started looking for work again. Because Mike started looking for a
new job,
A) the unemployment rate increased.
B) the labor force participation rate decreased.
C) the unemployment rate decreased.
D) the working-age population increased.
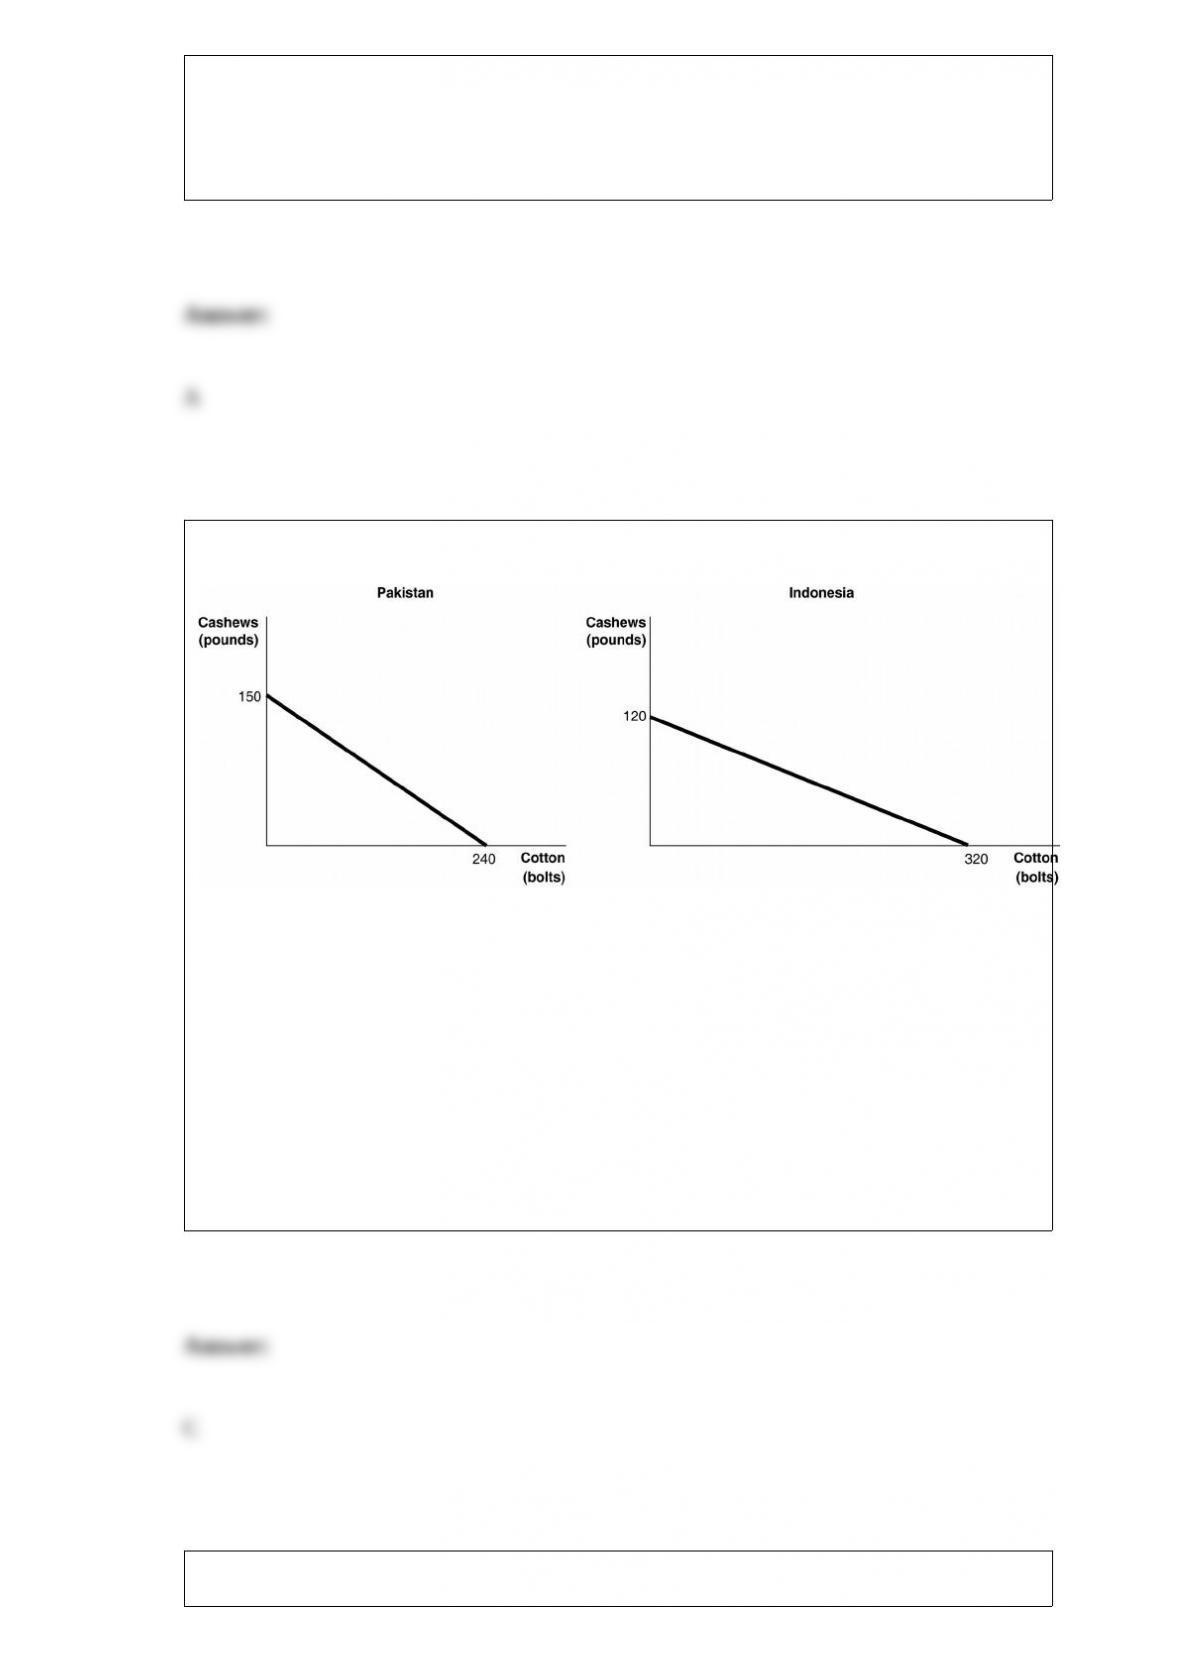
Figure 2-9
Figure 2-9 shows the production possibilities frontiers for Pakistan and Indonesia. Each
country produces two goods, cotton and cashews. Which country has a comparative
advantage in the production of cashews?
A) Indonesia
B) They have equal productive abilities.
C) Pakistan
D) neither country
The major criticism of real business cycle models is
A) negative technology shocks are uncommon and can’t explain all business cycle
fluctuations.
B) positive technology shocks actually push real GDP above the economy’s potential
GDP.
C) negative technology shocks actually push real GDP below the economy’s potential
GDP
D) this model relies too heavily on monetary explanations for fluctuations in real GDP.
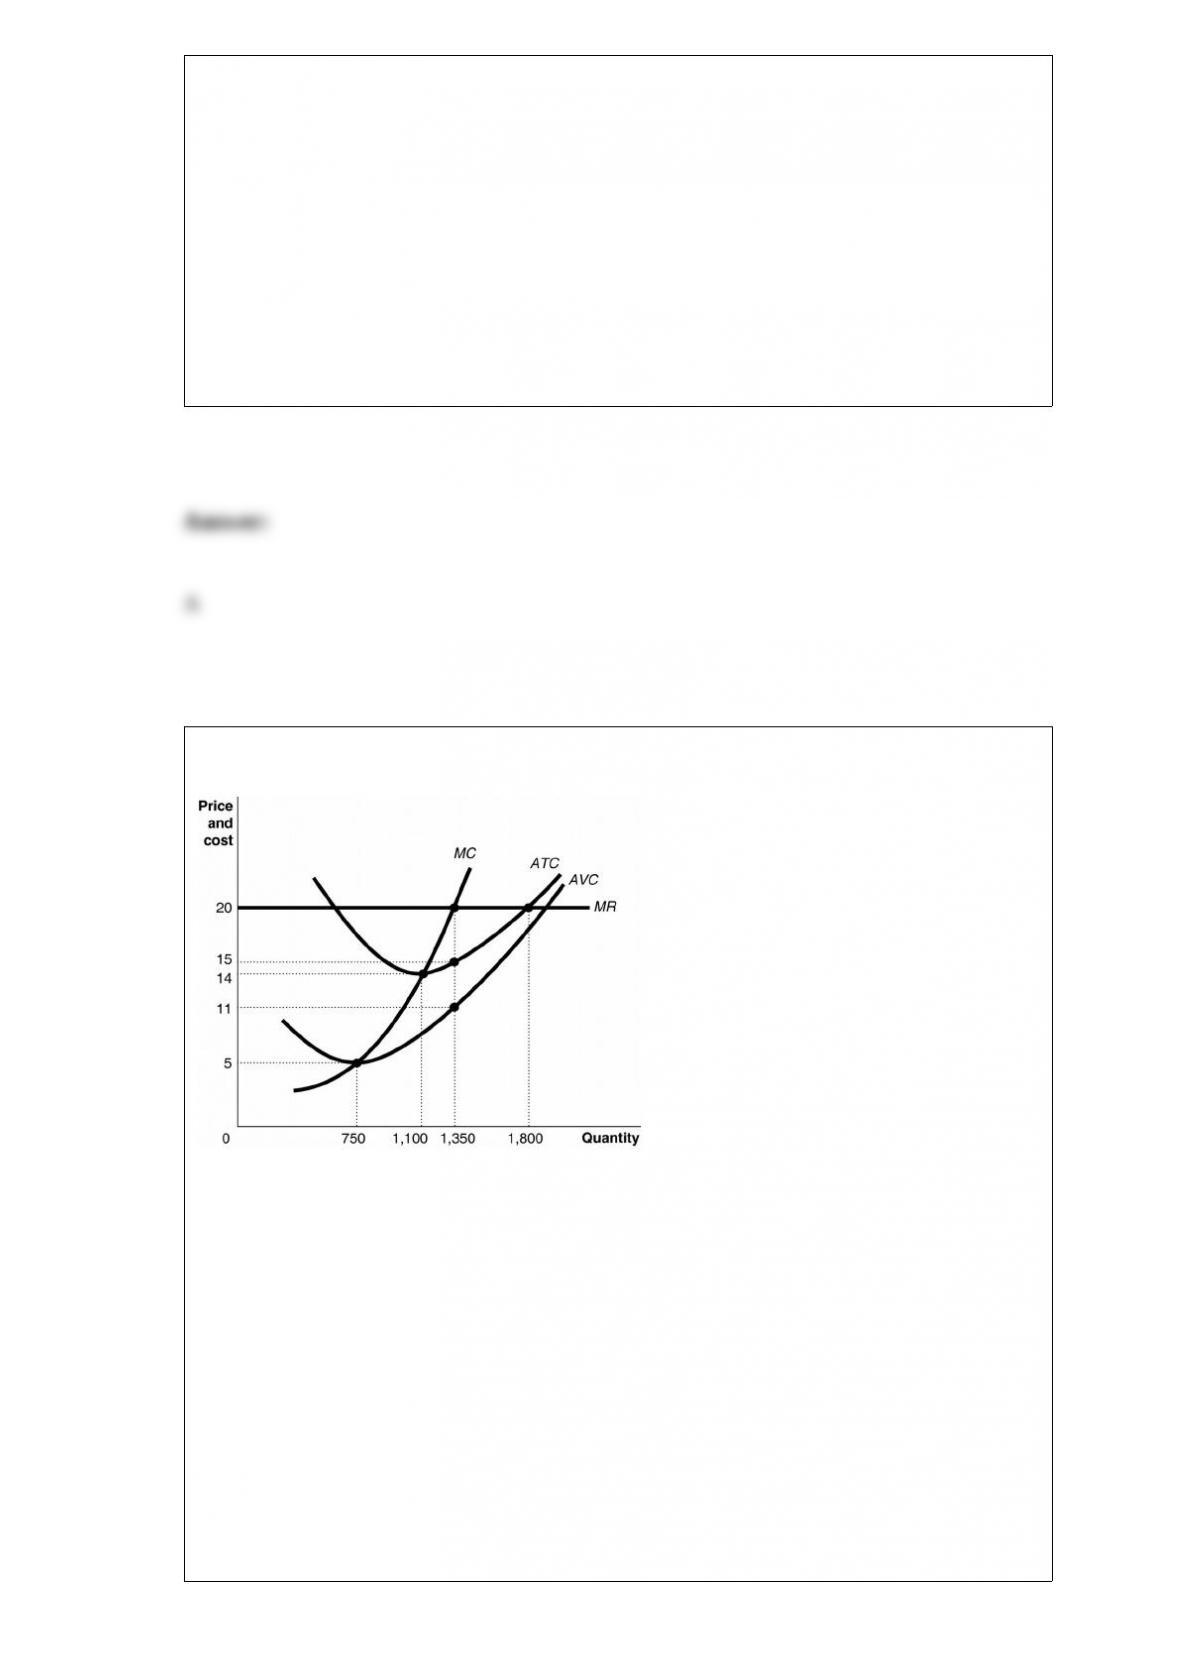
Figure 12-5
Figure 12-5 shows cost and demand
curves facing a typical firm in a constant-cost, perfectly competitive industry. If the
firm’s fixed cost increases by $1,000 due to a new environmental regulation, what
happens in the diagram above?
A) All the cost curves shift upward.
B) Only the average variable cost and average total cost curves shift upward; marginal
cost is not affected.
C) Only the average total cost curve shifts upward; the marginal cost and average
variable cost curves are not affected.
D) None of the curves shifts; only the fixed cost curve, which is not shown here, is
affected.

Dividing the current market price of a stock by the firm’s earnings per share gives the
firm’s
A) price-earnings ratio.
B) year-to-date percentage change.
C) dividend yield.
D) stock coupon maturity yield.
Dividing the dividend payment by the stock’s closing market price determines the
A) coupon payment.
B) dividend yield.
C) price-earnings ratio.
D) selling price of the stock.