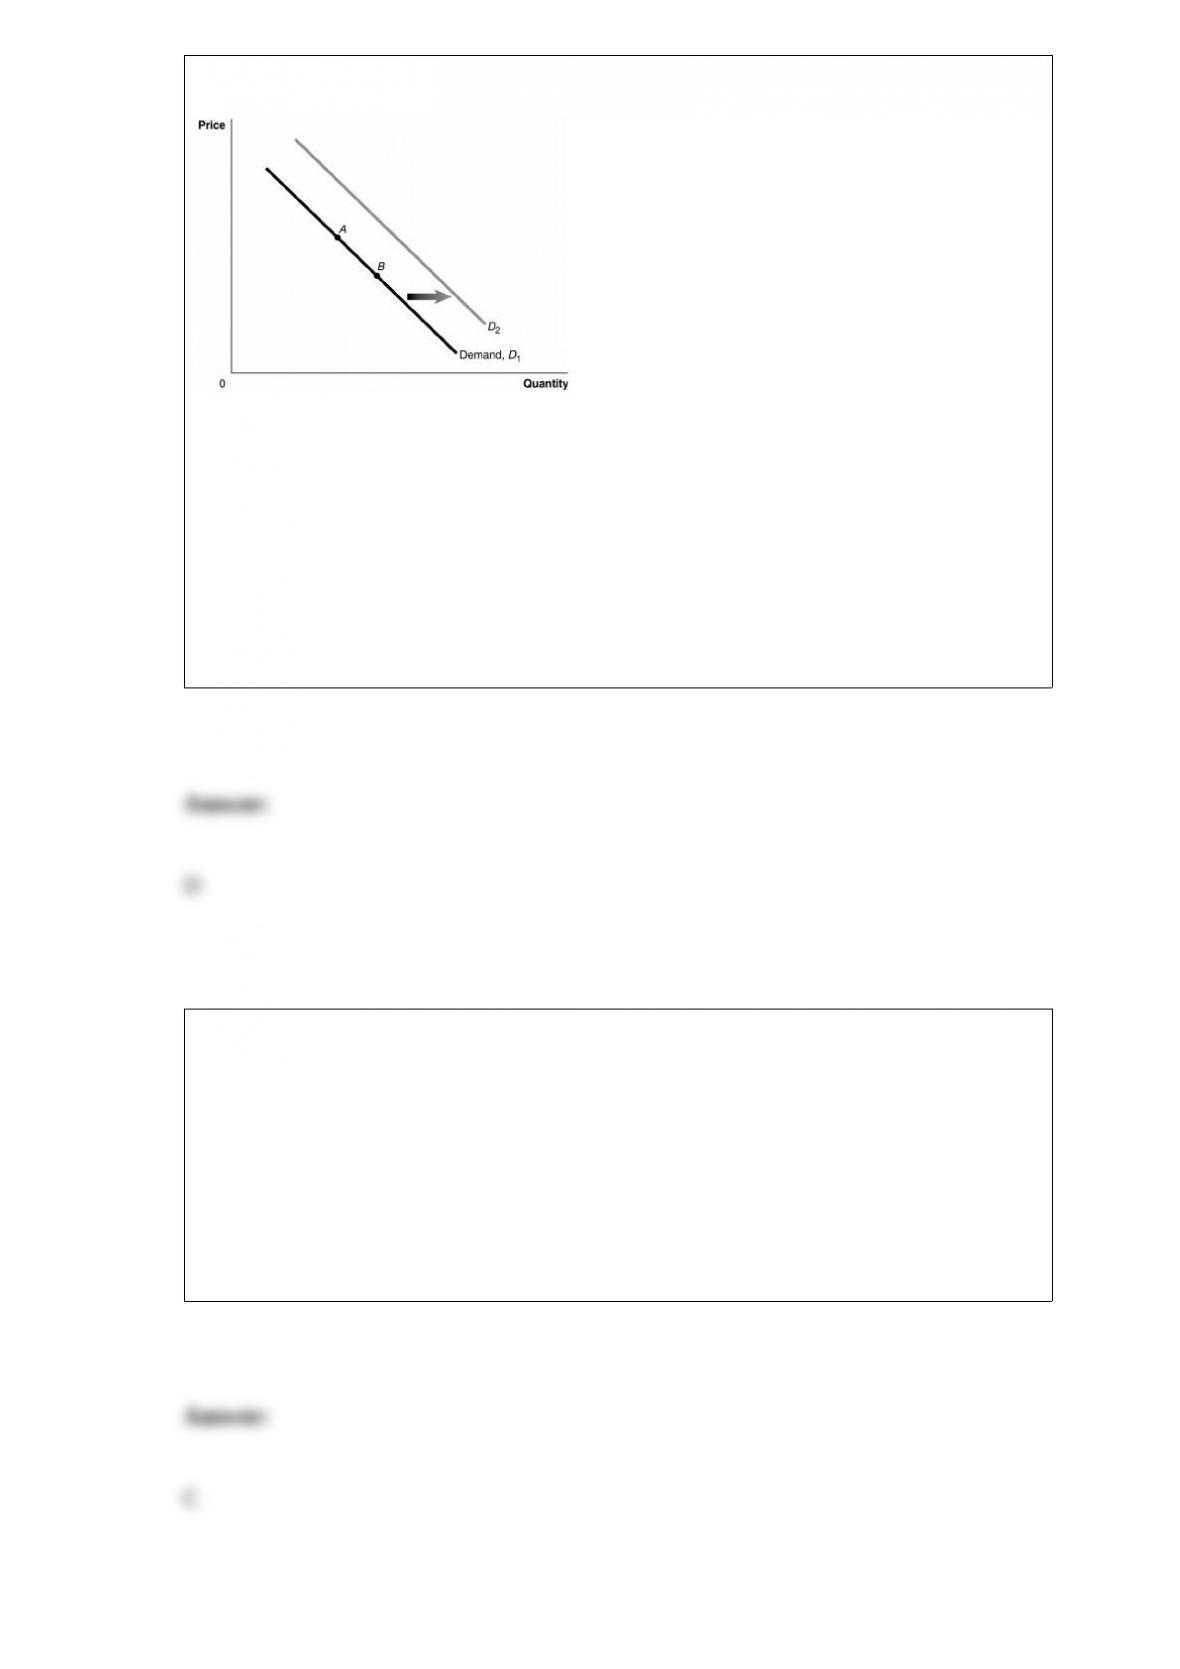
Figure 3-1
Refer to Figure 3-1. A decrease population would be represented by a movement from
A) A to B.
B) B to A.
C) D1 to D2.
D) D2 to D1.
An increase in the price level will
A) shift the aggregate demand curve to the left.
B) shift the aggregate demand curve to the right.
C) move the economy up along a stationary aggregate demand curve.
D) move the economy down along a stationary aggregate demand curve.
Suppose the Federal Reserve purchases $10,000 of Treasury bonds from you and that
you deposit the $10,000 into your checking account deposit at Bank Y. Assume that
Bank Y has no excess reserves at the time you make your deposit and that the required
reserve ratio is 20 percent.
a. Use a T-account to show the initial effect of this transaction on Bank Y’s balance
sheet.
b. Suppose that Bank Y makes the maximum loan they can from the funds you
deposited. Use a T-account to show the initial effect on Bank Y’s balance sheet from
granting the loan. Also include in this T-account the transaction from question (a.).
c. Now suppose that whoever took out the loan in question (b) writes a check for this
amount and that the person receiving the check deposits it in Bank Z. Show the effect of
these transactions on the balance sheet of Bank Y and Bank Z, after the check has been
cleared. On the T-account for Bank Y, include the transactions from questions (a) and
(b).
d. What is the maximum increase in checking account deposits that can result from your
$10,000 deposit? What is the maximum increase in the money supply? Explain.
If tablet computers are considered substitutes for e-readers, the increase in the price of
tablet computers would, all else equal,
A) increase the demand for e-readers.
B) decrease the demand for e-readers.
C) increase the quantity of e-readers demanded.
D) decrease the quantity of e-readers demanded.
Figure 11-4
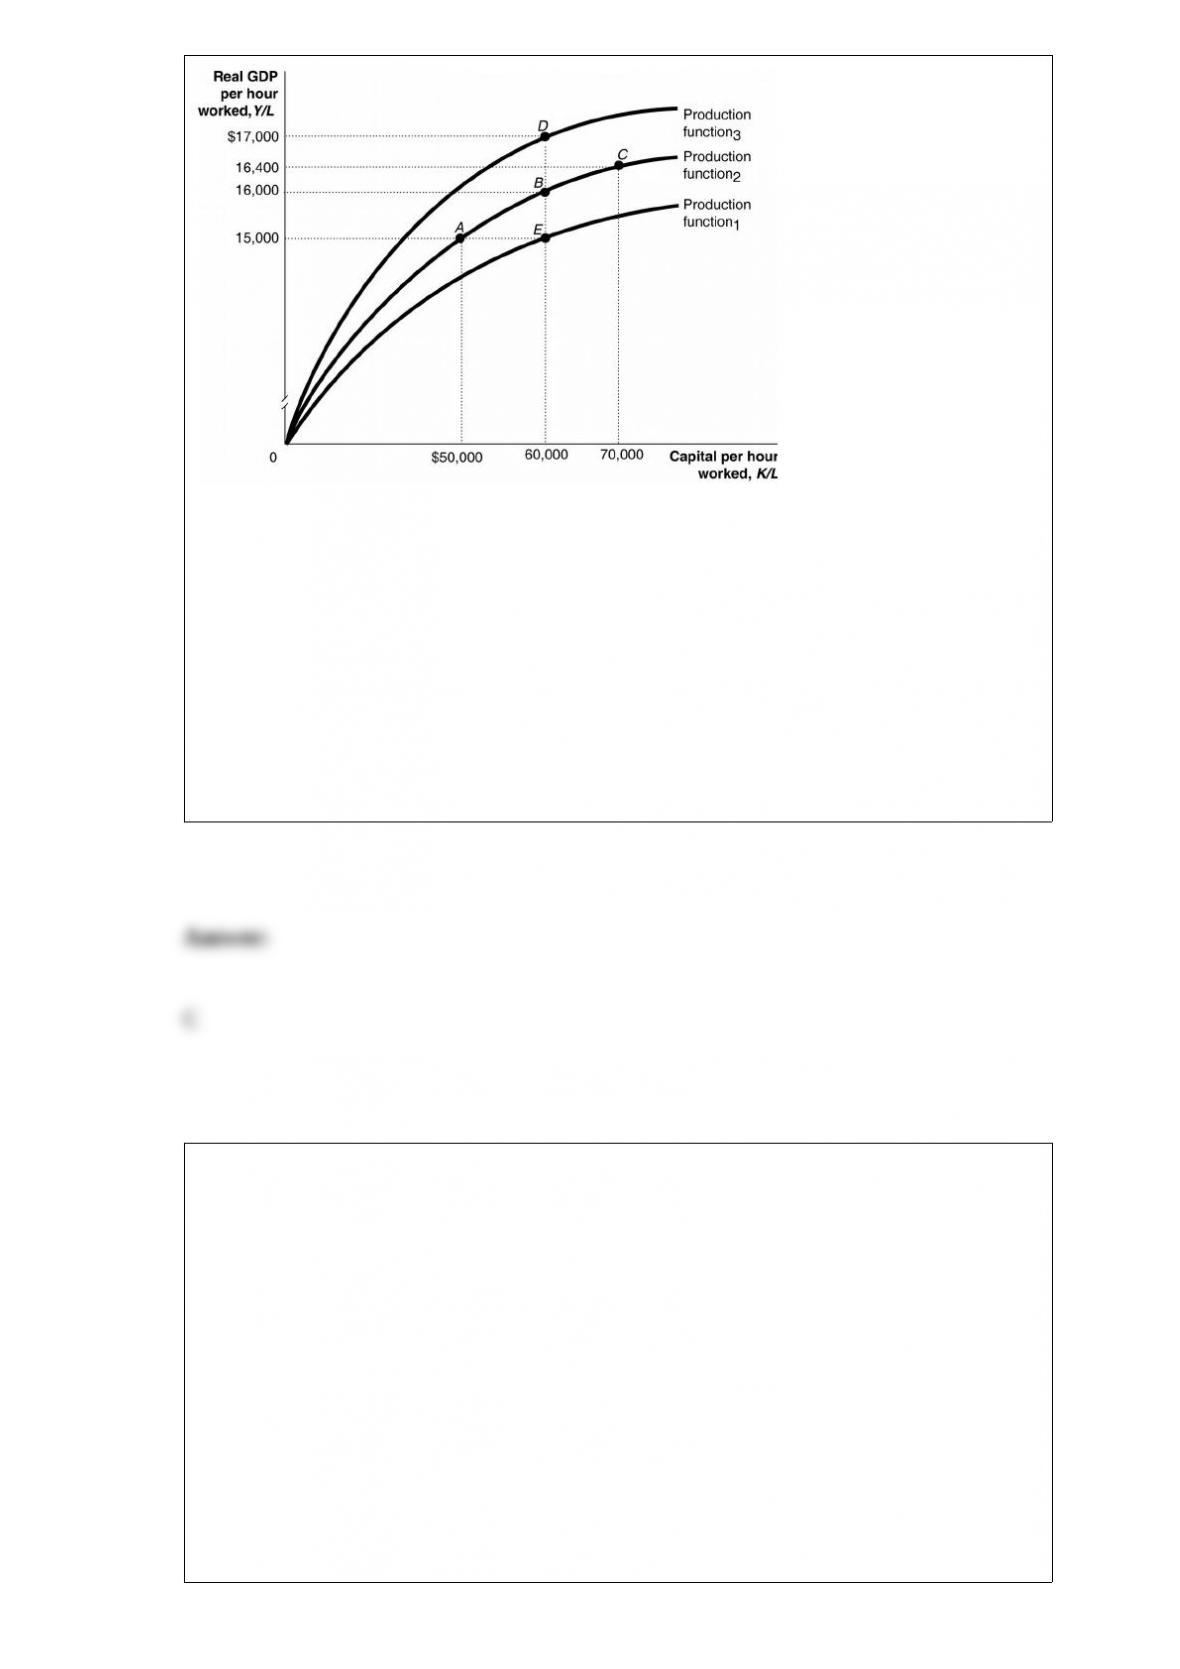
Refer to Figure 11-4. Within a country, the impact of wars and revolutions and their
subsequent destruction of capital is reflected in the per-worker production function in
the figure above by a movement from
A) A to C.
B) B to C.
C) B to A.
D) E to B.
Which of the following describes the difference between ‘scarcity” and ‘shortage”?
A) There is no difference; either word can be used to describe the situation that exists
when there is less of a good or service available than people want.
B) In the economic sense, almost everything is scarce. A shortage of a good or service
occurs when the quantity demanded is greater than the quantity supplied at the current
market price.
C) There is a shortage of almost everything. Scarcity occurs only if the quantity
demanded of a good or service is greater than the quantity supplied at the current
market price.
D) In the economic sense, almost everything is scarce. A shortage of a good or service

occurs when the quantity demanded is greater than the quantity supplied at the
equilibrium price.
During the expansion phase of the business cycle, which of the following eventually
increases?
A) production
B) employment
C) income
D) all of the above
When calculating GDP, the Bureau of Economic Analysis releases its “advanced
estimate” of a quarter’s GDP approximately
A) three months before the quarter has ended.
B) one month after the quarter has ended.
C) three months after the quarter has ended.
D) one year after the quarter has ended.

An explanation for the productivity slowdown from 1974 through 1995 is
A) measurement problems.
B) creative destruction.
C) a decline in oil prices.
D) an increase in labor quality.
Of the following high-income countries, which has the highest mortality ratio for
cancer?
A) Canada
B) Japan
C) the United Kingdom
D) the United States
Figure 4-4
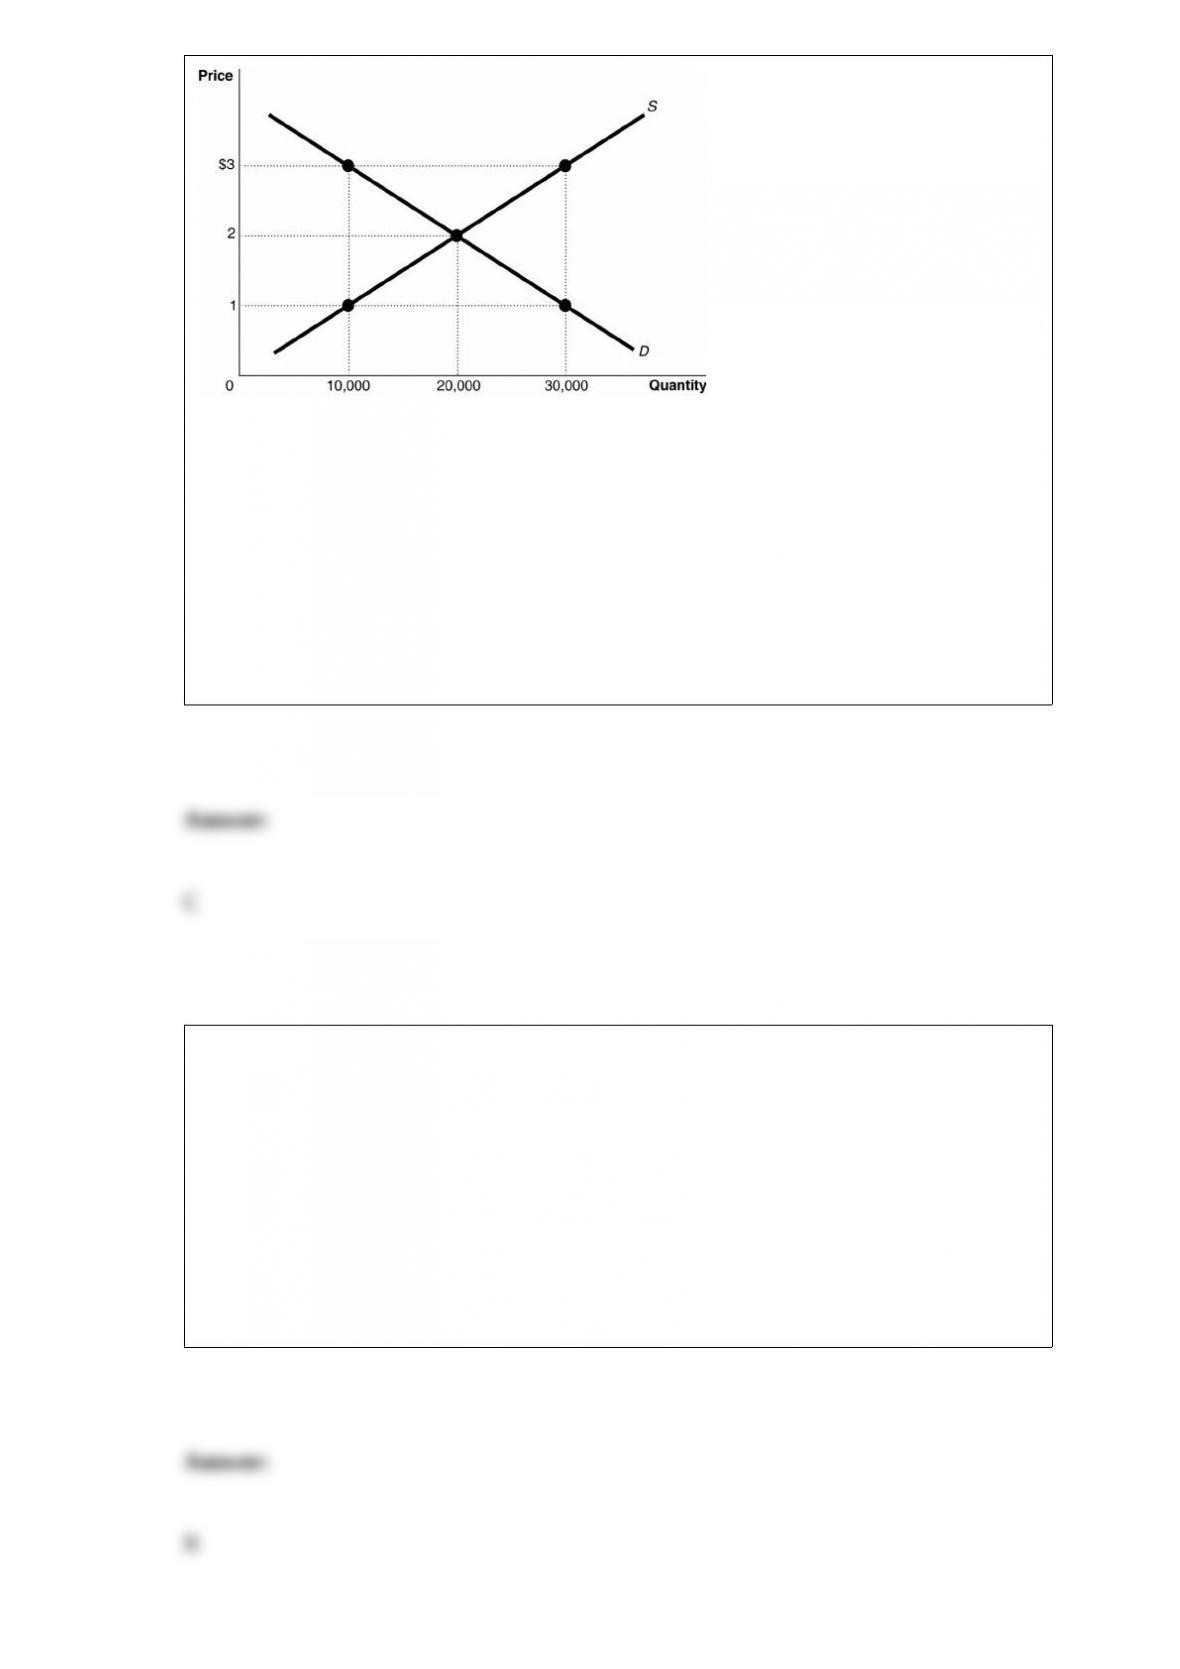
Refer to Figure 4-4. The figure above represents the market for iced tea. Assume that
this is a competitive market. If 10,000 units of iced tea are sold
A) the deadweight loss is equal to economic surplus.
B) producer surplus equals consumer surplus.
C) the marginal benefit of each of the 10,000 units of iced tea equals $3.
D) marginal benefit is less than marginal cost.
If a graph has a line that shows the quantity of flat-screen televisions sold in the last
five years, it is known as
A) a pie chart.
B) a time-series graph.
C) a demand curve for outsourcing.
D) a supply curve of outsourcing.

A decrease in the price level results in a(n) ________ in the quantity of real GDP
demanded because a lower price level ________ consumption, investment, and net
exports.
A) decrease; increases
B) increase; increases
C) decrease; decreases
D) increase; decreases
Which of the following transactions would be included in Germany’s current account?
A) A German citizen purchases 100 shares of Texas Instruments stock.
B) An American citizen purchases 100 shares of BMW stock.
C) A German citizen purchases a new Volkswagen made in Germany.
D) An American citizen purchases a new Volkswagen made in Germany.
Would a change in the price of in-line skates cause a change in the supply of in-line
skates? Why or why not?
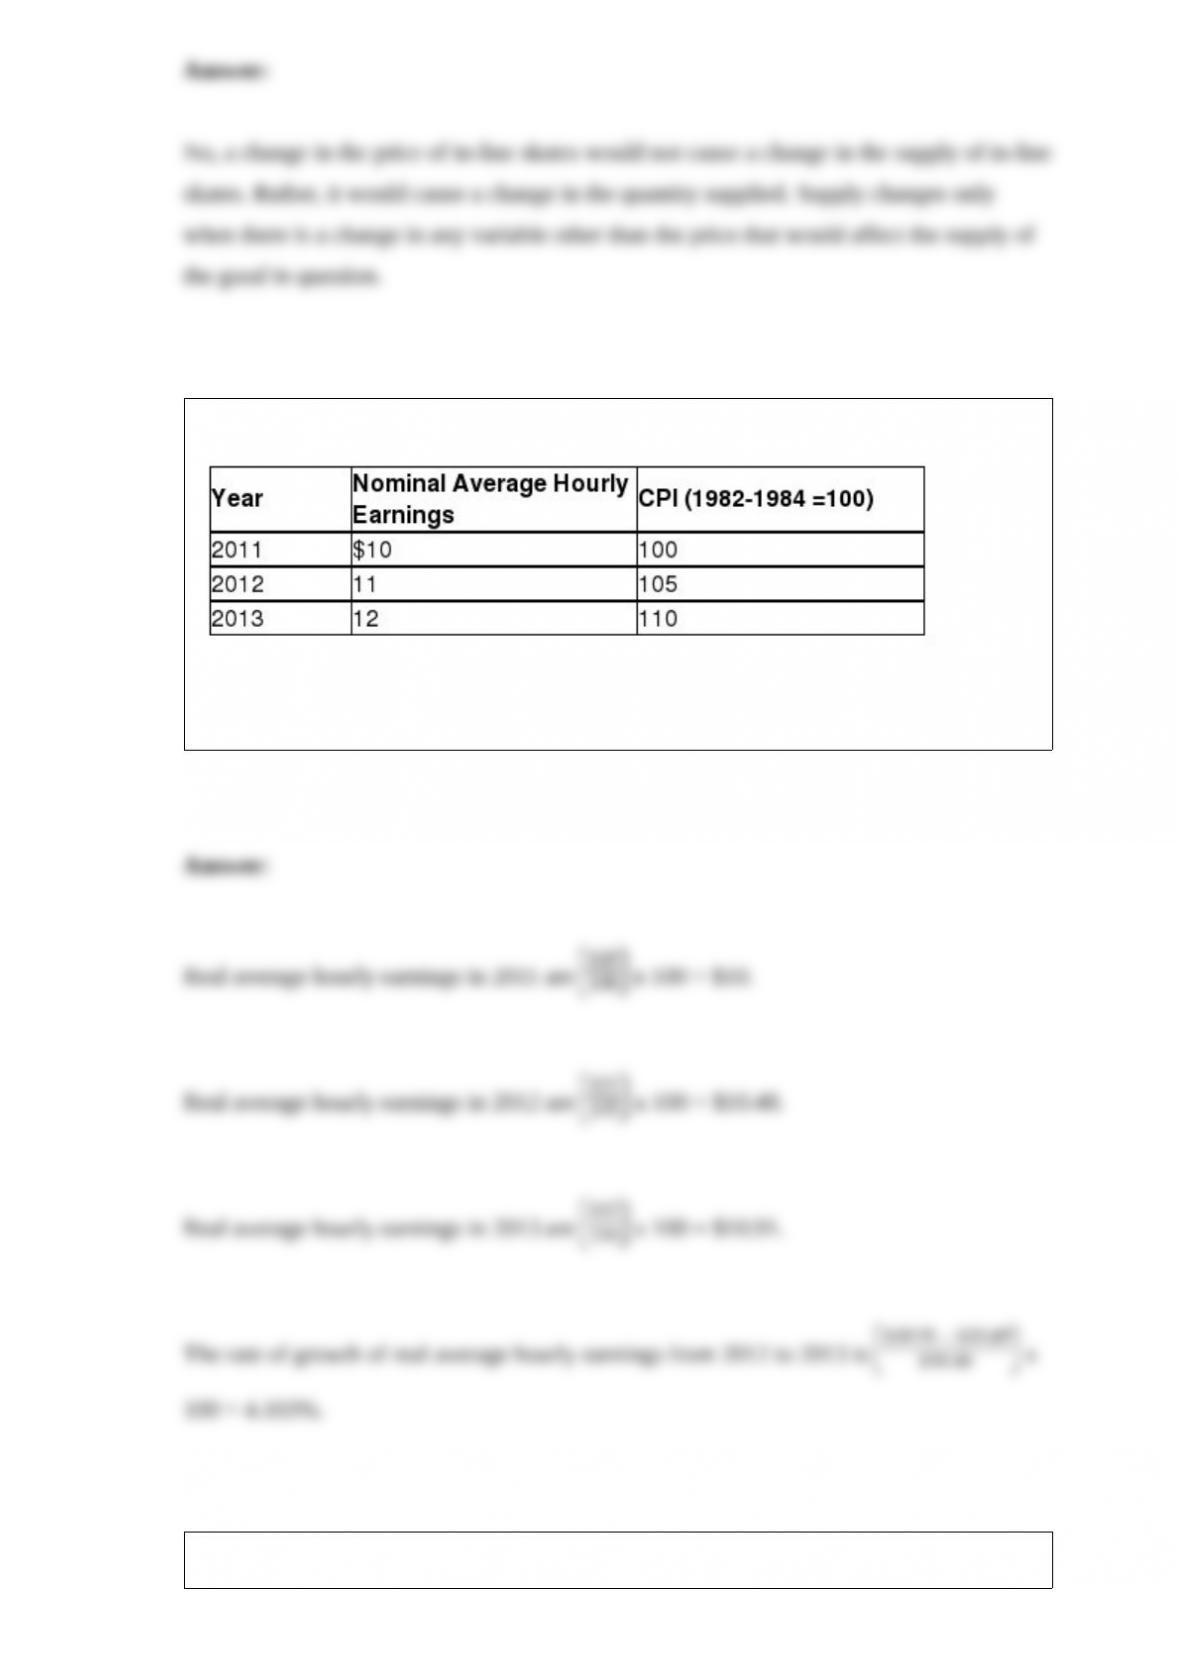
Table 9-22
Refer to Table 9-22. Using the above table, calculate real average hourly earnings for
2011, 2012, and 2013. Calculate the rate of growth of real average hourly earnings from
2012 to 2013.
According to the Taylor rule, does the target for the federal funds rate respond
differently for an increase in inflation caused by an increase in aggregate demand and
for an increase in inflation caused by a decrease in short-run aggregate supply? Explain
whether there is or is not a difference in how the target for the federal funds rate
changes.
What are the implications of the quantity theory of money for monetary policy and
price stability?
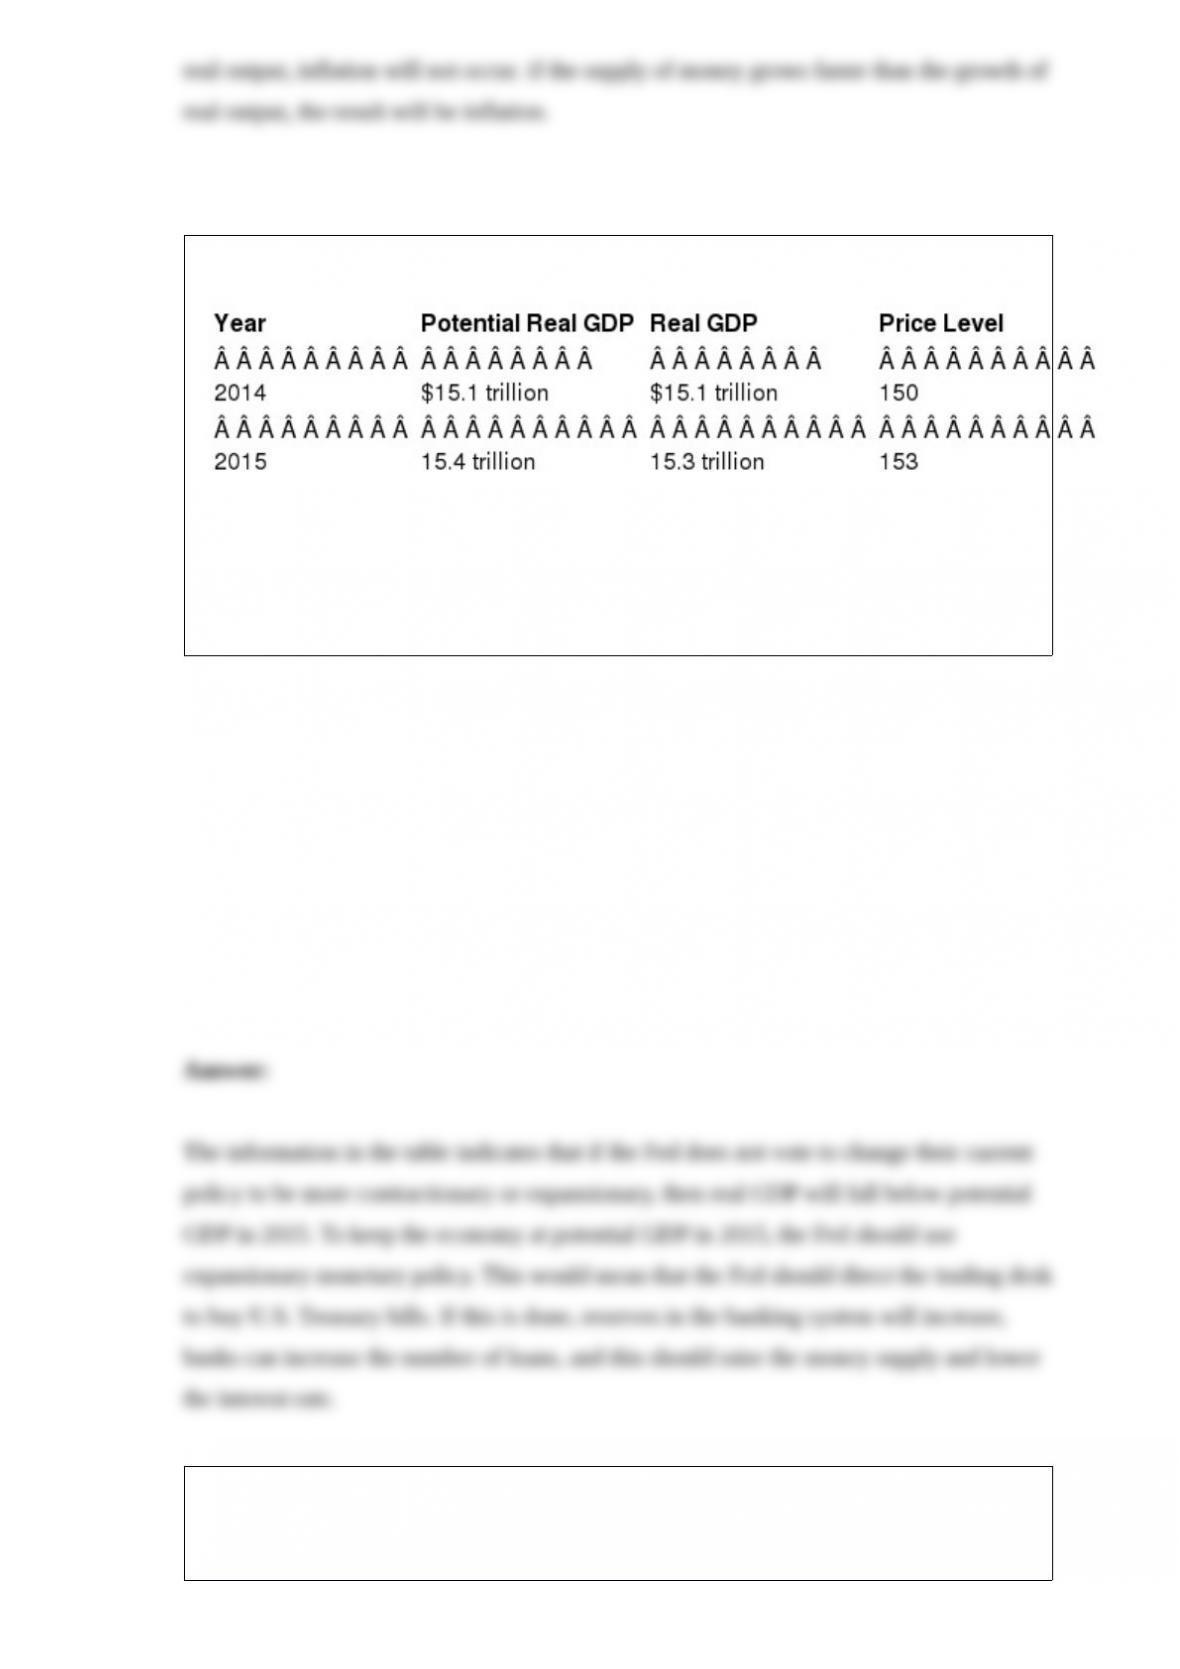
Table 15-4
Refer to Table 15-4. Suppose the following table illustrates the values of real and
potential GDP and the price level, if the Fed does not vote to change their current policy
to be more contractionary or expansionary. If the Fed wants to keep real GDP at its
potential level in 2015, should the Fed use a contractionary or expansionary policy?
How should it conduct open market operations to achieve its goal?
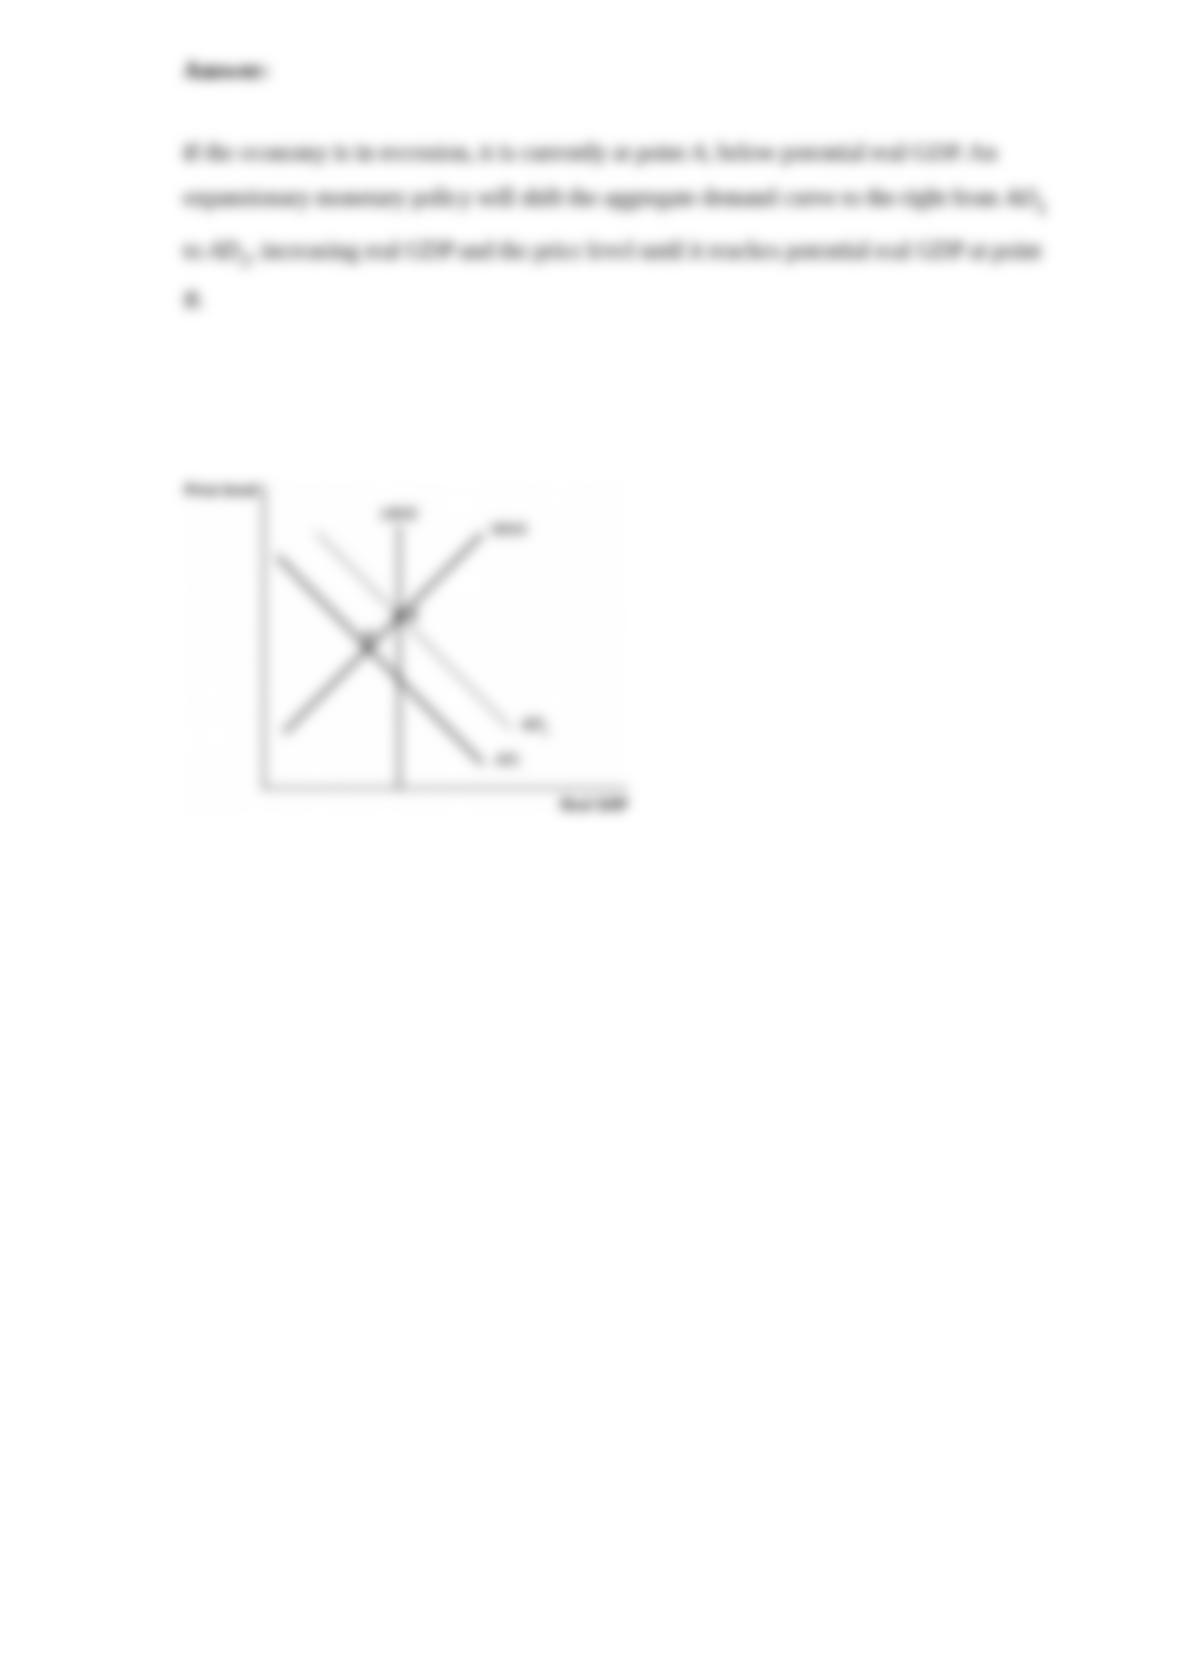
Use a graph to show the effects of an expansionary monetary policy moving an
economy out of recession and to potential real GDP. Explain what happens to aggregate
demand, real GDP, and the price level.