Suppose the price of milk is $2.39 per gallon, and the equilibrium quantity of milk is
100 thousand gallons per day with no tax on milk. Starting from this initial situation,
which of the following scenarios would result in the smallest deadweight loss?
a. The price elasticity of demand for milk is 0.3, the price elasticity of supply for milk is
0.7, and the milk tax amounts to $0.40 per gallon.
b. The price elasticity of demand for milk is 0.2, the price elasticity of supply for milk is
0.5, and the milk tax amounts to $0.30 per gallon.
c. The price elasticity of demand for milk is 0.2, the price elasticity of supply for milk is
0.7, and the milk tax amounts to $0.30 per gallon.
d. The price elasticity of demand for milk is 0.1, the price elasticity of supply for milk is
0.5, and the milk tax amounts to $0.20 per gallon.
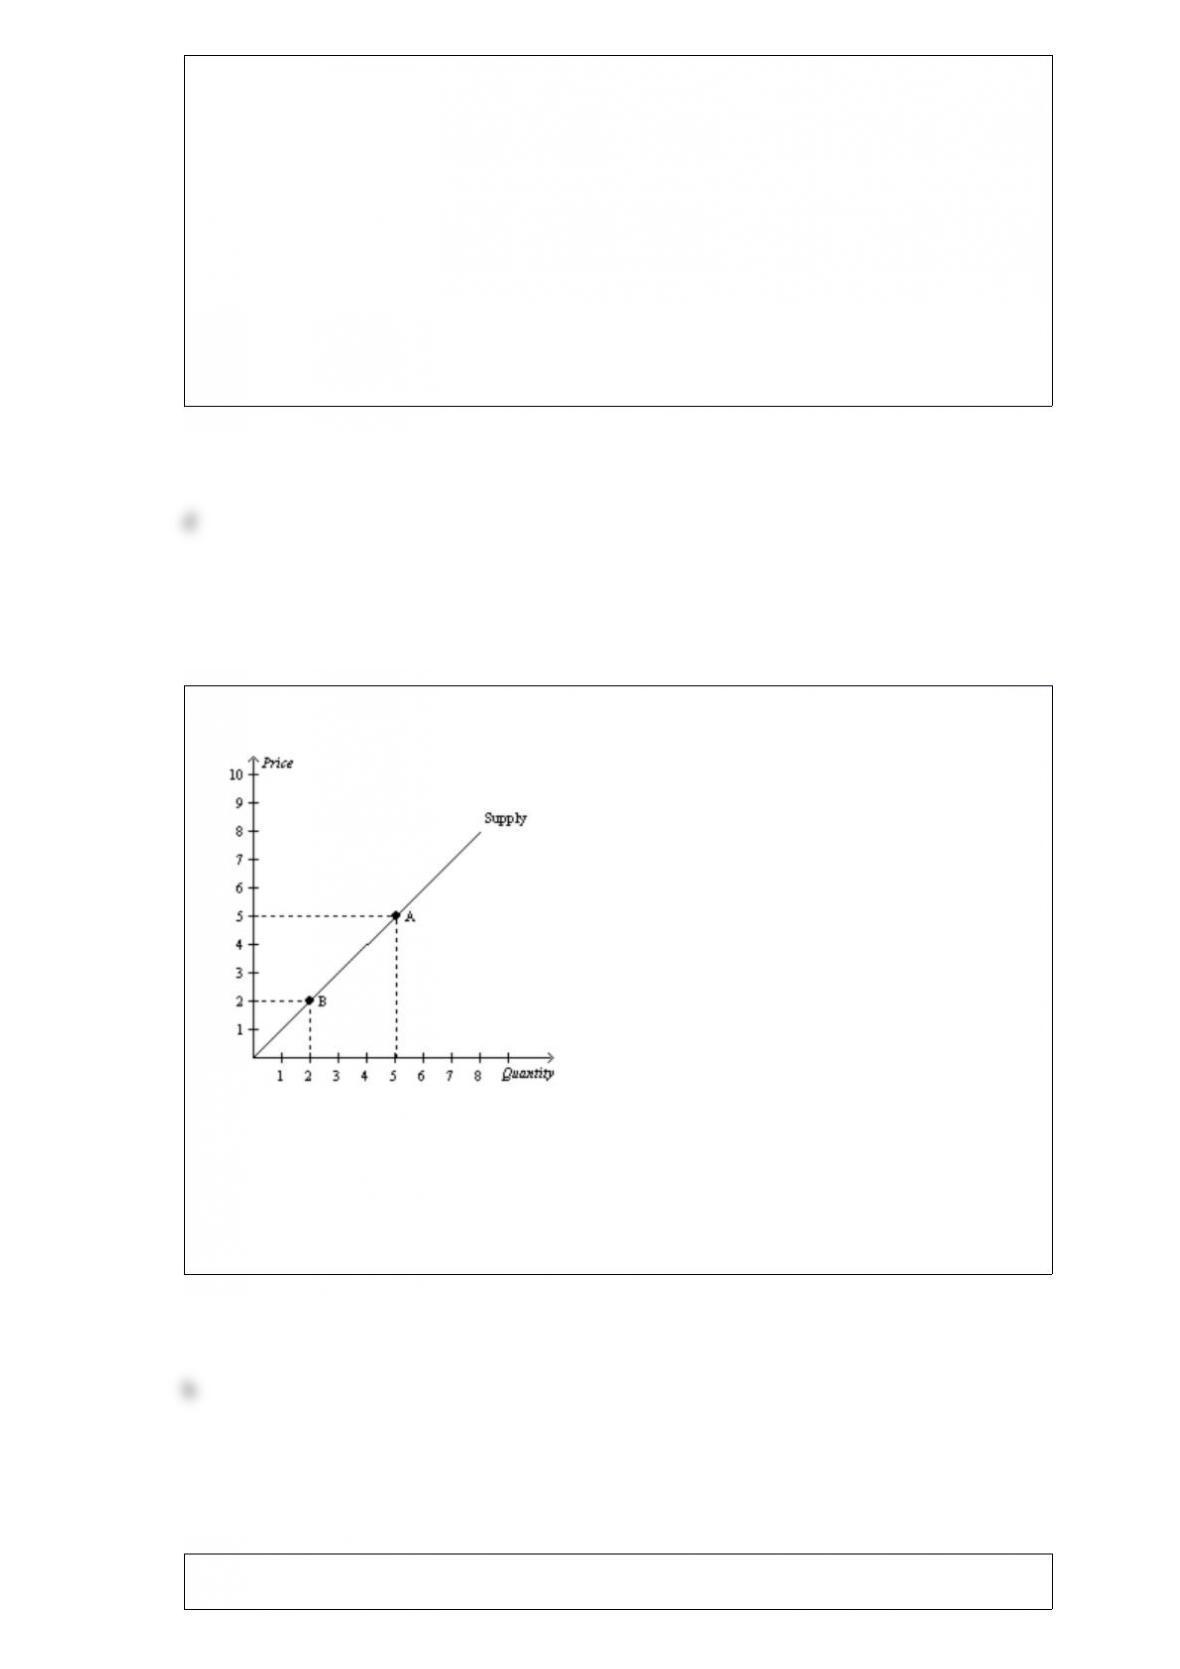
Figure 410
Refer to Figure 410. The movement from Point A to Point B represents a(n)
a. increase in the price.
b. decrease in the quantity supplied.
c. shift in the supply curve.
d. Both a and b are correct.
It costs a meatprocessing company $50,000 to produce 5,000 pounds of steak. The

company’s cost will be $50,009 if it produces an additional pound of steak. If the
company produces 5,001 pounds of steak then
a. its average cost is greater than its marginal cost.
b. its average cost and its marginal cost are equal.
c. its average cost is less than its marginal cost.
d. there is insufficient information to compute average and marginal costs.
Which of these terms are used interchangeably?
a. “goods and services” and “inputs”
b. “goods and services” and “factors of production”
c. “inputs” and “factors of production”
d. “land, labor, and capital” and “goods and services”
If the price of ice cream rose to $30 per gallon, consumers would purchase fewer
gallons of ice cream than if the price were $4 per gallon. If the price of chocolate sauce
fell to $0.50 per can, consumers would purchase more chocolate sauce than if the price
were $5 per can. These relationships illustrate the
a. law of supply.
b. law of demand.
c. difference between normal and inferior goods.
d. difference between substitute and complement goods.
A country has a comparative advantage in a product if the world price is
a. lower than that country’s domestic price without trade.
b. higher than that country’s domestic price without trade.
c. equal to that country’s domestic price without trade.
d. not subject to manipulation by organizations that govern international trade.
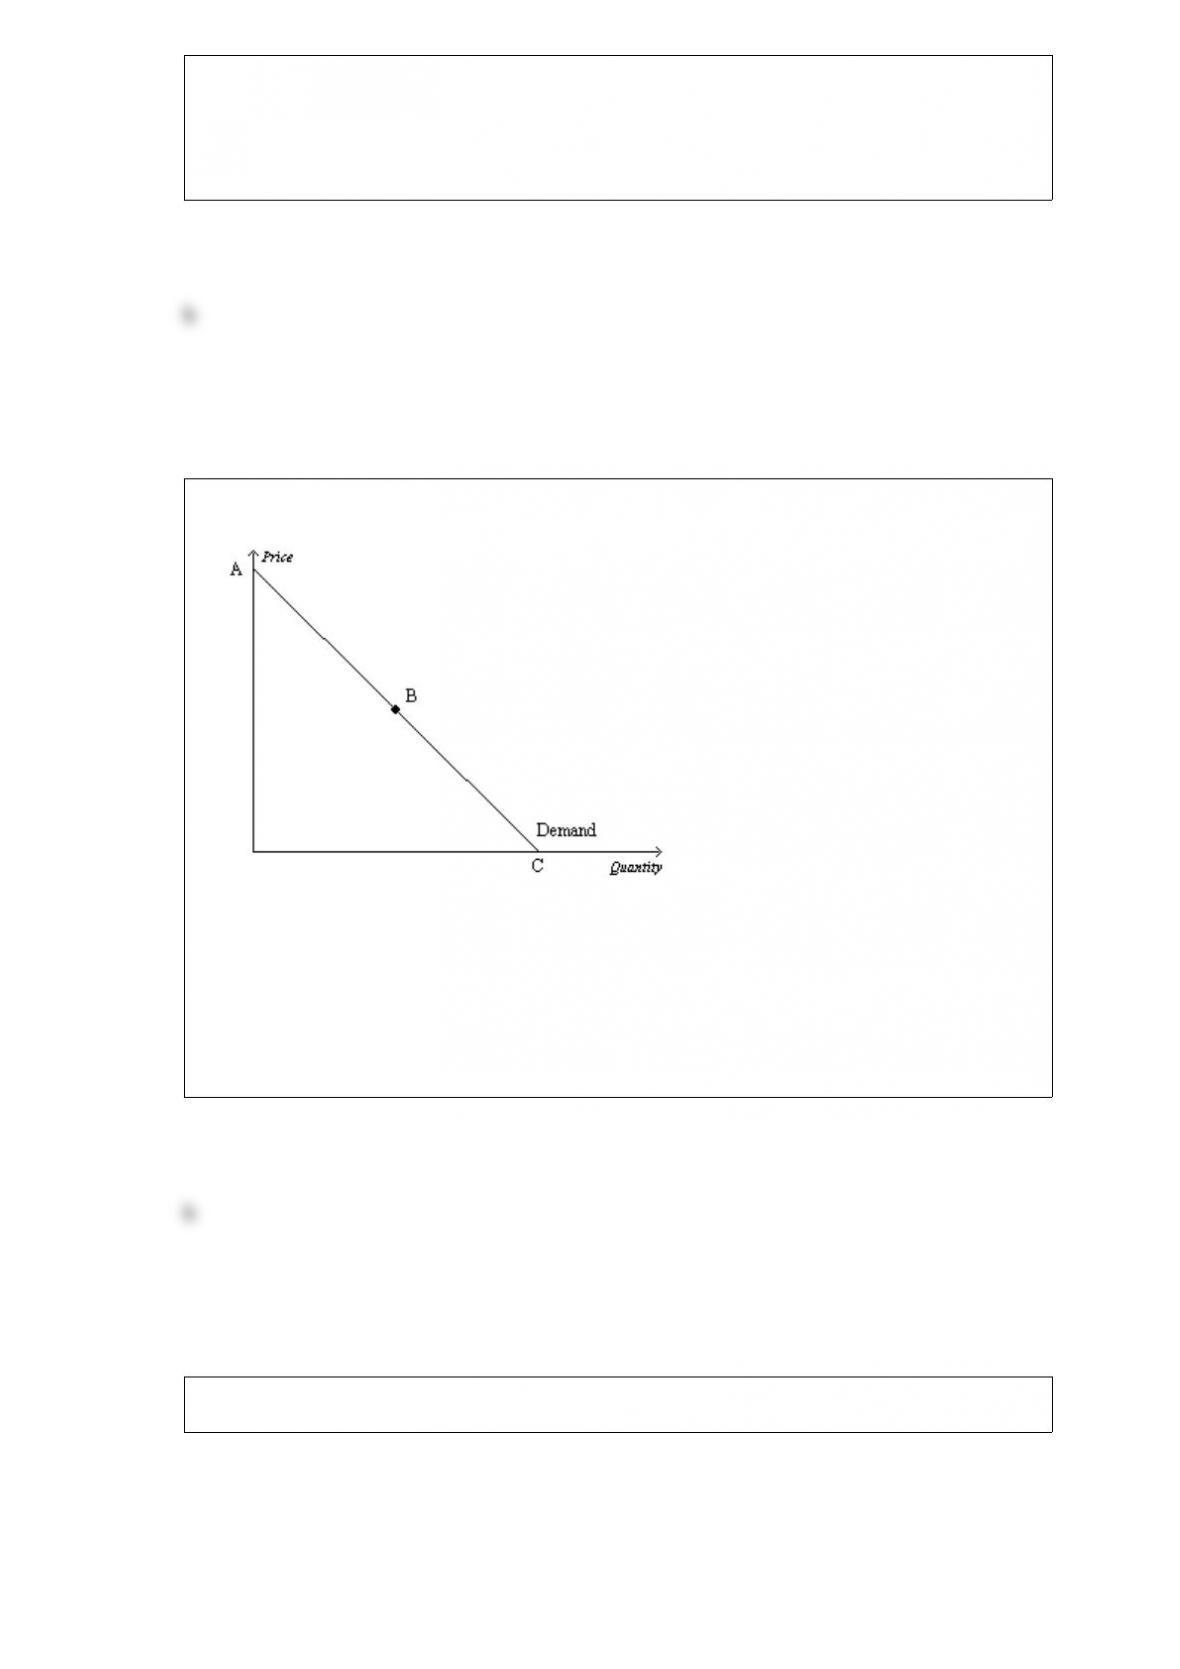
Figure 54
Refer to Figure 54. Assume the section of the demand curve from A to B corresponds
to prices between $8 and $16. Then, when the price changes between $9 and $10,
a. quantity demanded changes proportionately less than the price.
b. quantity demanded changes proportionately more than the price.
c. quantity demanded changes the same amount proportionately as price.
d. the price elasticity of demand equals 1.
Figure 426
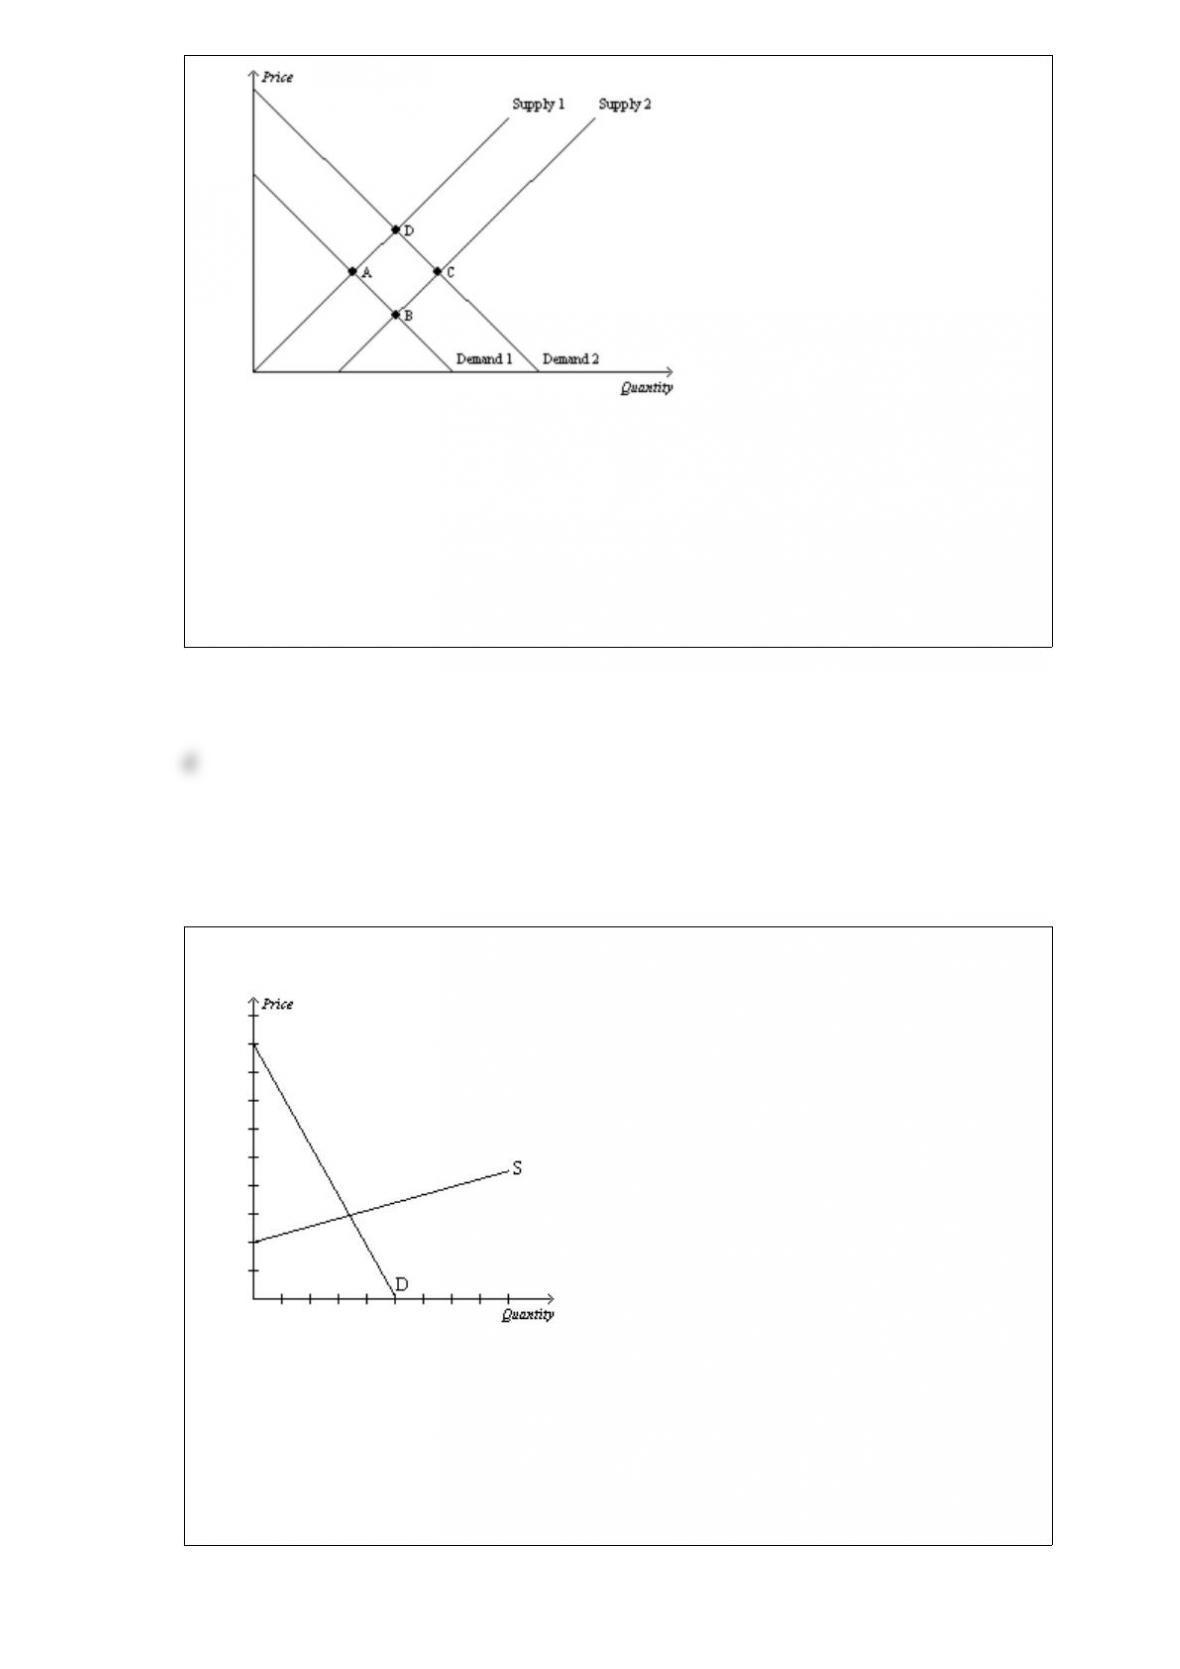
Refer to Figure 426. Which of the following movements would illustrate the effect in
the market for Ramen noodles of a decrease in the incomes of young adults, assuming
that Ramen noodles are an inferior good?
a. Point A to Point B
b. Point C to Point B
c. Point C to Point D
d. Point A to Point D
Figure 423
Refer to Figure 423. In this market for watermelons, a severe drought occurs which
affects the watermelon crop. The equilibrium price
a. increases and the equilibrium quantity decreases.
b. decreases and the equilibrium quantity is ambiguous.
c. and quantity both increase.
d. and quantity both decrease.
Suppose there is an increase in the price of steel. We would expect the supply curve for
steel beams to
a. shift rightward.
b. shift leftward.
c. become flatter.
d. remain unchanged.
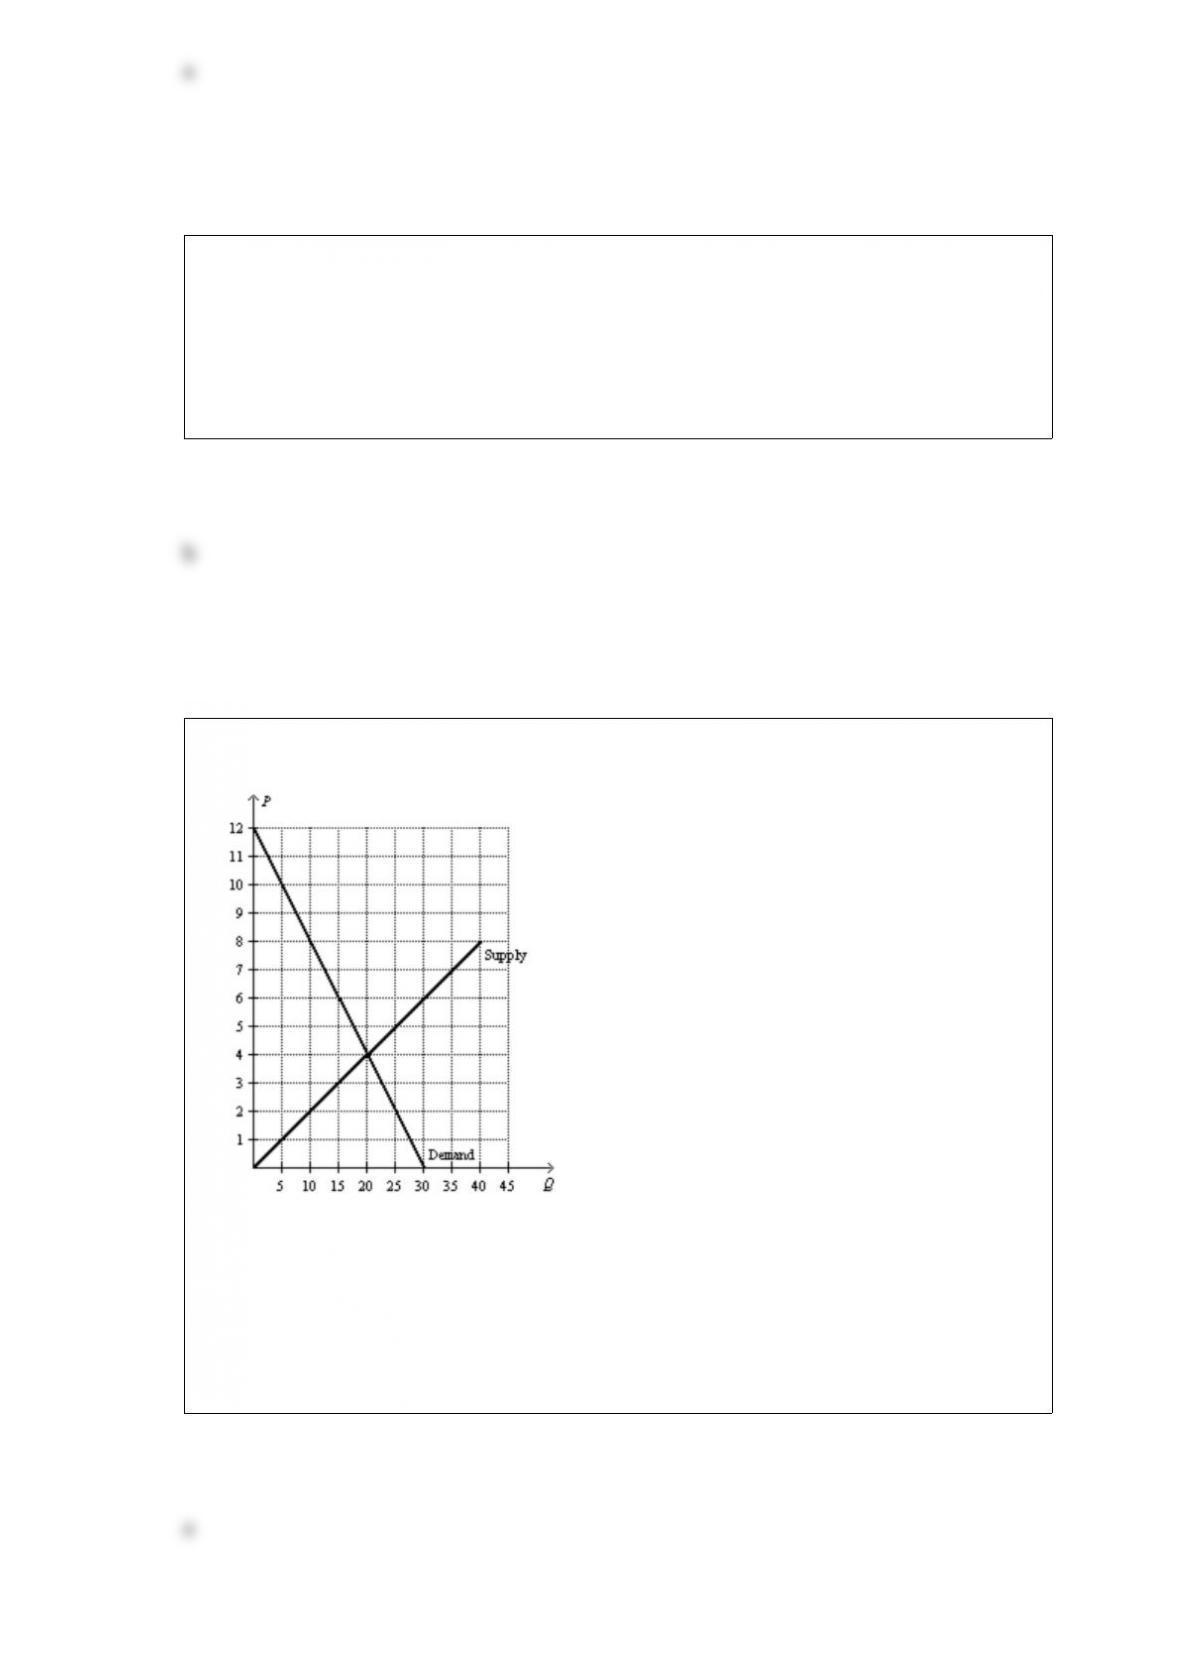
Figure 812
Refer to Figure 812. Suppose a $3 perunit tax is placed on this good. The perunit
burden of the tax on sellers is
a. $1.
b. $2.
c. $3.
d. $4.
“Prices rise when the quantity of money rises rapidly” is an example of a
a. negative economic statement.
b. positive economic statement.
c. normative economic statement.
d. statement that contradicts one of the basic principles of economics.
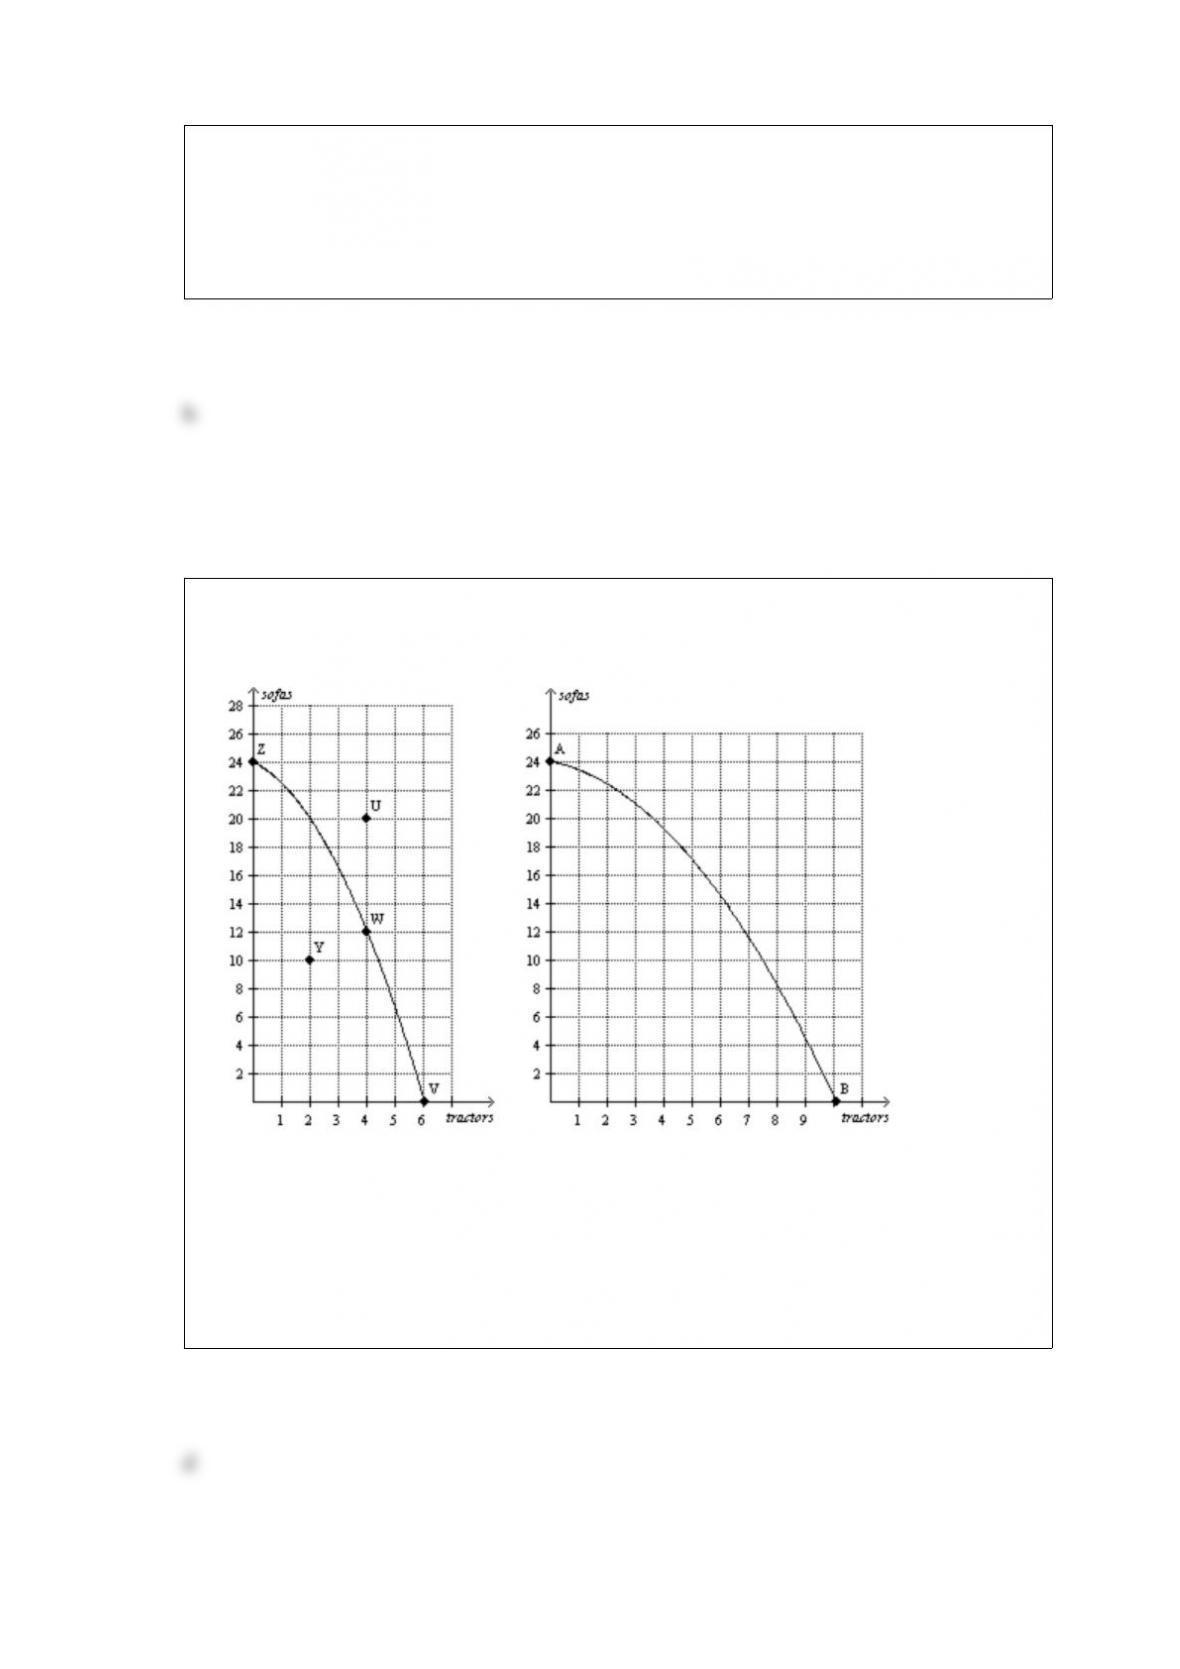
Figure 210
Panel (a) Panel (b)
Refer to Figure 210, Panel (a). The opportunity cost of one sofa is highest when the
economy produces
a. 0 sofas.
b. 12 sofas.
c. 20 sofas.
d. 24 sofas.

The United States has imposed taxes on some imported goods that have been sold here
by foreign countries at below their cost of production. These taxes
a. benefit the United States as a whole, because they generate revenue for the
government. In addition, because the goods are priced below cost, the taxes do not harm
domestic consumers.
b. benefit the United States as a whole, because they generate revenue for the
government and increase producer surplus.
c. harm the United States as a whole, because they reduce consumer surplus by an
amount that exceeds the gain in producer surplus and government revenue.
d. harm the United States as a whole, because they reduce producer surplus by an
amount that exceeds the gain in consumer surplus and government revenue.
Table 710
The following table represents the costs of five possible sellers.
SellerCost
Abby$1,600
Bobby$1,300
Dianne$1,100
Evaline$900
Carlos$800
Refer to Table 710. If the market price is $1,400, the combined total cost of all
participating sellers is
a. $5,700.
b. $1,500.
c. $1,400.
d. $4,100.
Which of the following is not true when the price of a good or service falls?
a. Buyers who were already buying the good or service are better off.
b. Some new buyers, who are now willing to buy, enter the market.
c. The total consumer surplus in the market increases.
d. The total value of purchases before and after the price change is the same.

A tariff is a
a. limit on how much of a good can be exported.
b. limit on how much of a good can be imported.
c. tax on an exported good.
d. tax on an imported good.
Table 328
Barb and Jim run a business that sets up and tests computers. Assume that Barb and Jim
can switch between setting up and testing computers at a constant rate. The following
table applies.
Minutes Needed to Number of Computers Set Up or Tested in a 40Hour Week
Set Up 1 ComputerTest 1 ComputerComputers Set UpComputers Tested
Barb48?5040
Jim30408060
Refer to Table 328. Barb’s opportunity cost of testing one computer is setting up
a. 4/5 computer and Jim’s opportunity cost of testing one computer is setting up 3/4
computer.
b. 4/5 computer and Jim’s opportunity cost of testing one computer is setting up 4/3
computers.
c. 5/4 computers and Jim’s opportunity cost of testing one computer is setting up 3/4
computer.
d. 5/4 computers and Jim’s opportunity cost of testing one computer is setting up 4/3
computers.

Factors of production are
a. used to produce goods and services.
b. also called output.
c. abundant in most economies.
d. assumed to be owned by firms in the circularflow diagram.
Total surplus is represented by the area below the
a. demand curve and above the price.
b. price and up to the point of equilibrium.
c. demand curve and above the supply curve, up to the equilibrium quantity.
d. demand curve and above the horizontal axis, up to the equilibrium quantity.
Which of the following is not a rationing mechanism used by landlords in cities with
rent control?
a. waiting lists
b. race
c. price
d. bribes
Warrensburg is a small college town in Missouri. At the end of August each year, the
market demand for fast food in Warrensburg
a. increases.
b. decreases.
c. remains constant, but we observe a movement downward and to the right along the
demand curve.
d. remains constant, but we observe a movement upward and to the left along the
demand curve.
The following table contains a monthly demand schedule for large, singletopping,
carryout pizzas.
PriceQuantity Demanded
$15A
$2025
If the law of demand applies to these pizzas, then A could be
a. 0.
b. 15.
c. 25.
d. 30.
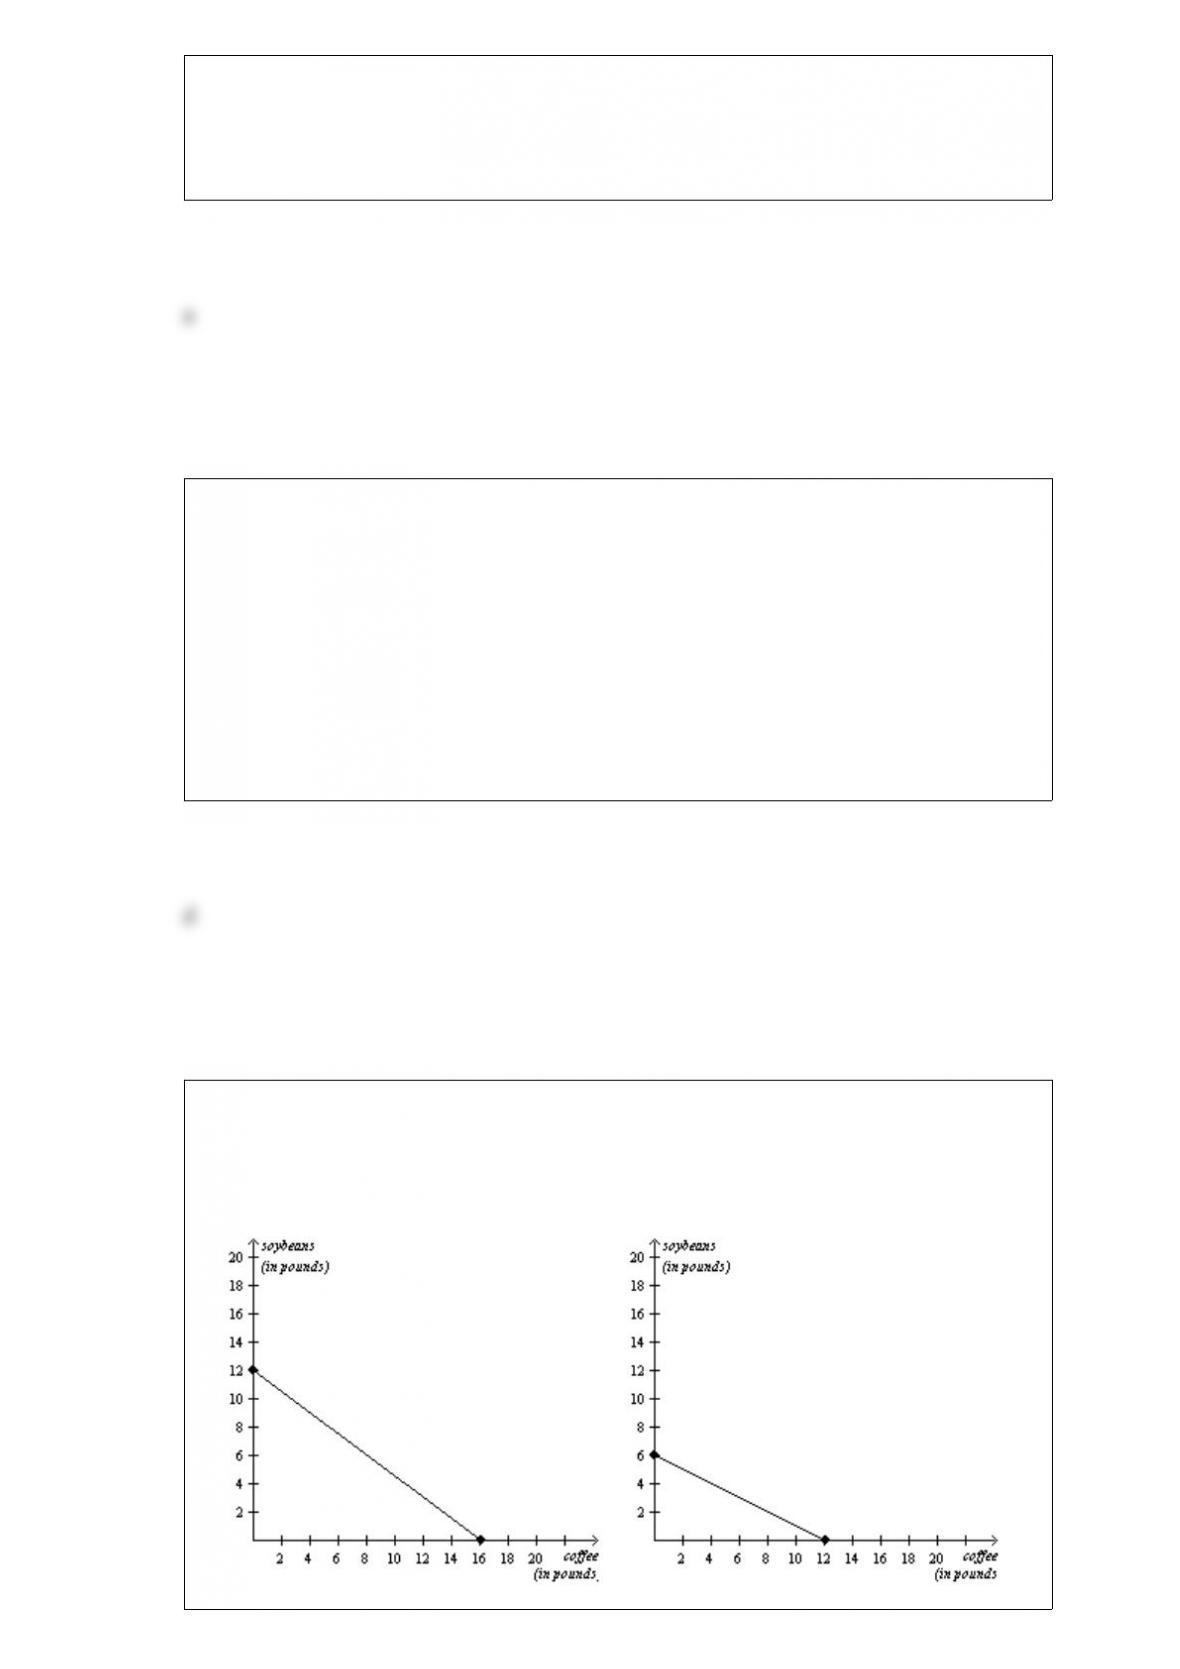
Figure 38
Chile’s Production Possibilities FrontierColombia’s Production Possibilities
Frontier
Refer to Figure 38. If the production possibilities frontiers shown are each for one day
of production, then which of the following combinations of coffee and soybeans could
Chile and Colombia together make in a given day?
a. 4 pounds of coffee and 16 pounds of soybeans
b. 8 pounds of coffee and 15 pounds of soybeans
c. 16 pounds of coffee and 10 pounds of soybeans
d. 24 pounds of coffee and 4 pounds of soybeans
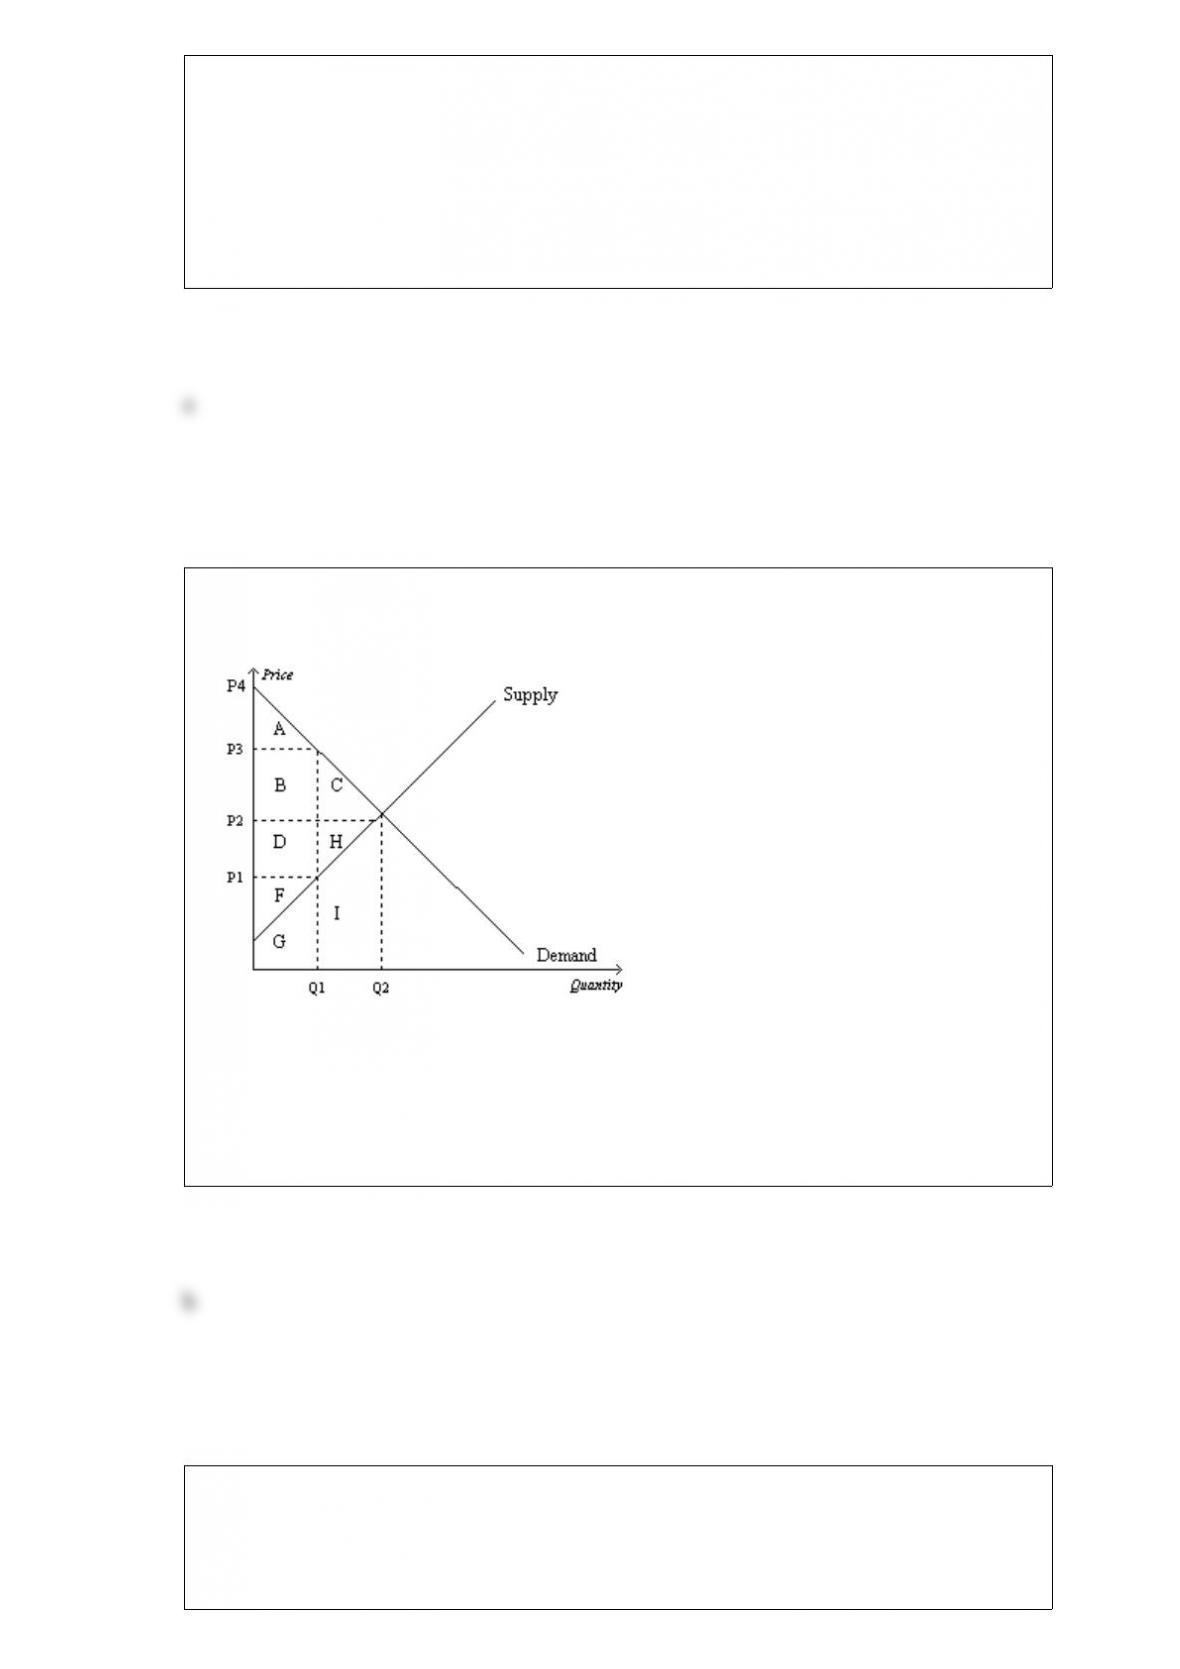
Figure 723
Refer to Figure 723. At equilibrium, consumer surplus is represented by the area
a. A.
b. A+B+C.
c. D+H+F.
d. A+B+C+D+H+F.
Suppose a certain country imposes a tariff on a good. Which of the following results of
the tariff is possible?
a. Consumer surplus decreases by $100; producer surplus increases by $100; and
government revenue from the tariff amounts to $50.

b. Consumer surplus decreases by $200; producer surplus increases by $100; and
government revenue from the tariff amounts to $50.
c. Consumer surplus increases by $100; producer surplus decreases by $200; and
government revenue from the tariff amounts to $50.
d. Consumer surplus decreases by $50; producer surplus increases by $200; and
government revenue from the tariff amounts to $150.
Table 712
The numbers reveal the opportunity costs of providing 10 piano lessons of equal
quality.
SellerCost
Marcia$200
Jan$250
Cindy$350
Greg$400
Peter$700
Bobby$800
Refer to Table 712. The equilibrium market price for 10 piano lessons is $400. What is
the total producer surplus in the market?
a. $0
b. $300
c. $400
d. $700
A production possibilities frontier shifts outward when
a. the economy experiences economic growth.
b. the desires of the economy’s citizens change.
c. at least one of the basic principles of economics is violated.
d. opportunity costs are lessened.

Table 39
Assume that Maya and Miguel can switch between producing mixers and producing
toasters at a constant rate.
Hours Needed to Make 1Amount Produced in 60 Hours
MixerToasterMixerToaster
Maya 631020
Miguel105612
Refer to Table 39. We could use the information in the table to draw a production
possibilities frontier for Maya and a second production possibilities frontier for Miguel.
If we were to do this, measuring toasters along the horizontal axis, then
a. the slope of Maya’s production possibilities frontier would be 2 and the slope of
Miguel’s production possibilities frontier would be 2.
b. the slope of Maya’s production possibilities frontier would be 0.5 and the slope of
Miguel’s production possibilities frontier would be 0.5.
c. the slope of Maya’s production possibilities frontier would be 1.67 and the slope of
Miguel’s production possibilities frontier would be 1.67.
d. the slope of Maya’s production possibilities frontier would be 0.6 and the slope of
Miguel’s production possibilities frontier would be 0.6.
Yi and Avik are both economists. Yi thinks that taxing consumption, rather than income,
would result in higher household saving because income that is saved would not be
taxed. Avik does not think that household saving would respond much to a change in
the tax laws. In this example, Yi and Avik
a. hold different normative views about the tax system.
b. disagree about the validity of a positive theory.
c. have a fundamental misunderstanding of the tax system.
d. More than one of the above is correct.
