An isocost line shows
A) all the possible combinations of two inputs that a firm can use to produce its output.
B) all the possible combinations of two inputs a firm can use that have the same total
cost.
C) all the possible combinations of two inputs a firm can use that have the same
marginal cost.
D) all the possible combinations of two inputs with constant returns to scale.
The slope of the consumption function is equal to
A) the change in consumption divided by the change in disposable income.
B) the change in consumption divided by the change in personal income.
C) the change in disposable income divided by the change in consumption.
D) the change in national income divided by the change in consumption.
Erin and Deidre, two residents in Ithaca, New York, are planning a trip to Boston. Erin,
the sales manager for a large retailer, has to attend a business meeting. Deidre, a college
student on vacation, is planning a leisurely trip to visit friends and relatives. Whose
demand curve for air travel is likely to be more elastic?
A) Erin
B) Deidre
C) There is no difference in their price elasticities of demand.
D) The elasticity of the demand curves for Erin and Deidre cannot be determined
without more information.
Trina’s Tropical Fish Store sells goldfish for $2 each and angelfish for $10 each. What
is the opportunity cost of buying a goldfish?
A) 5 angelfish
B) 1/5 of an angelfish
C) $10
D) $2
The fraction of an industry’s sales that are accounted for by the largest firms is called
A) the four-firm competition ratio.
B) the four-firm concentration ratio.
C) the four-firm industry ratio.
D) the four-firm oligopoly ratio.
Gross domestic product in the economy is measured by the
A) total number of goods and services produced in the economy.
B) dollar value of all final goods and services produced in the economy.
C) total number of goods produced in the economy.
D) total number of services produced in the economy.
If we take into account transfer payments (TR) when we derive the saving and
investment relationship, the saving and investment equation becomes
A) S = I + NFI.
B) S + TR = I + NFI.
C) S = I + NFI + TR.
D) S = I + NX – TR.
In 2013, Ford Motor Company’s sales were rising. These events were caused by
A) an economic recession.
B) an economic expansion.
C) an increase in advertising.
D) improving quality of service.
Suppose the GDP deflator in the United States is 125 and the GDP deflator in Japan is
100. Also assume the United States has trade barriers on Japanese goods in the form of
quotas. What does this imply about the exchange rate of yen per dollar under the theory
of purchasing power parity in the long run?
A) The exchange rate of yen per dollar will be equal to 1.25.
B) The exchange rate of yen per dollar will be greater than 0.8.
C) The exchange rate of yen per dollar will be equal to 0.8.
D) The exchange rate of yen per dollar will be less than 0.8.
Figure 15-2
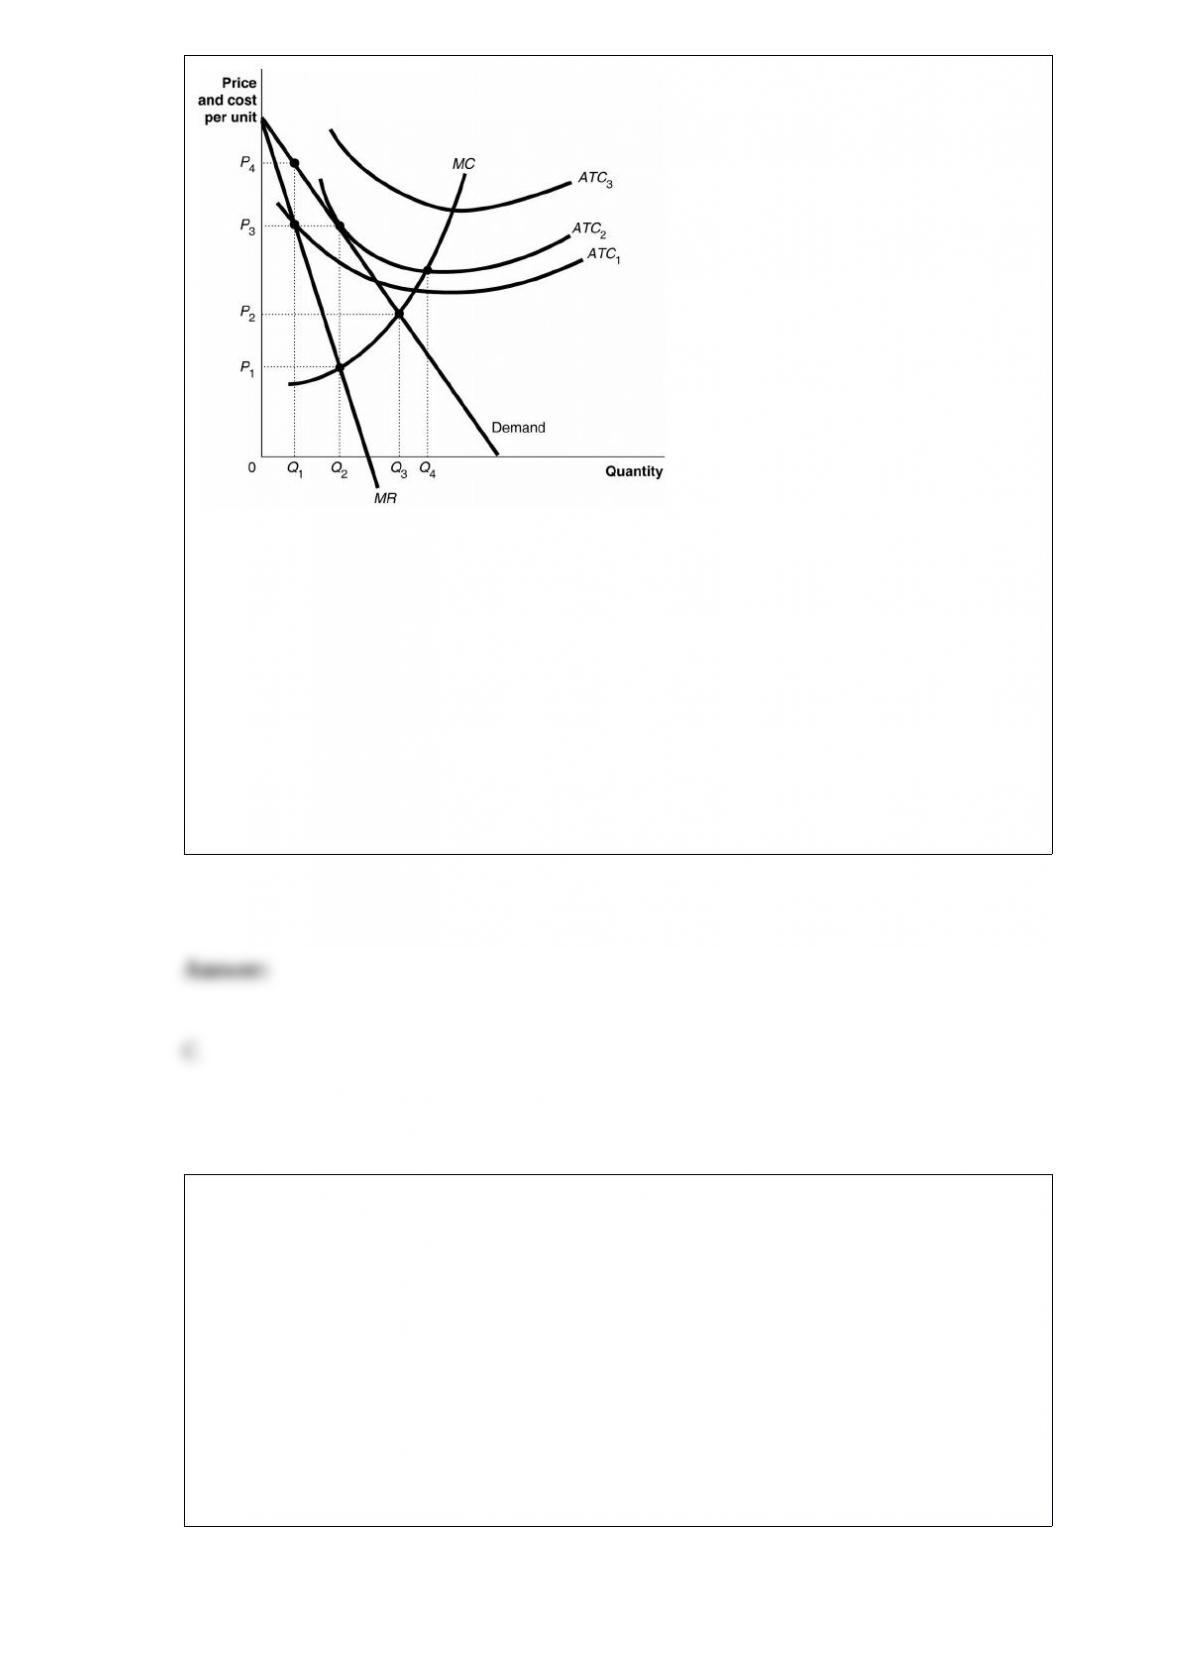
Figure 15-2 above shows the demand and cost curves facing a monopolist. If the firm’s
average total cost curve is ATC1, the firm will
A) suffer a loss.
B) break even.
C) make a profit.
D) face competition.
Mandatory motorcycle helmet laws are designed to reduce the severity of injuries
resulting from motorcycle involvement in traffic accidents. In this sense, these
mandatory helmet laws are reducing ________ of risky behavior.
A) positive externalities
B) negative externalities
C) the private benefit
D) the social benefit
The Federal Open Market Committee consists of the seven members of the ________,
the president of the Federal Reserve Bank of New York, and ________.
A) Federal Reserve’s Board of Governors; four members of the Council of Economic
Advisors
B) Federal Reserve’s Board of Governors; four presidents from the other 11 Federal
Reserve banks
C) Council of Economic Advisors; four presidents from the 11 Federal Reserve banks
D) Council of Economic Advisors; four members of the U.S. Banking Committee
A very large number of small sellers who sell identical products imply
A) a multitude of vastly different selling prices.
B) a downward sloping demand for each seller’s product.
C) the inability of one seller to influence price.
D) chaos in the market.
Refer to Figure 18-1. Area E+H represents
A) the portion of sales tax revenue borne by consumers.
B) the portion of sales tax revenue borne by producers.
C) the excess burden of the sales tax.
D) sales tax revenue collected by the government.