
The United States
A) currently is one of the most corrupt countries.
B) has never had a significant problem with corruption.
C) had a significant problem with corruption in the 1930s.
D) currently ranks among the least corrupt countries.
Which of the following would cause both the equilibrium price and equilibrium
quantity of oysters (assume that oysters are a normal good) to decrease?
A) an increase in consumer income
B) an oil spill that sharply reduces oyster output
C) a decrease in consumer income
D) a technological advancement in the production of oysters
Table 1-1
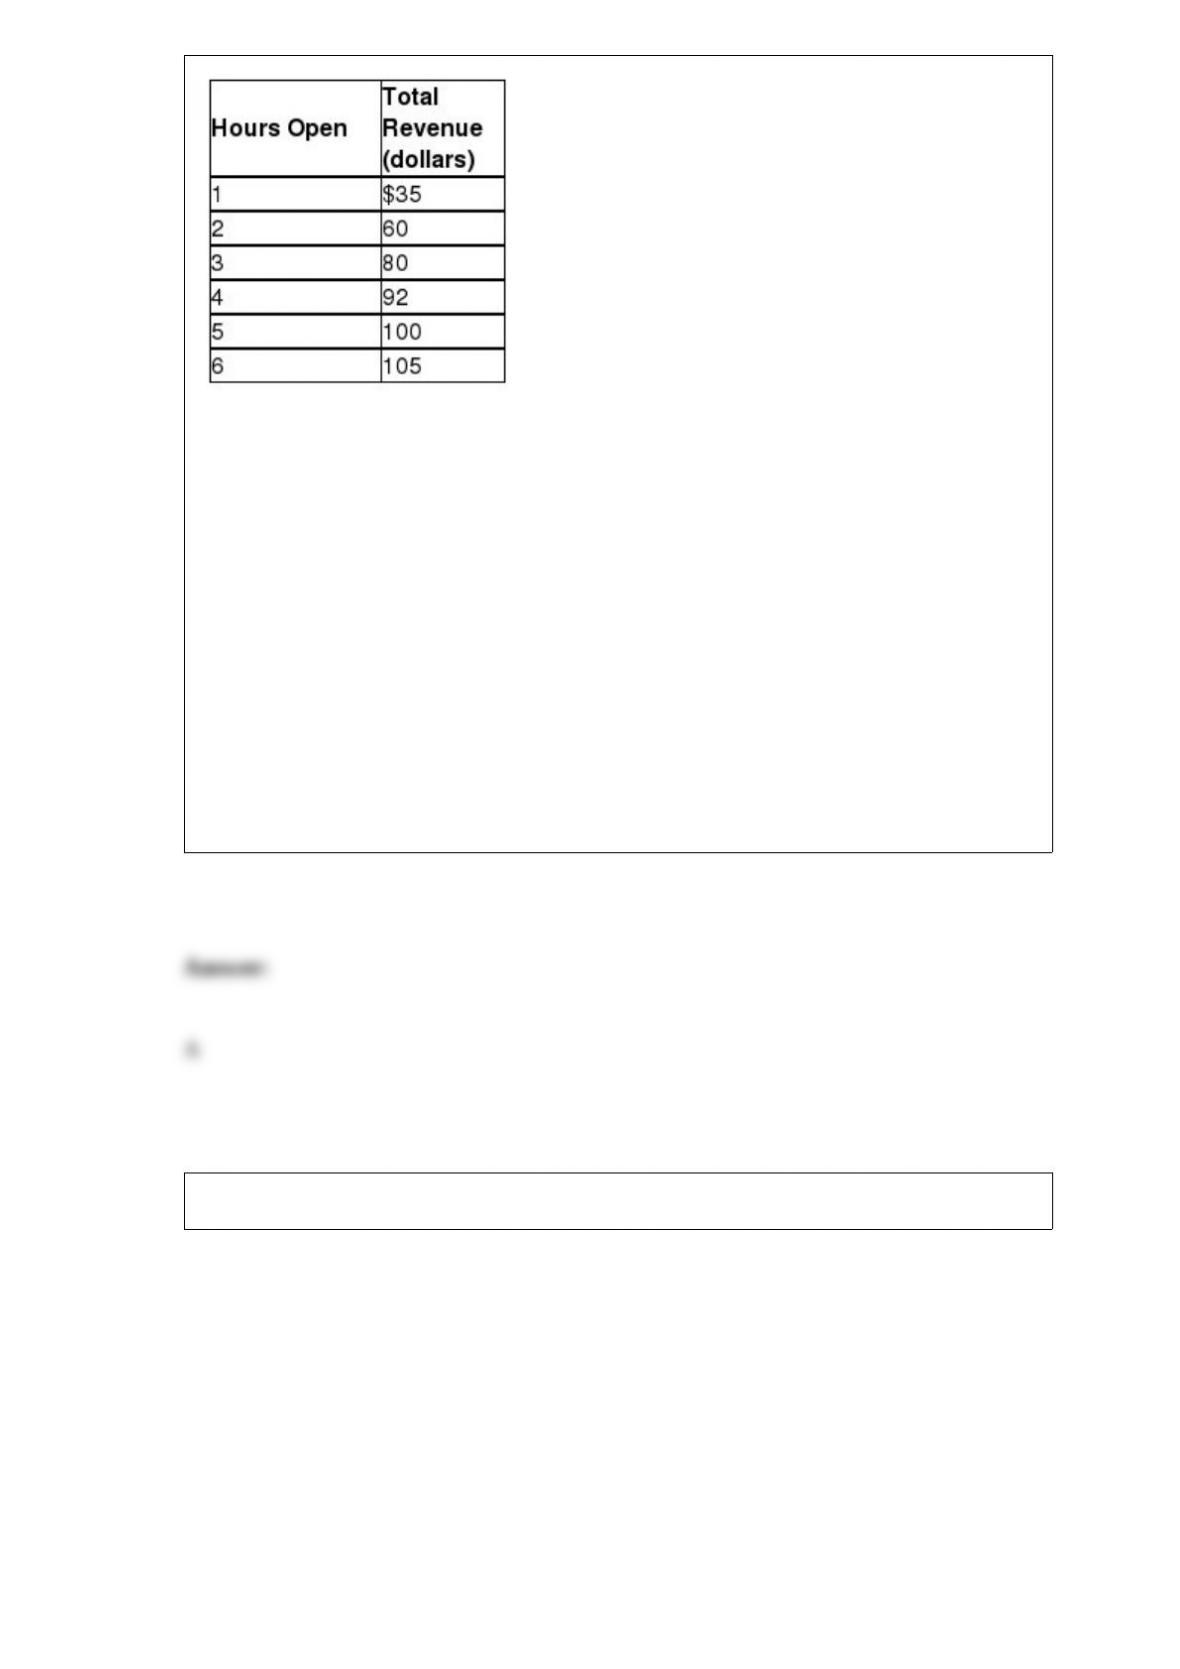
Eva runs a small bakery in the village of Roggerli. She is debating whether she should
extend her hours of operation. Eva figures that her sales revenue will depend on the
number of hours the bakery is open as shown in the table above. She would have to hire
a worker for those hours at a wage rate of $12 per hour.
Refer to Table 1-1. What is Eva’s marginal cost if she decides to stay open for two
hours instead of one hour?
A) $12
B) $24
C) $36
D) $71
Figure 3-7
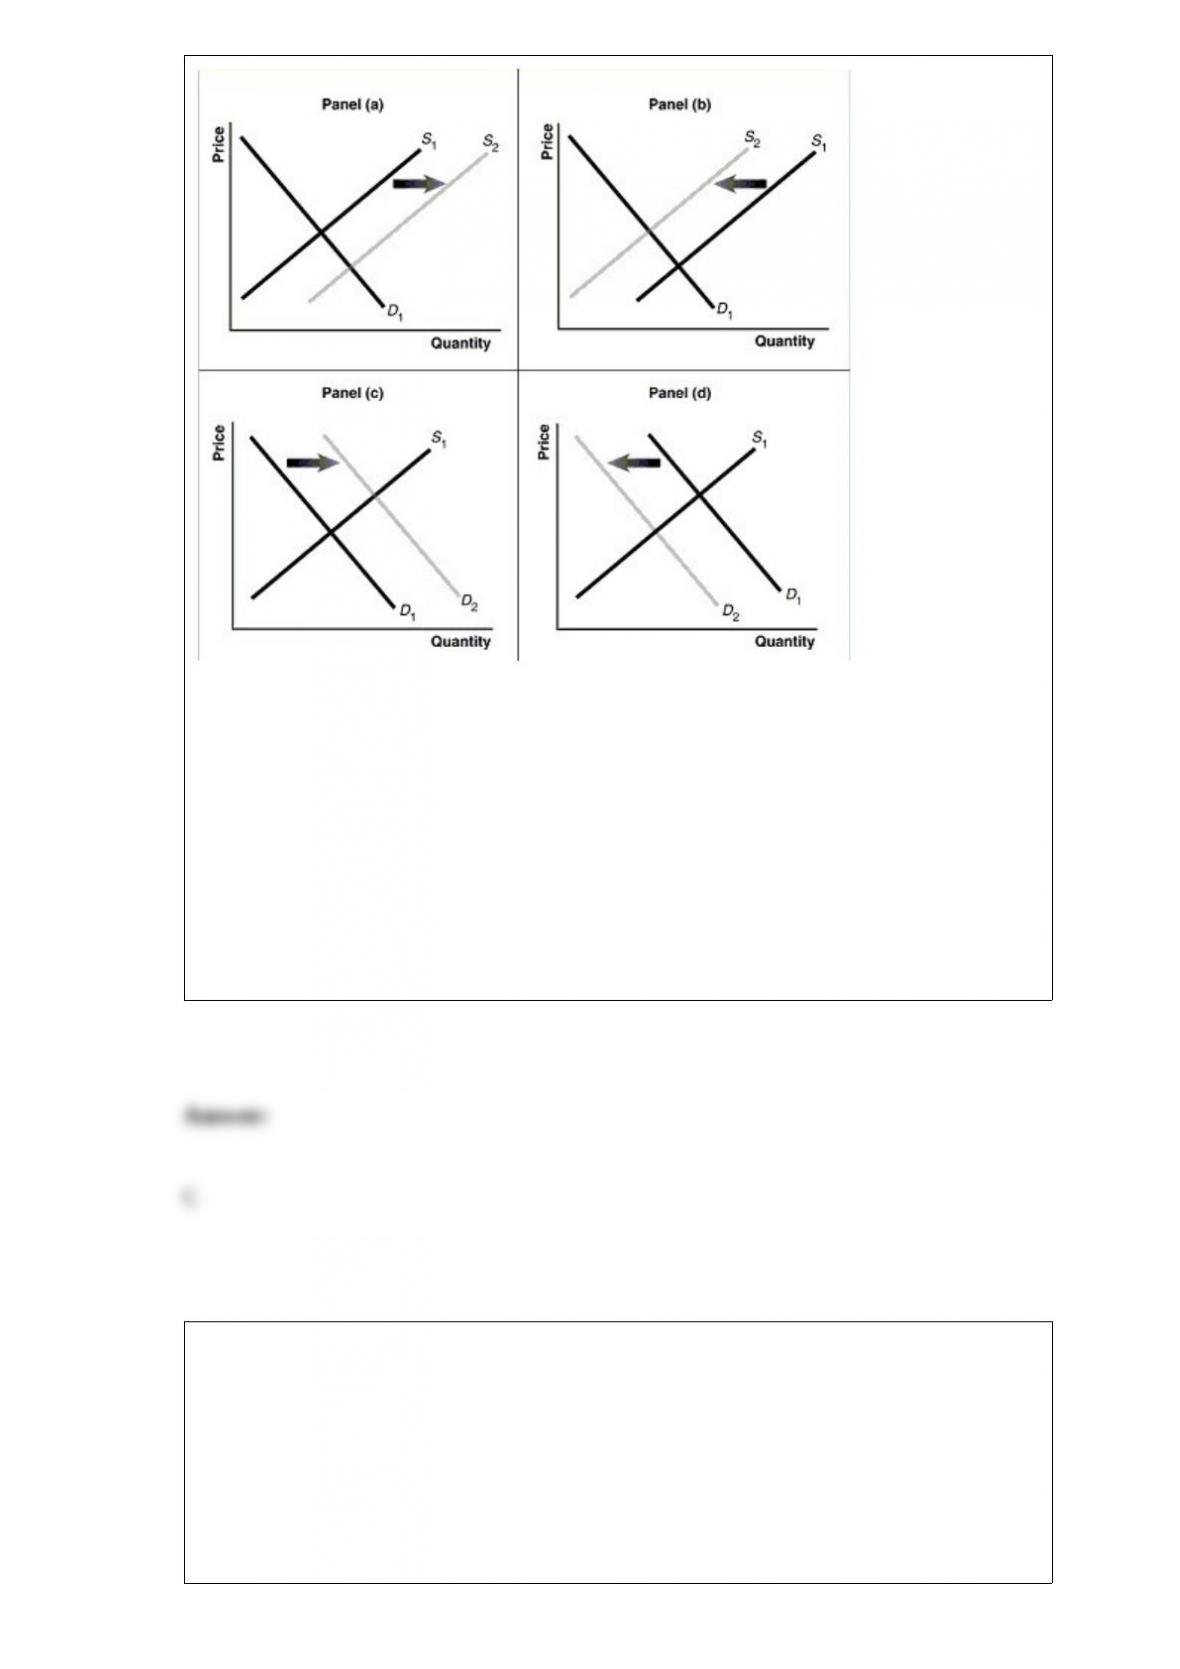
Refer to Figure 3-7. Assume that the graphs in this figure represent the demand and
supply curves for coffee. What happens in this market if buyers expect the price of
coffee to rise?
A) Panel (a)
B) Panel (b)
C) Panel (c)
D) Panel (d)
The area above the market supply curve and below the market price
A) is equal to the total amount of producer surplus in a market.
B) is equal to the marginal cost of the last unit produced.
C) is equal to the total amount of economic surplus in a market.

D) is equal to the total cost of production.
Which of the following countries is not one of the top three exporting countries in the
world?
A) China
B) Germany
C) South Korea
D) the United States
Given the equations for C, I, G, and NX below, what is the marginal propensity to
consume?
C = 1,000 + 0.8Y
I = 1,500
G=1,250
NX = 100
A) 0.2
B) 0.8
C) 1.8
D) 10
In an “underground economy,” the production of goods and services
A) is not measured or included in GDP.
B) is not measured but is included in GDP.
C) is measured and included in GDP.
D) is usually too insignificant to be included in GDP.
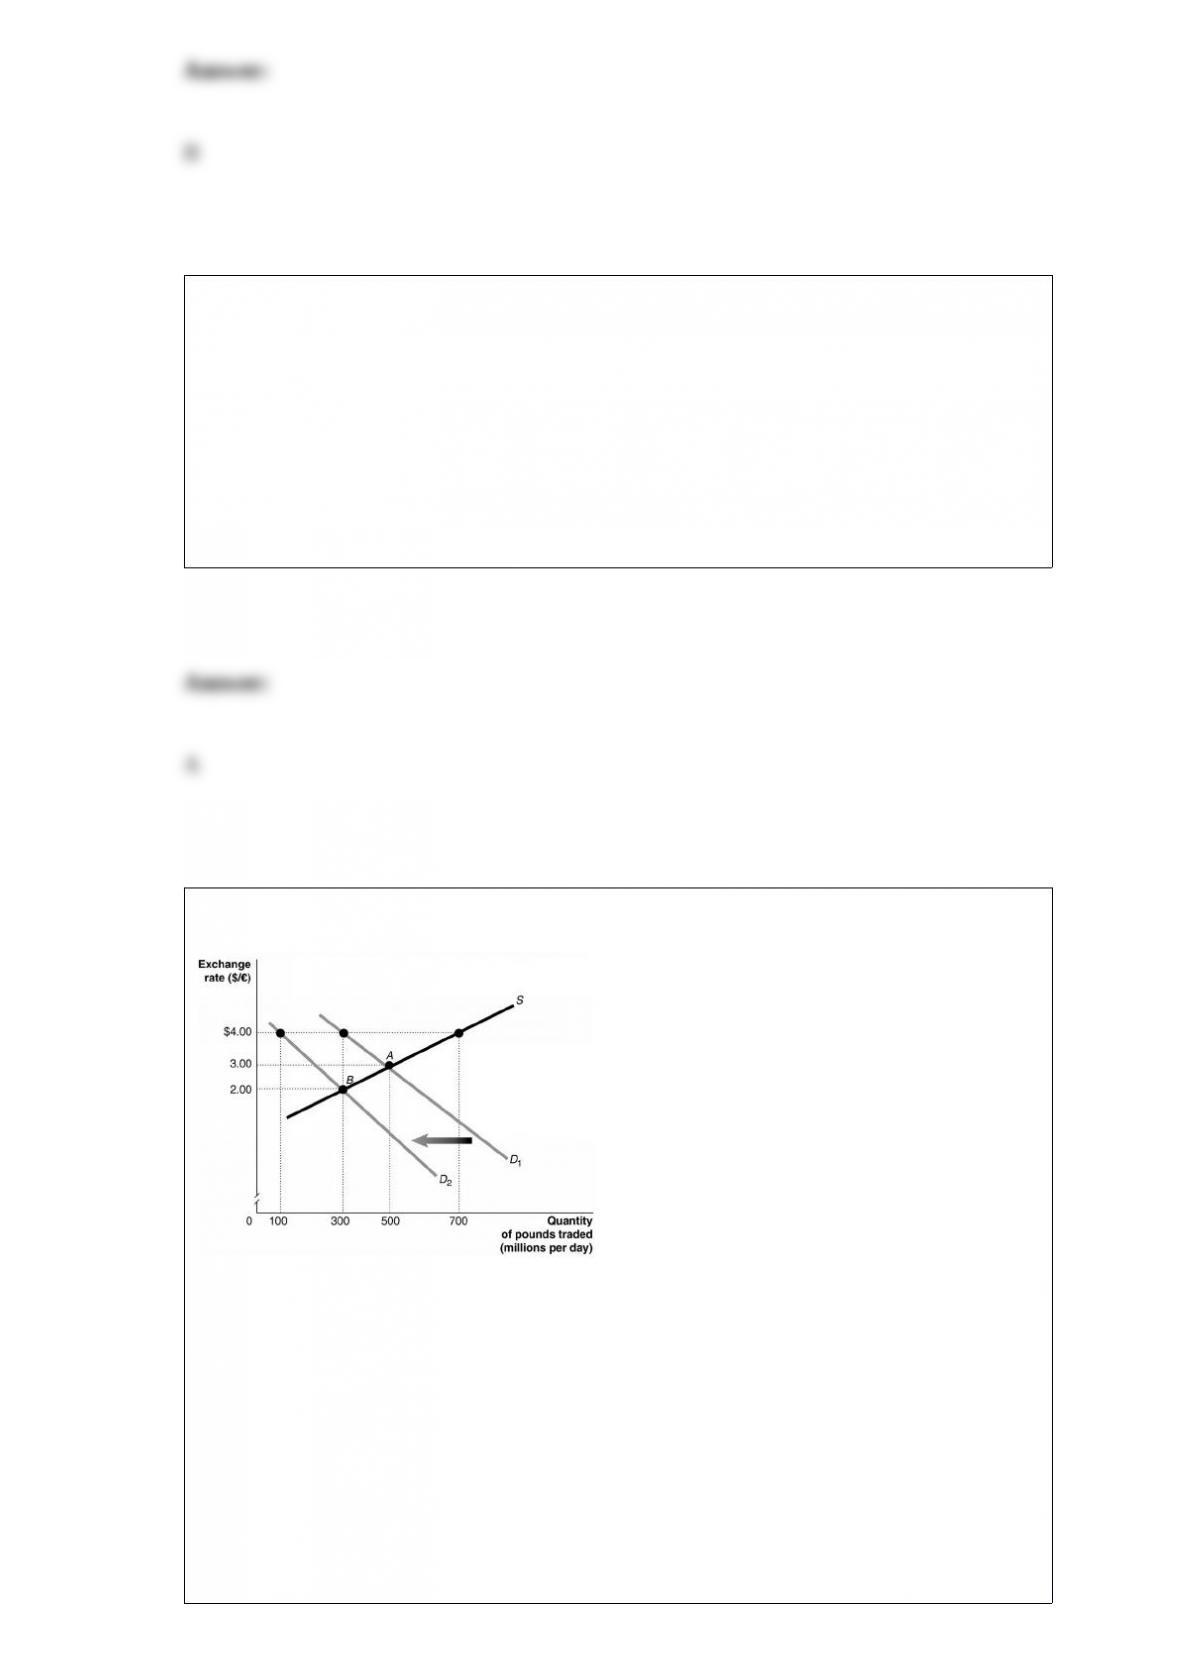
Figure 19-4
Refer to Figure 19-4. The equilibrium exchange rate is at A, $3/pound. Suppose the
British government pegs its currency at $4/pound. Speculators expect that the value of
the pound will drop and this shifts the demand curve for pounds to D2. After the shift,
A) there is a shortage of pounds equal to 600 million.
B) there is a surplus of pounds equal to 400 million.
C) there is a shortage of pounds equal to 400 million.
D) there is a surplus of pounds equal to 600 million.
E) there is a shortage of pounds equal to 200 million.
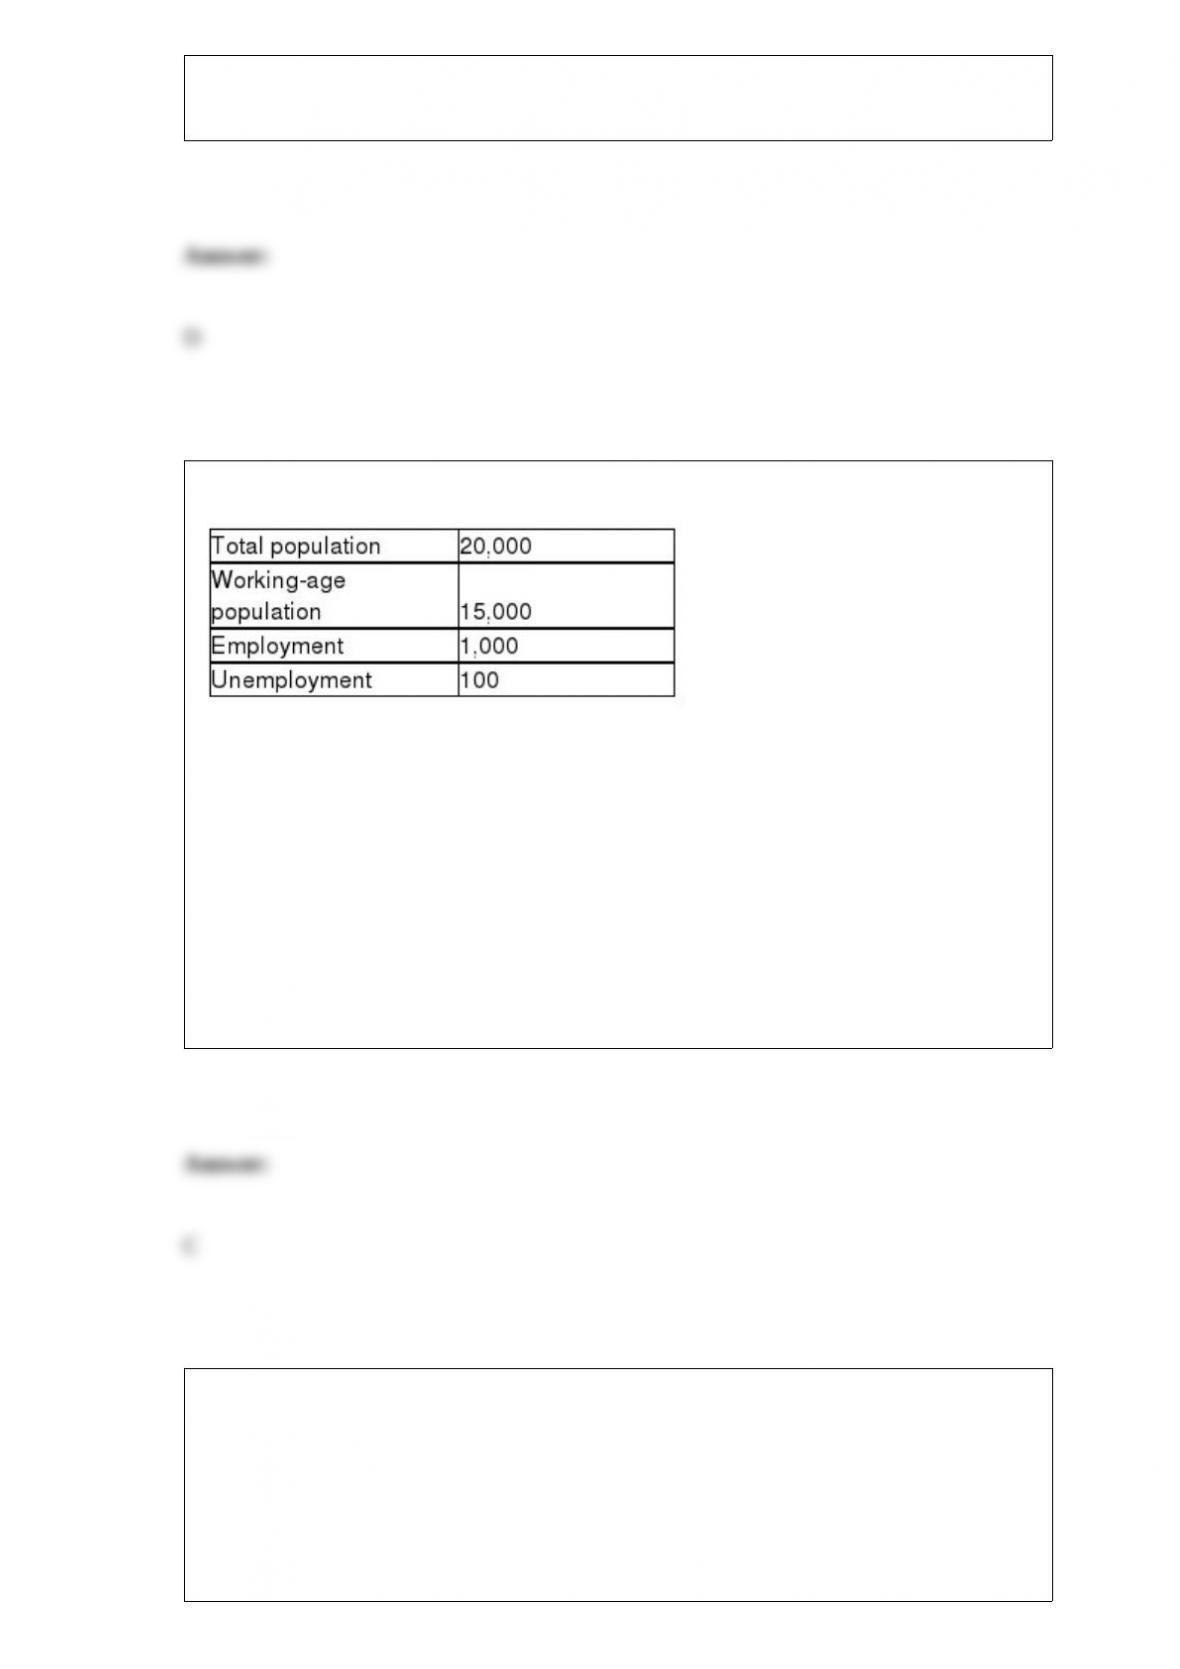
Table 9-1
Consider the data above for a simple economy.
Refer to Table 9-1. The labor force participation rate for this simple economy equals
A) (1,000/1,100) x 100.
B) (1,000/15,000) x 100.
C) (1,100/15,000) x 100.
D) (1,100/20,000) x 100.
Each point on a demand curve shows
A) the willingness of consumers to purchase a product at different prices.
B) the consumer surplus received from purchasing a given quantity of a product.
C) the economic surplus received from purchasing a given quantity of a product.
D) the legally determined maximum price that sellers may charge for a given quantity
of a product.
Which of the following indicates that the U.S. economy has become more stable since
1950?
A) longer recessions
B) shorter expansions
C) less severe fluctuations in real GDP
D) All of the above indicate that the U.S. economy has become more stable since 1950.