The marginal product of labor is calculated using the formula
A) L/Q.
B) L/Q.
C) Q/L.
D) Q/L.
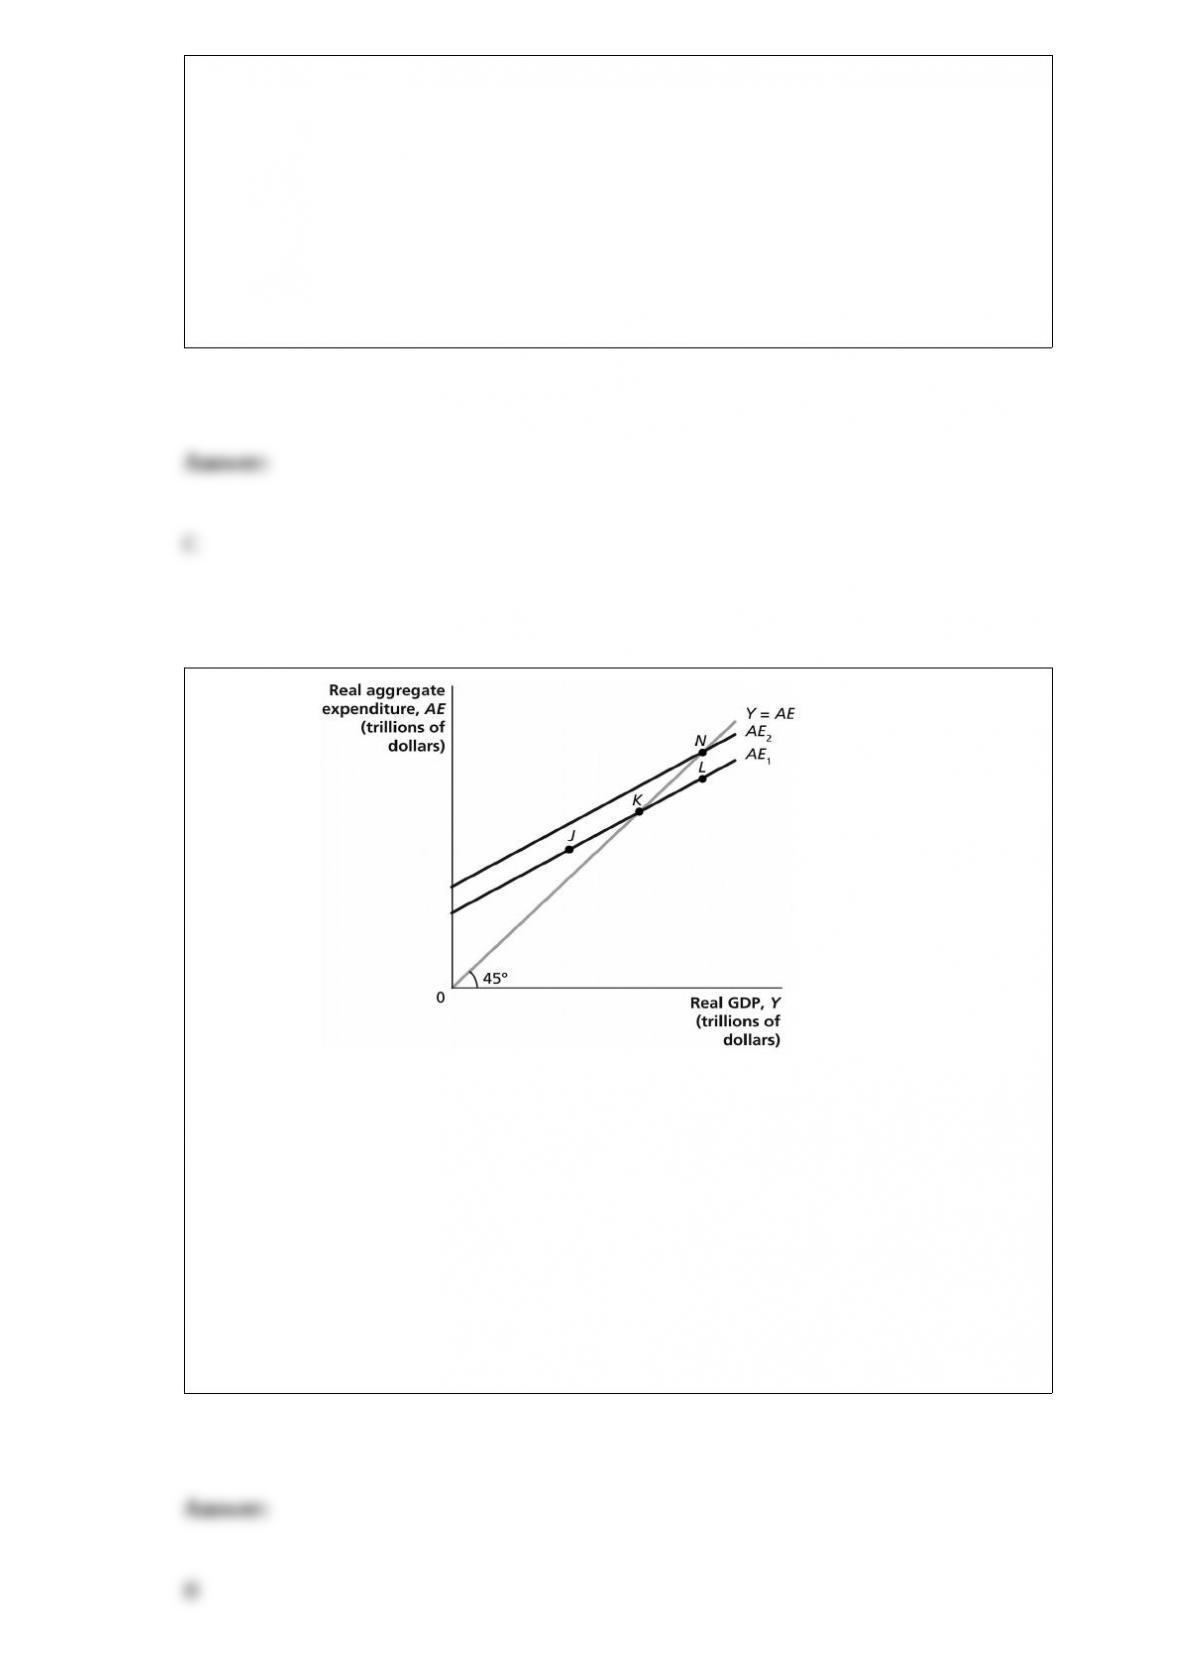
Figure 12-2
If the U.S. economy is currently at point K, which of the following could cause it to
move to point N?
A) The price level in the United States rises relative to the price level in other countries.
B) Congress passes investment tax incentives.
C) The interest rate rises.
D) Household wealth declines.

Arnold Marion, a first-year economics student at Fazer College, was given an
assignment to find an example of price discrimination and present it to his class. When
asked for his example Arnold said “I went to a Milwaukee Brewers baseball game with
my cousin last week. We paid $25 each for our seats in left field. My aunt and uncle
paid $50 each for their tickets; they sat five rows behind the first base dugout. This is an
example of price discrimination since we paid different prices for the same product, and
the differences were not due to differences in costs.” How would Arnold’s economics
instructor assess Arnold’s example?
A) He would agree with Arnold that he had found an example of price discrimination,
but would add that arbitrage would occur if ticket scalpers sold Brewers tickets for
more than the prices Arnold and his uncle paid.
B) He would disagree with Arnold’s example because the $25 seats and the $50 seats
were not the same products.
C) He would agree with Arnold that he had found an example of price discrimination
and would explain that the elasticity of demand for Brewers tickets is different for
Arnold and his uncle.
D) He would disagree with Arnold’s example because there were differences in
transactions costs for the $50 tickets and the $25 tickets.
The money demand curve, against possible levels of interest rates, has a
A) positive slope.
B) negative slope.
C) zero slope.
D) positive slope for low levels of money demand, a negative slope for high levels of
money demand.
Measures of poverty (for example, the poverty line) and the distribution of income (for
example, the Lorenz curve and the Gini coefficient) are misleading for which of the
following two reasons?
A) First, these measures do not take into account income mobility over time. Second,
these measures ignore the effects of government programs meant to reduce poverty.
B) First, none of these measures are adjusted for inflation. Second, they do not measure
income on a per capita basis.
C) First, these measures fail to include the income U.S. citizens earn working for
foreign firms that have operations located in the United States. Second, these measures
fail to include income foreign citizens earn working for U.S. firms that have operations
in foreign countries.
D) First, these measures fail to include dividend and interest income earned on stocks
and bonds. Second, these measures fail to include the value of goods and services
citizens make for their own consumption that are not sold in markets.
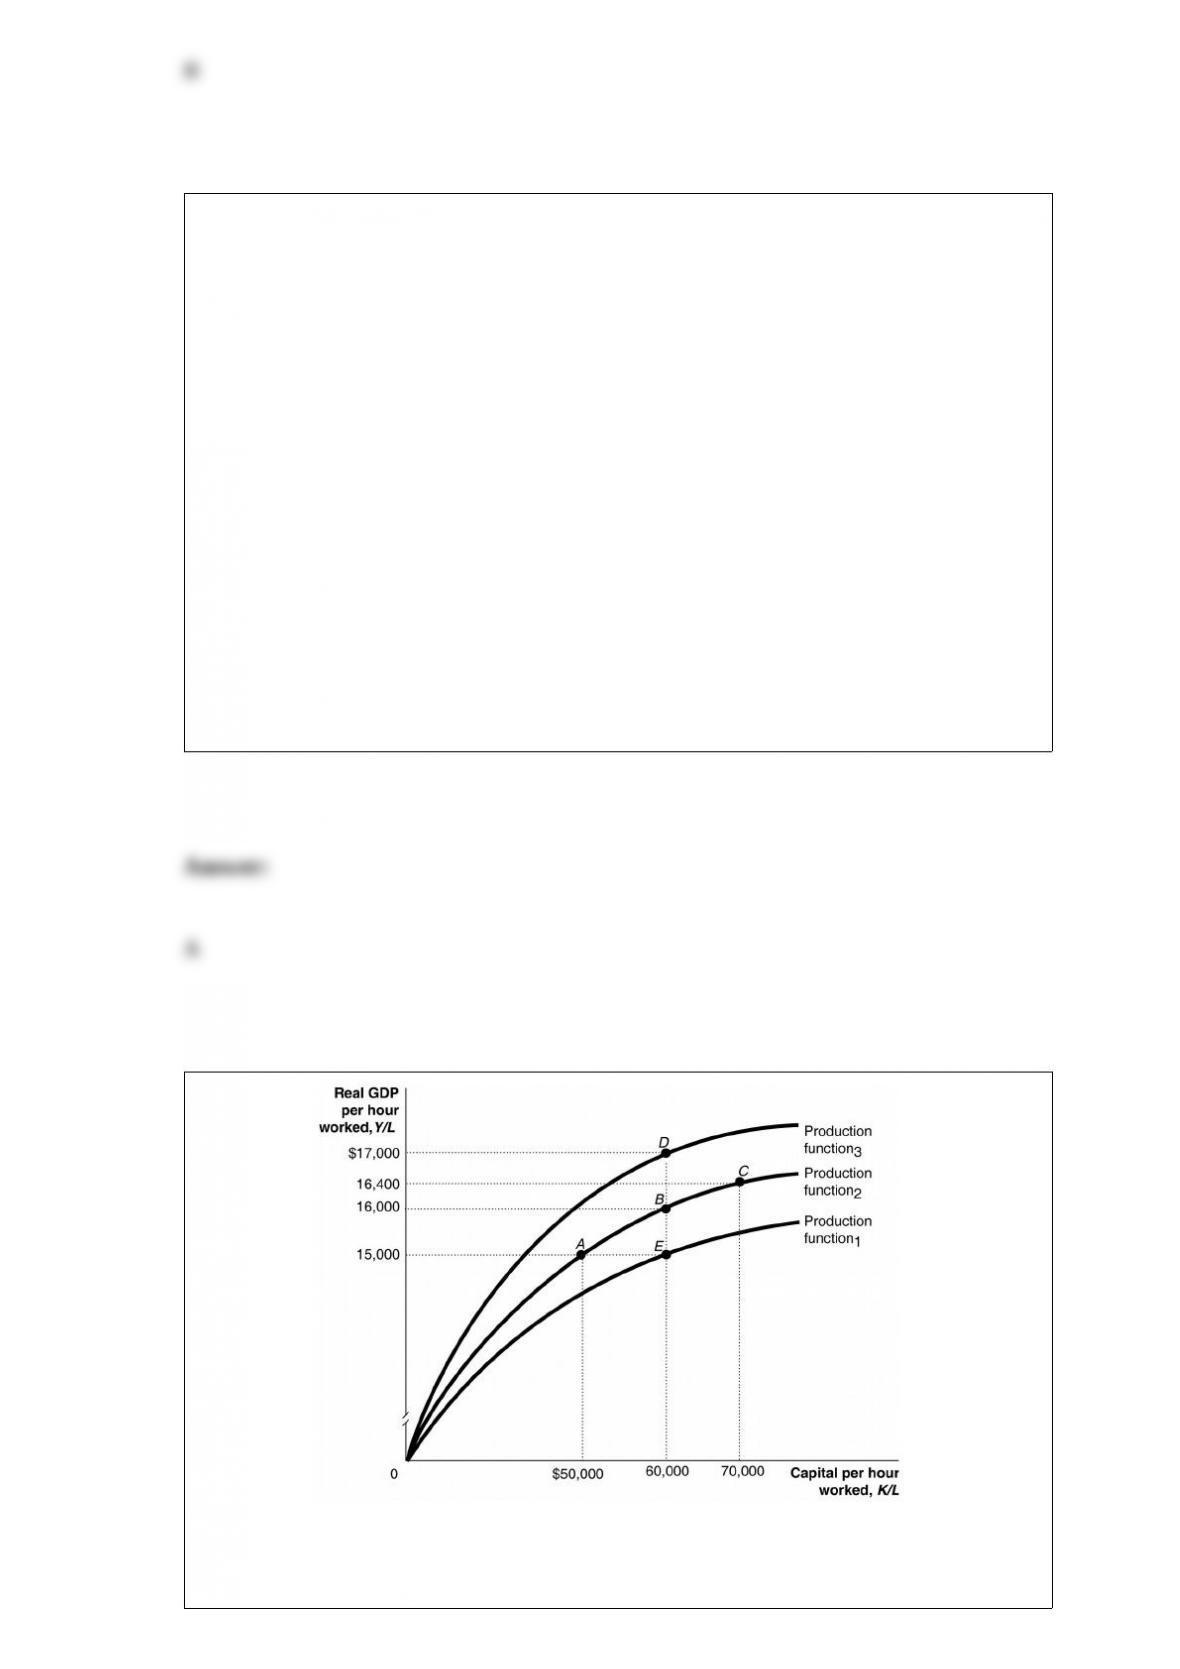
Figure 11-4
Using the per-worker production function in the figure above, the largest changes in an
economy’s standard of living would be achieved by a movement from

A) A to B to C.
B) E to B to D.
C) C to B to A.
D) D to B to E.
If a consumer receives 20 units of utility from consuming two candy bars, and 25 units
of utility from consuming three candy bars, the marginal utility of the third candy bar is
A) 25 utility units.
B) 20 utility units.
C) 5 utility units.
D) unknown, as more information is needed to determine the answer.
If real GDP in the United States is growing at an annual rate of 3.2% per capita and
Bolivia’s real GDP per capita is growing at a rate of 1.3%, which of the following
would we expect in the long run? Assume real GDP per capita in the United States
begins at a level above that of real GDP per capita in Bolivia.
A) Real GDP per capita in the United States will always be 1.9% higher than real GDP
per capital in Bolivia.
B) The difference between the level of real GDP per capita in the United States and real
GDP per capita in Bolivia will shrink over time.
C) The difference between the level of real GDP per capita in the United States and real
GDP per capita in Bolivia will increase over time.
D) The difference between the level of real GDP per capita in the United States and real
GDP per capita in Bolivia will always be $1.9 trillion.
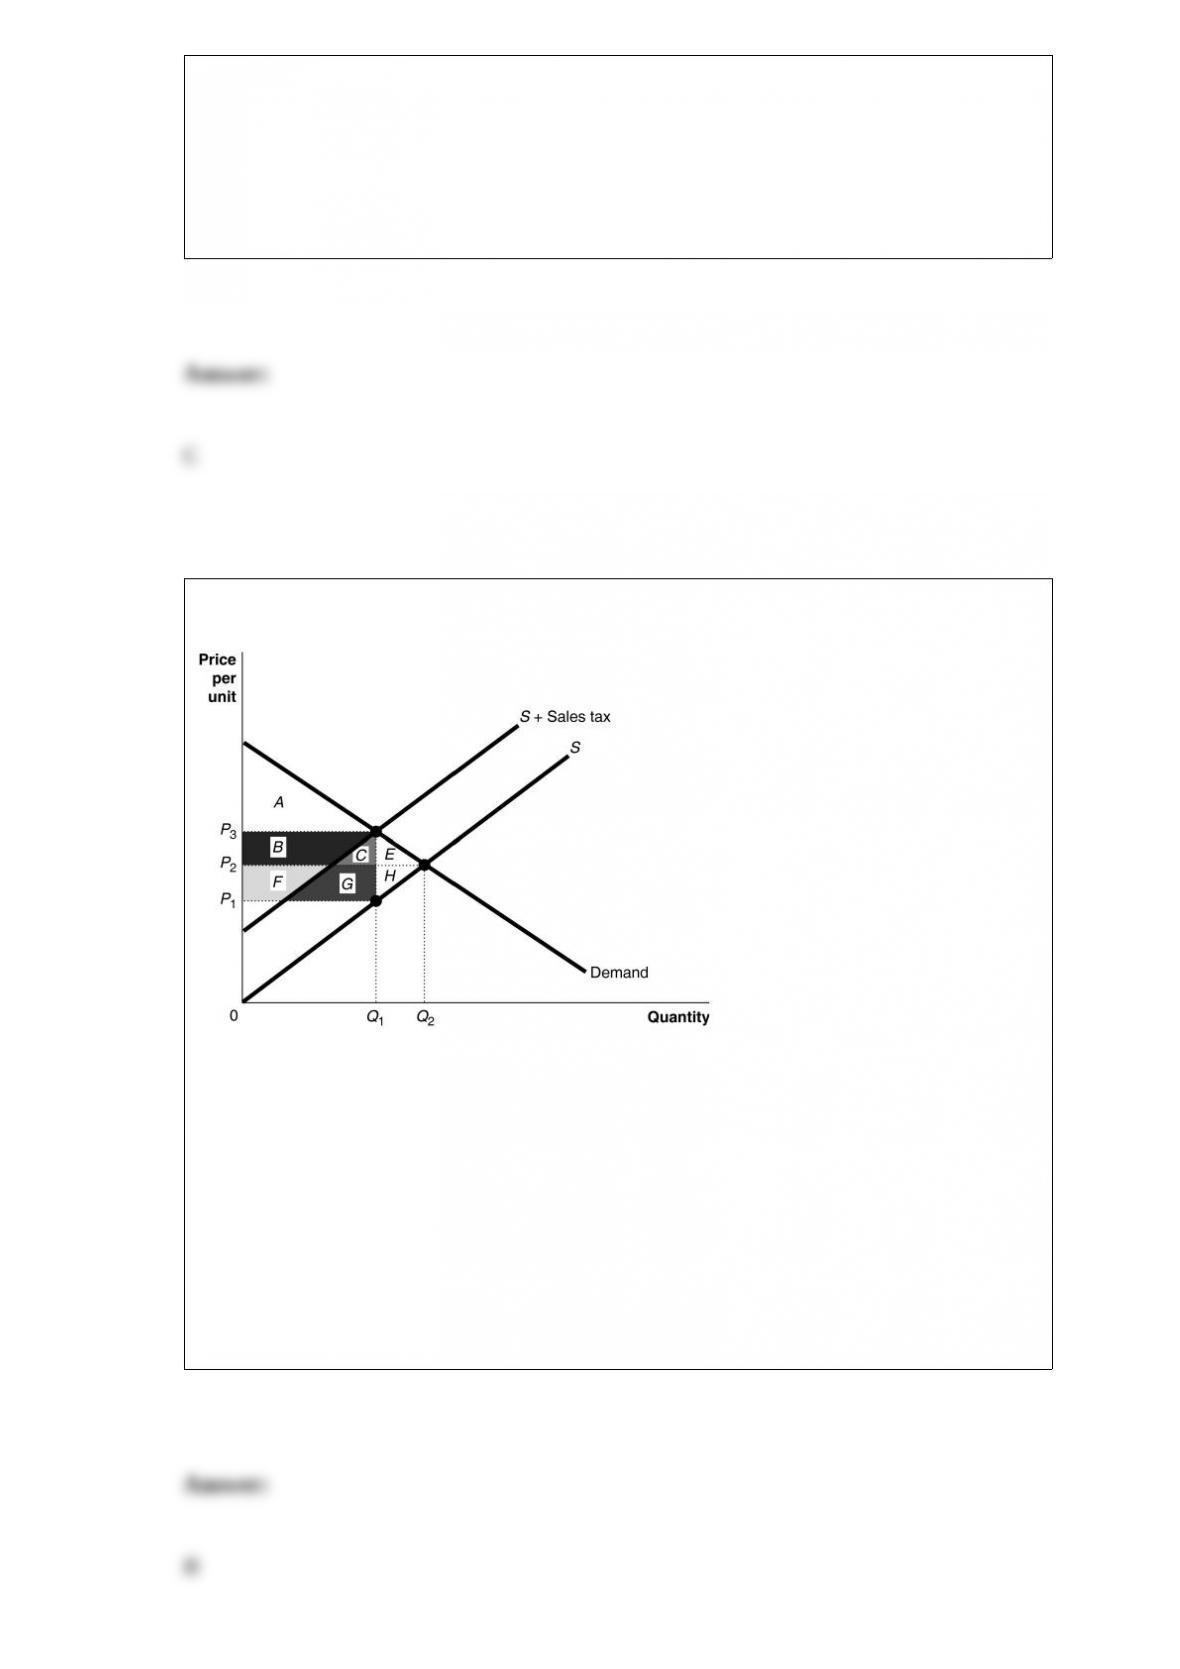
Figure 18-1
Of the tax revenue collected by the government, the portion borne by producers is
represented by the area
A) B+C.
B) F+G.
C) E+H.
D) B+C+F+G.

You lend $5,000 to a friend for one year at a nominal interest rate of 10%. Inflation
during that year is 5%. As a result, you will receive ________ at the end of the year, but
that money has a purchasing power of ________.
A) $5,050; $5,025
B) $5,100; $5,050
C) $5,500; $5,250
D) $6,000; $5,500
Stockholders
A) select the board of directors of a corporation.
B) select the employees of a corporation.
C) select the managers of a corporation.
D) all of the above
When there few close substitutes available for a good, demand tends to be
A) perfectly inelastic.
B) perfectly elastic.

C) relatively inelastic.
D) relatively elastic.
When people became ________ concerned with the underlying value of their houses
and became ________ with the expectations of the prices of their houses increasing, a
housing bubble occurred.
A) less; less
B) less; more
C) more; less
D) more; more
Table 4-8

Table 4-8 shows the demand and supply schedules for the low-skilled labor market in
the city of Westover.
If a minimum wage of $9.50 is mandated, there will be a
A) shortage of 10,000 units of labor.
B) surplus of 10,000 units of labor.
C) shortage of 20,000 units of labor.
D) surplus of 20,000 units of labor.