A tax is efficient if
A) individuals with the lowest incomes pay proportionately lower taxes than individuals
with the highest incomes.
B) it is based on profits earned and not on wages.
C) it encourages saving and investment.
D) it imposes a small excess burden relative to the revenue it raises.
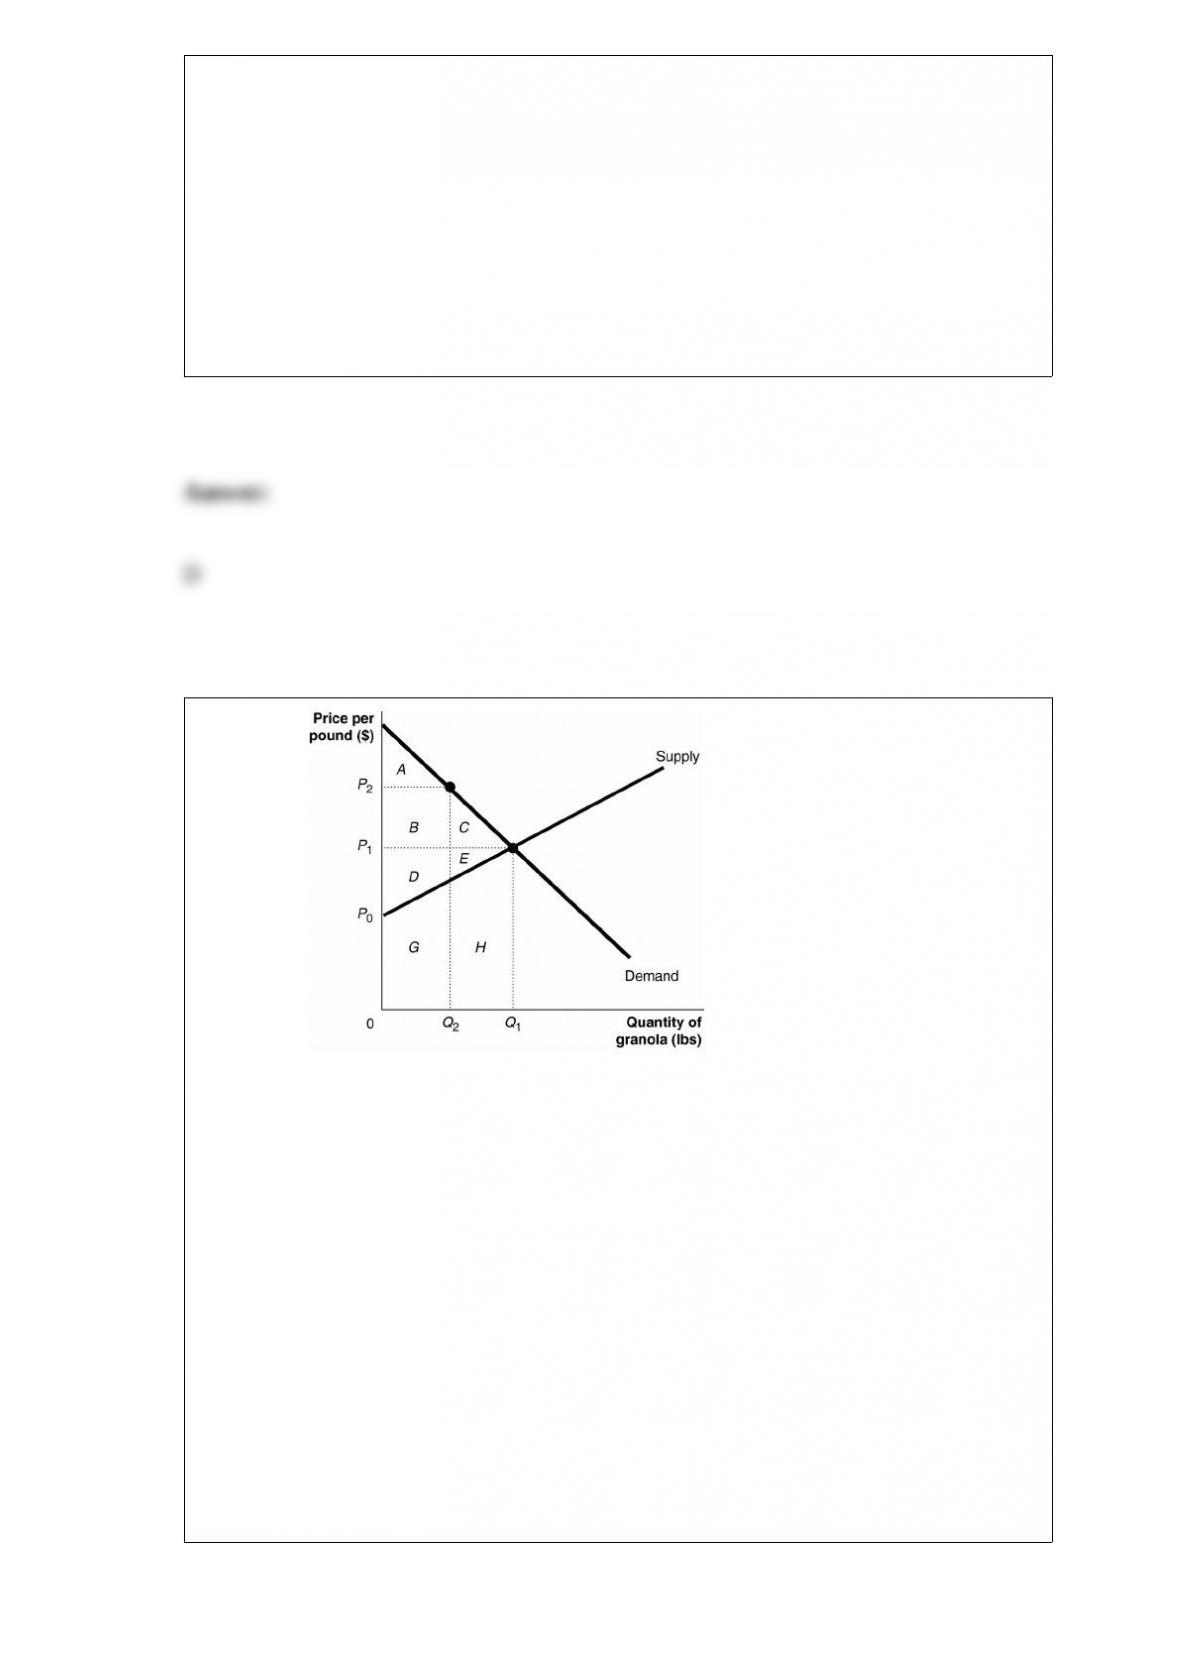
Figure 4-3 Figure 4-3 shows the market for
granola. The market is initially in equilibrium at a price of P1 and a quantity of Q1. Now
suppose producers decide to cut output to Q2 in order to raise the price to P2. At the
equilibrium price of P1, consumers are willing to buy the Q1pounds of granola. Is this
an economically efficient quantity?
A) No, the marginal benefit of the last unit (Q1) exceeds the marginal cost of that last
unit.
B) Yes, because marginal cost is zero at the price of P1.
C) Yes, because P1 is the price where marginal benefit equals marginal cost.
D) No, the marginal cost of the last unit (Q1) exceeds the marginal benefit of the last
unit.

The law of diminishing marginal returns
A) sets in because not all workers are equally productive.
B) applies only in the short run.
C) holds even when there are no fixed factors.
D) ultimately explains why production displays diseconomies of scale.
If the slope of the per-worker production function is 1/4 in a given range, how will a
$10,000 increase in capital per hour worked affect real GDP per hour worked in the
same given range?
A) Real GDP per hour worked will increase by $2,500.
B) Real GDP per hour worked will increase by $40,000.
C) Real GDP per hour worked will increase by $10,000.
D) Real GDP per hour worked will decrease by $40.000.

Figure 3-2
An increase in the price of substitutes in production would be represented by a
movement from
A) A to B.
B) B to A.
C) S1 to S2.
D) S2 to S1.
The attainable production points on a production possibility curve are
A) the horizontal and vertical intercepts.
B) the points along the production possibilities frontier.
C) the points outside the area enclosed by the production possibilities frontier.
D) the points along and inside the production possibility frontier.

The income effect of an increase in the price of salmon
A) is the change in the demand for salmon when income increases.
B) refers to the relative price effect€salmon is more expensive compared to other types
of fish€which causes the consumer to buy less salmon.
C) refers to the effect on a consumer’s purchasing power which causes the consumer to
buy less salmon, holding all other factors constant.
D) is the change in the demand for other types of fish, say trout, that result from a
decrease in purchasing power.
Because of diminishing returns, an economy can continue to increase real GDP per hour
worked only if
A) there are decreases in human capital.
B) the per-worker production function shifts downward.
C) there continue to be decreases in capital per hour worked.
D) there is technological change.
What is the common feature displayed by the following items?
a. eating in a newly opened “fusion” cuisine restaurant
b. attending a Red Sox game in Fenway Park
c. wearing Lucky Brand designer jeans
A) They are all highly inelastic goods.
B) The consumption of these goods takes place privately.
C) The consumption of these goods takes place publicly.
D) They tend to be consumed by better educated people.
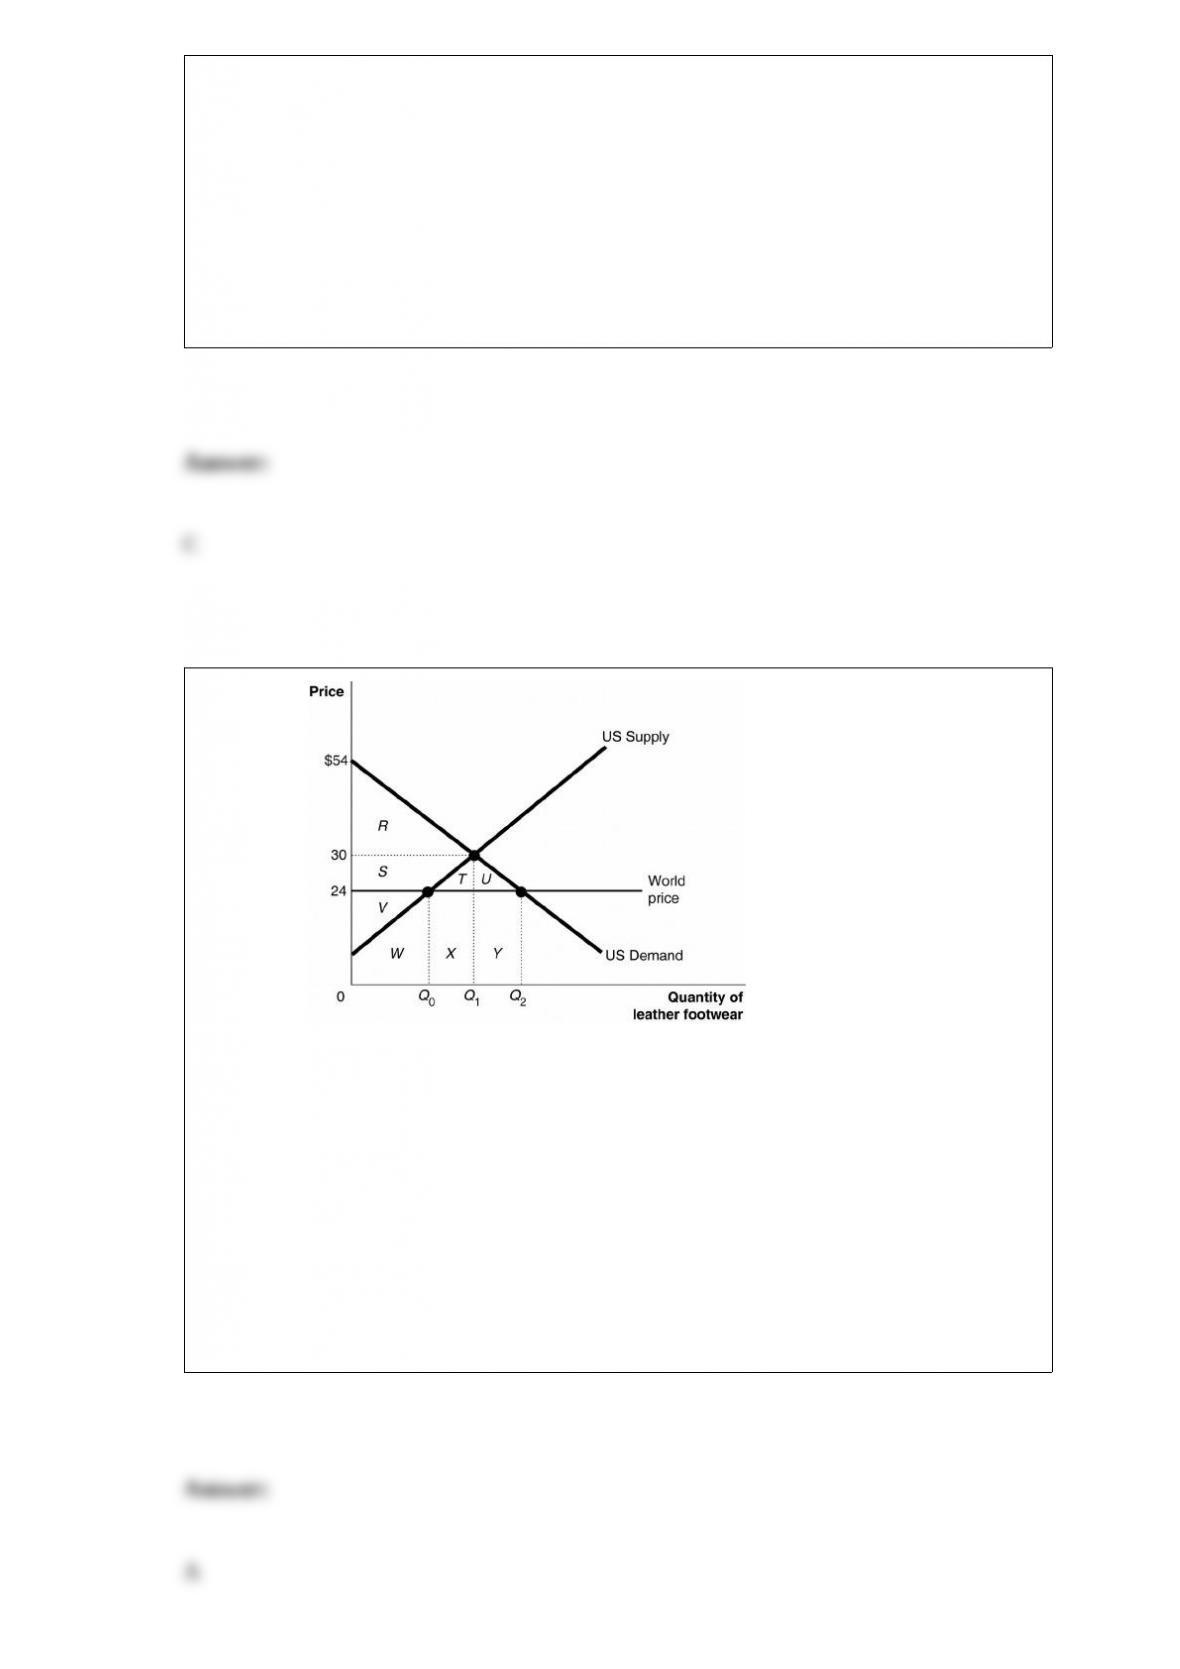
Figure 7-1 Figure 7-1 shows the U.S.
demand and supply for leather footwear. Suppose the government allows imports of
leather footwear into the United States. What will be the domestic quantity supplied?
A) Q0
B) Q1
C) Q2
D) Q2 – Q0
Studies have shown links between calcium consumption and a reduction in
osteoporosis. How does this affect the market for calcium?
A) The calcium supply curve shifts to the right because of a change in tastes in favor of
calcium.
B) The calcium demand curve shifts to the right because of a change in tastes in favor
of calcium.
C) The calcium demand curve shifts to the left because this new information will
increase the price of calcium.
D) The calcium supply curve shifts to the left because this new information will
increase the price of calcium.
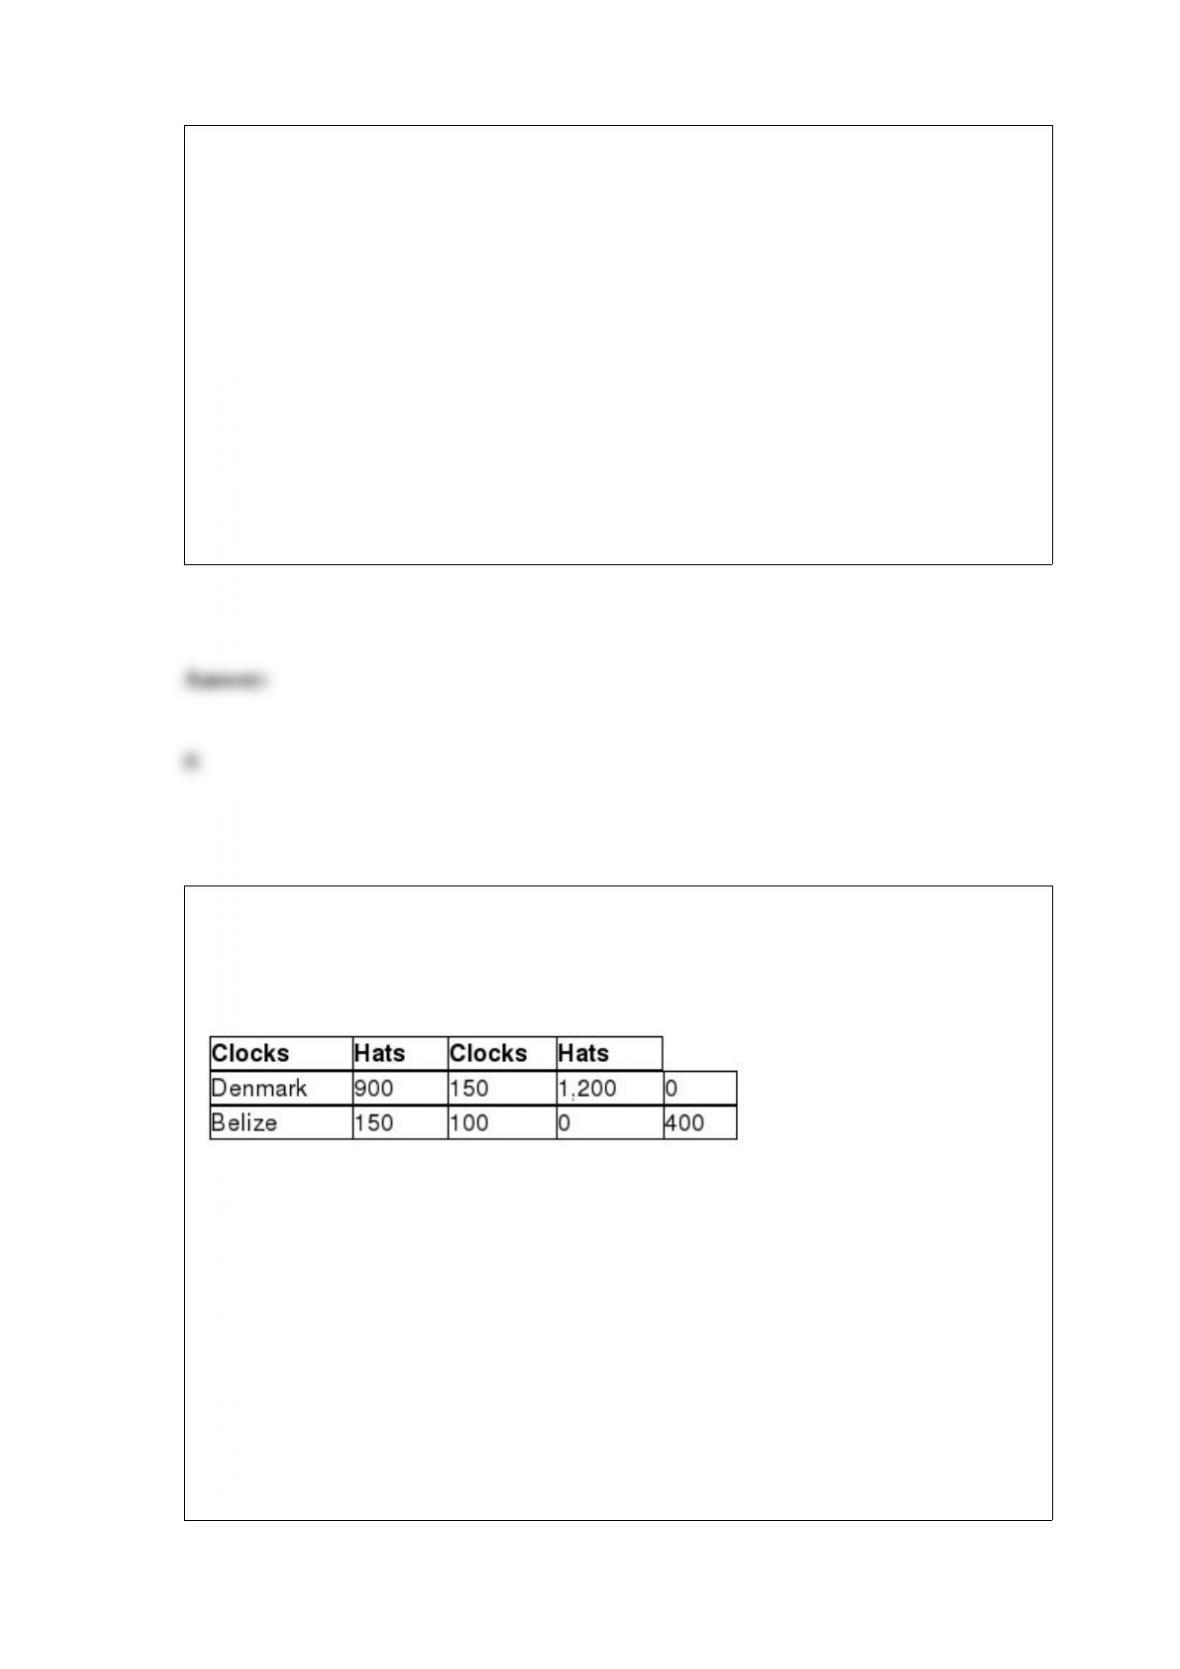
Table 9-6
Production and
Consumption Production
Without Trade With Trade
Denmark and Belize can produce both clocks and hats. Table 9-6 shows the production
and consumption quantities without trade, and the production numbers with trade. If the
actual terms of trade are 1 hat for 1.8 clocks and 150 hats are traded, how many clocks
will Belize consume?
A) 150
B) 270
C) 930
D) 1,200

Suppose we want to use game theory to analyze how an oligopolist selects its optimal
price. The cells of the payoff matrix show
A) the profit that each producer can expect to earn by pursuing a single strategy.
B) the profit that each producer can expect to earn from every combination of strategies
by the firms in the market.
C) the strategy that a firm must pursue to earn various levels of profit.
D) the expected profits of rival firms.
The natural rate of unemployment is the amount of unemployment
A) associated with the business cycle.
B) equal to frictional plus structural unemployment.
C) that exists when the economy goes into recession.
D) that exists when the economy is in an expansion.

Figure 11-1
The average product of the 4th worker
A) is 68.
B) is 17.
C) is 11.
D) cannot be determined.
The federal government and some state governments levy taxes on specific goods such
as gasoline, cigarettes and beer. These are known as
A) sales taxes.
B) sin taxes.
C) specific taxes.
D) excise taxes.