Consider a downward-sloping demand curve. When the price of a normal good
decreases, the income and substitution effects
A) work in the same direction to increase quantity demanded.
B) work in the same direction to decrease quantity demanded.
C) work in opposite directions and quantity demanded increases.
D) work in opposite directions and quantity demanded decreases.
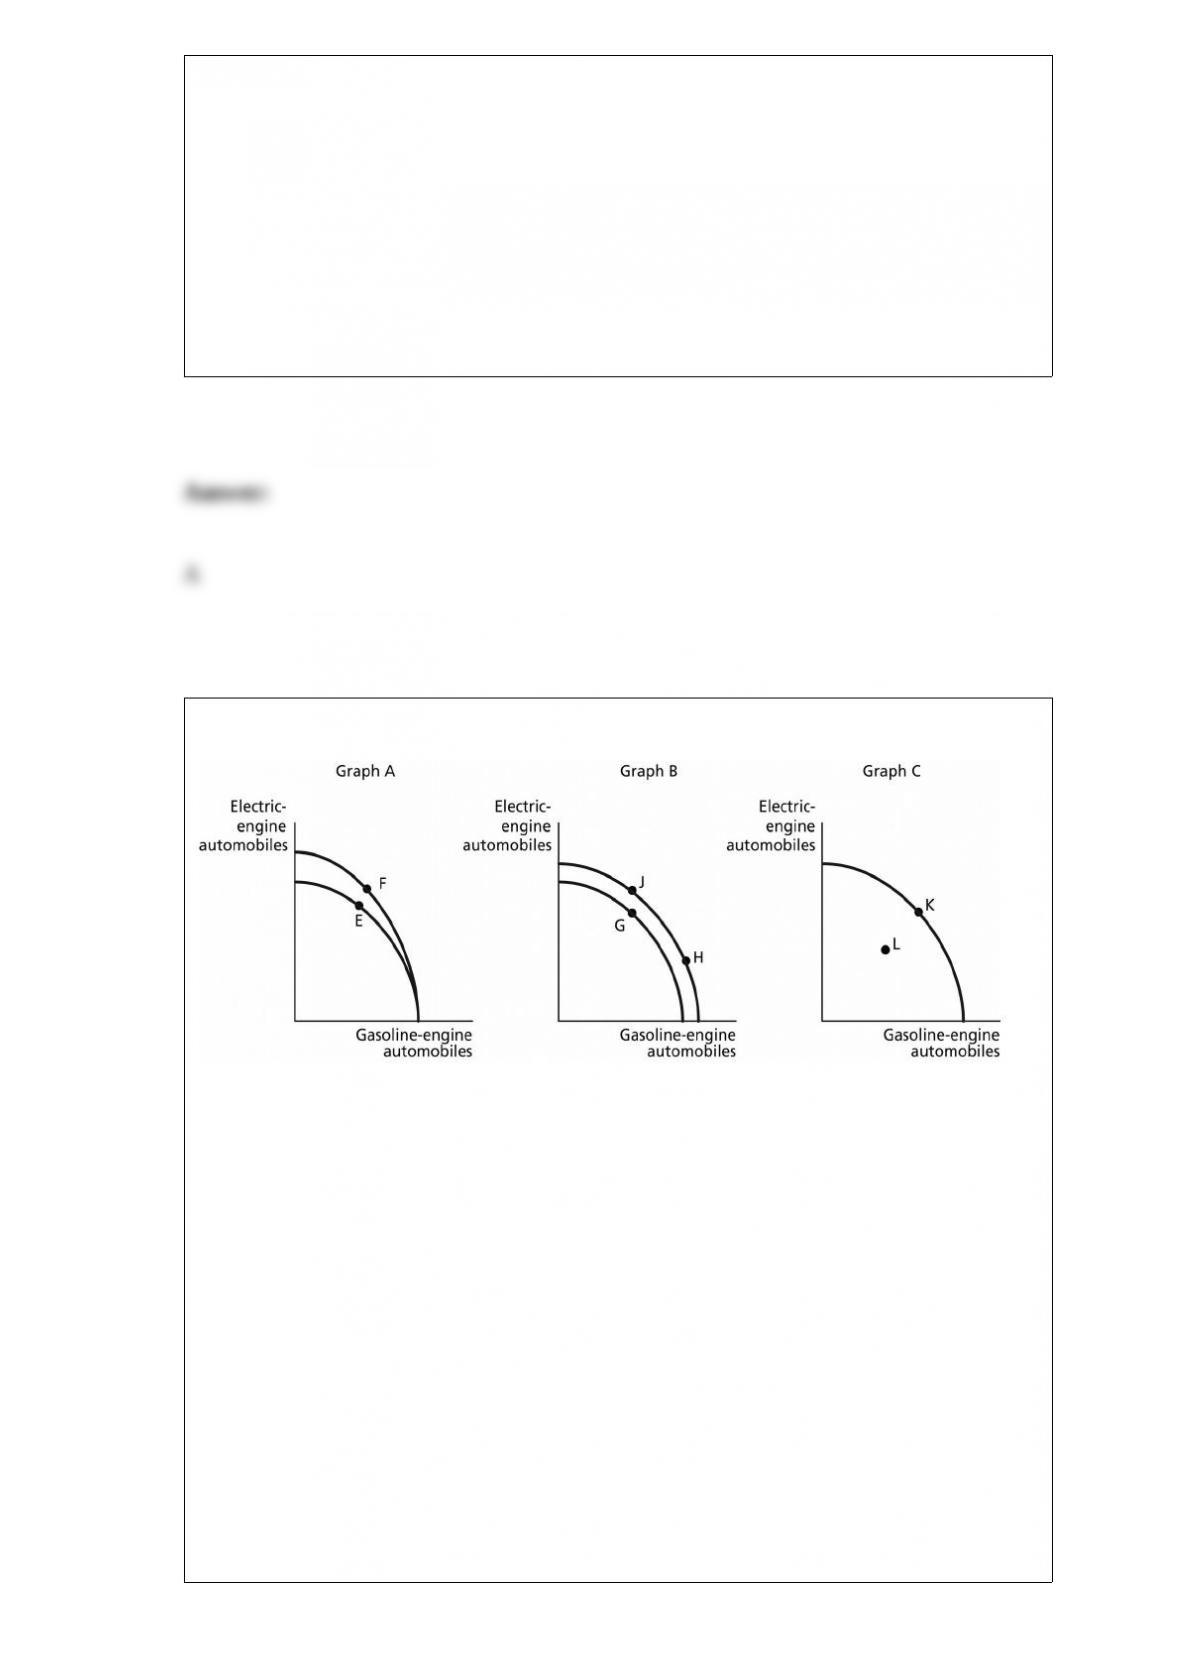
Figure 2-7
Mercedes Benz recently decided to introduce its B-class automobile in the U.S. market,
an electric car that is has designed and developed in a partnership with Tesla Motors.
Assume Mercedes Benz chooses to produce both electric-engine vehicles and
gasoline-engine vehicles. Figure 2-7 shows changes to its production possibilities
frontier in response to new developments and Different strategic production decisions.
Assume that in response to changing consumer demands, Mercedes cuts back on the
production of electric vehicles and increased its production of gasoline-powered
vehicles. This strategy is best represented by the
A) movement from F to E in Graph A.
B) movement from G to J in Graph B.
C) movement from L to K in Graph C.
D) movement from J to H in Graph B.
Gowri has $6 per day to purchase lunch. She spends all of her lunch money on pizza
and iced tea. The price of pizza is $2.00 per slice and iced tea costs $1 per bottle.
a. Draw Gowri’s budget constraint and label it BC0. Put pizza on the horizontal axis and
iced tea on the vertical axis. Be sure to identify the intercept values.
b. If the price of iced tea rises to $1.20 per bottle, show what will happen to her budget
constraint in your diagram. Be sure to indicate any new intercept values.
Figure 4-4
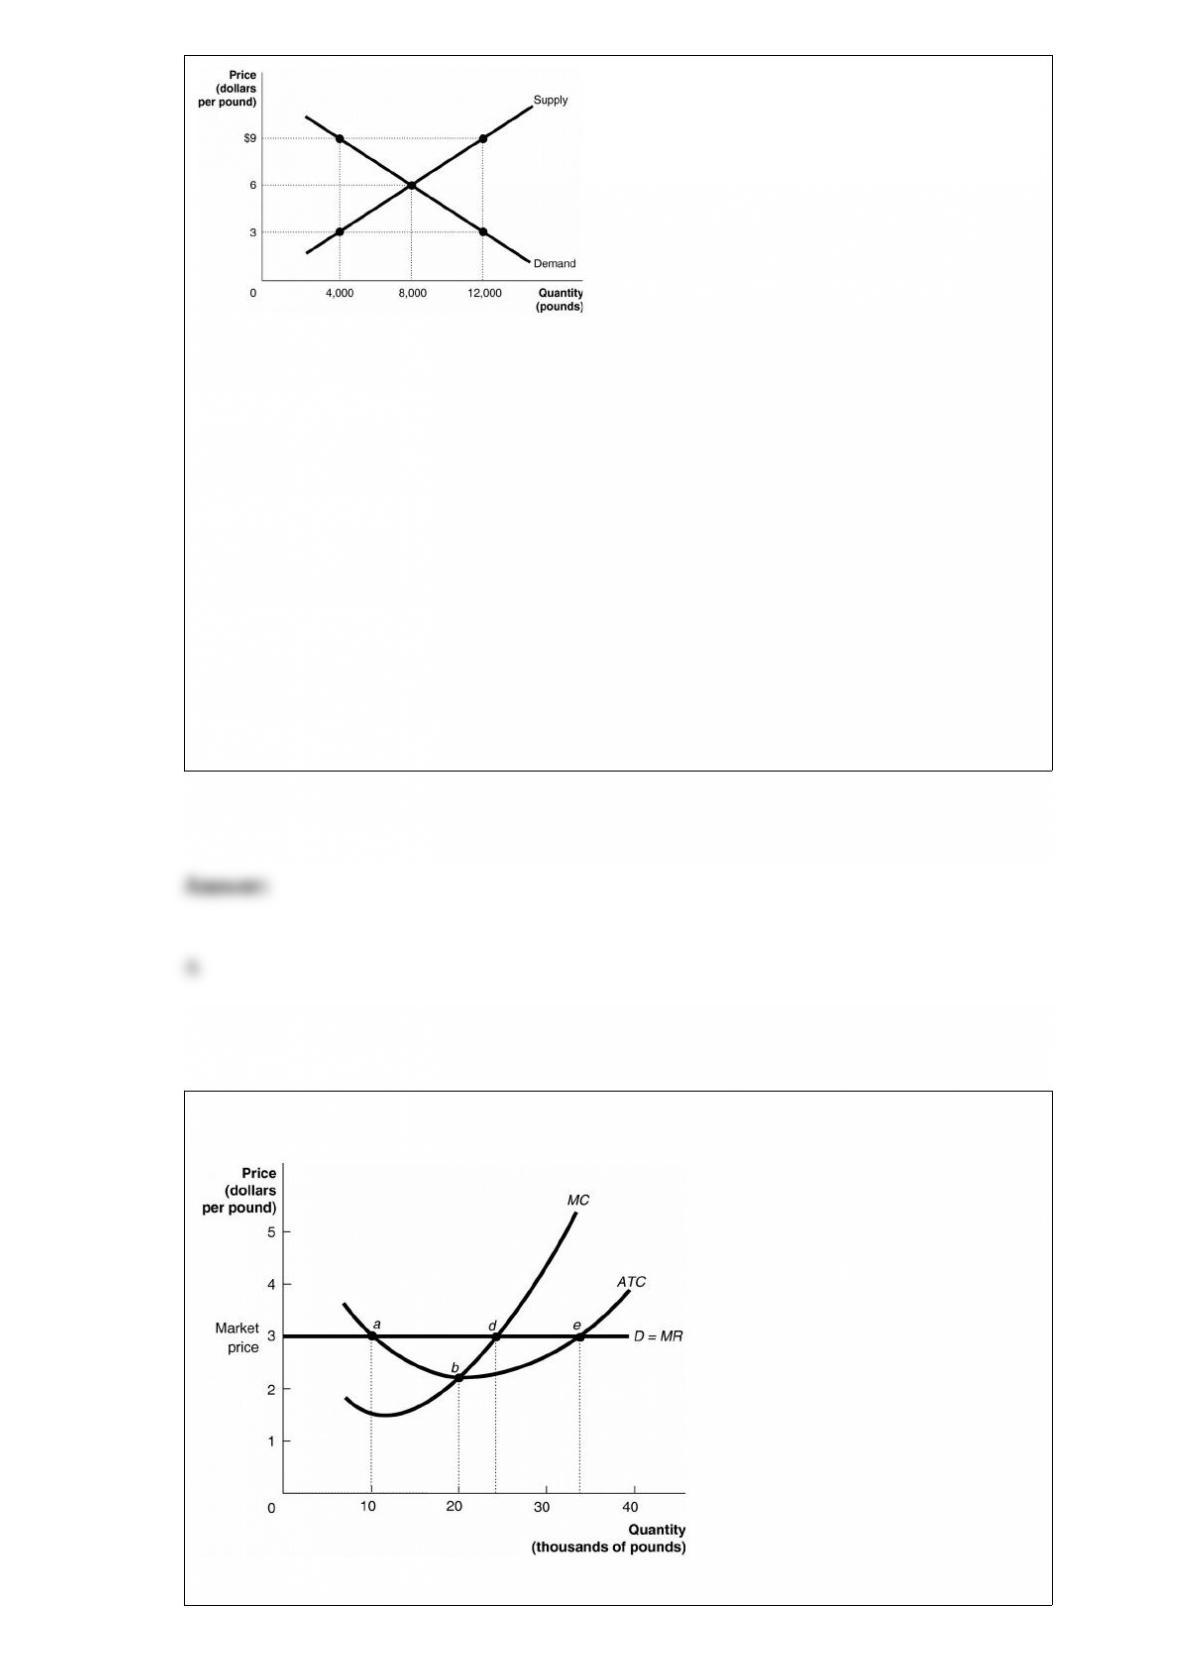
The figure above represents the market for pecans. Assume that this is a competitive
market. At a price of $3
A) the marginal cost of pecans is greater than the marginal benefit; therefore, output is
inefficiently low.
B) producers should raise the price to $9 in order to sell the quantity demanded of
12,000.
C) the marginal benefit of pecans is greater than the marginal cost; therefore, output is
inefficiently high.
D) the marginal benefit of pecans is greater than the marginal cost; therefore, output is
inefficiently low.
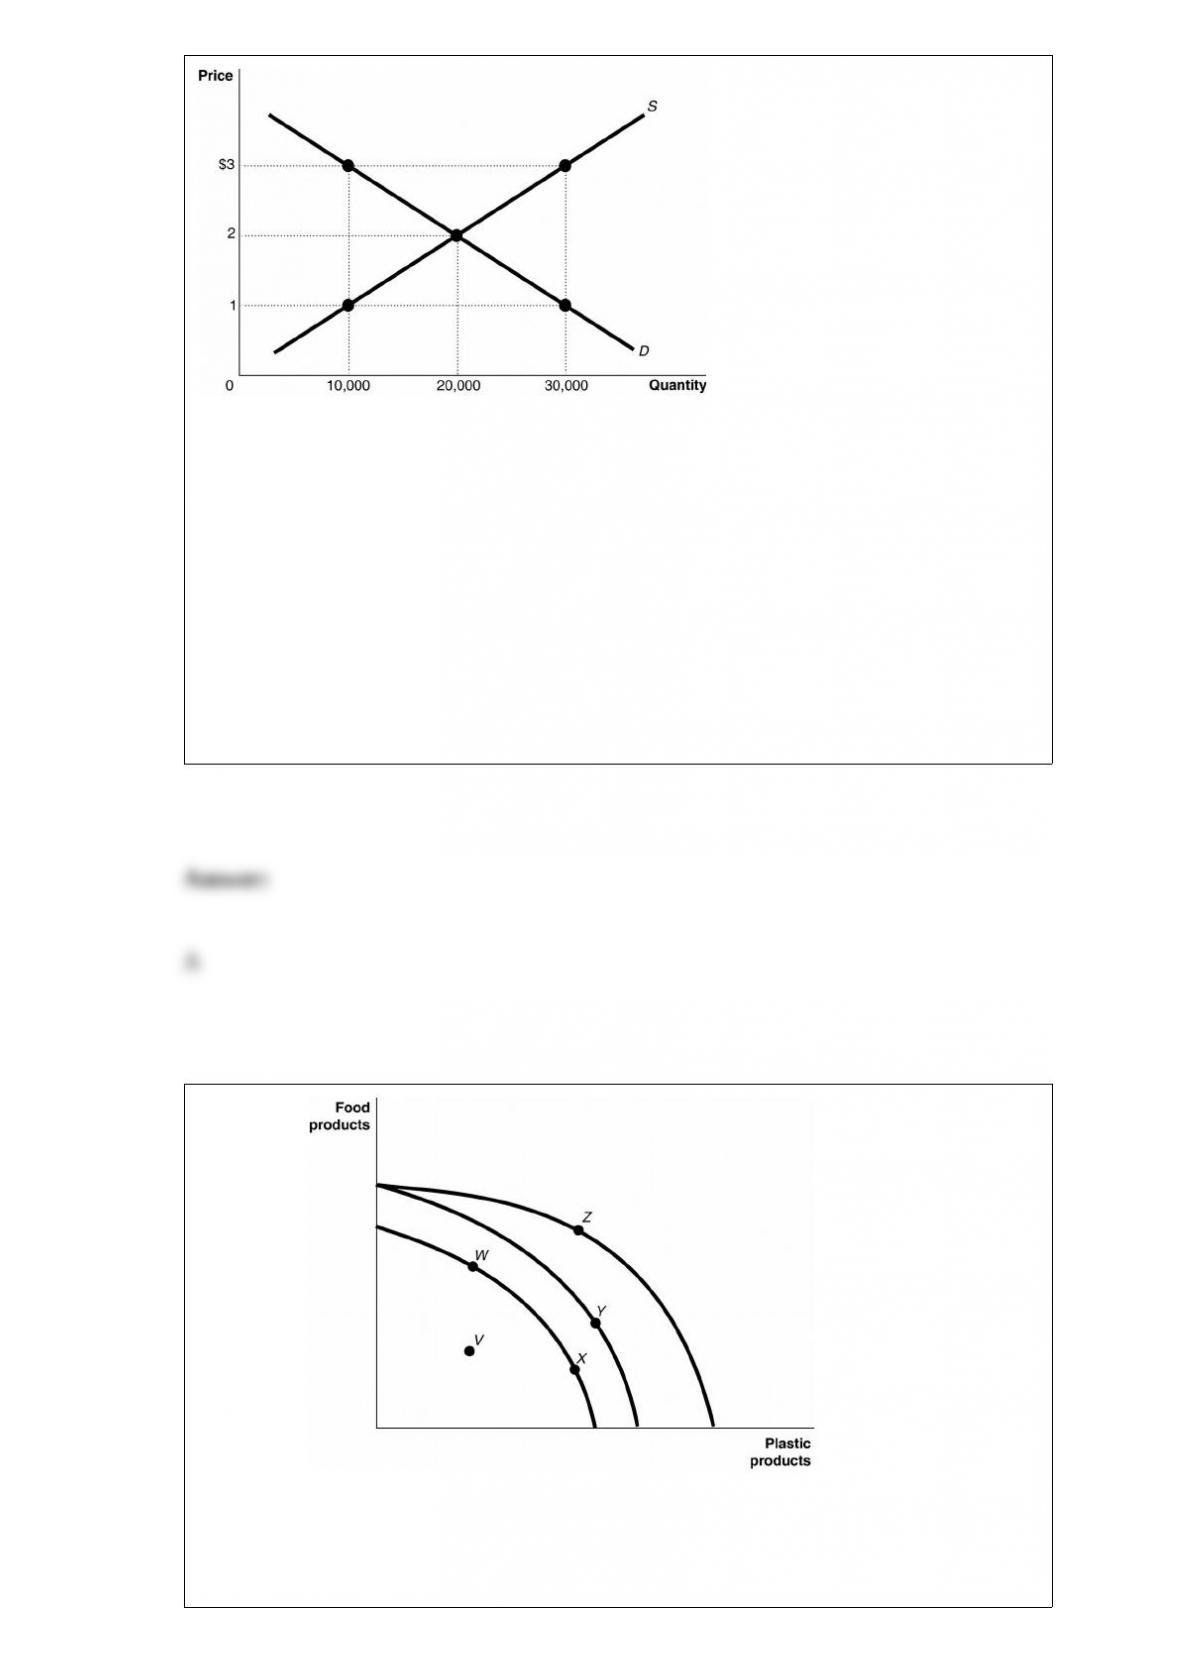
Figure 12-6
Figure 12-6 shows the demand,
marginal cost (MC) and average total cost (ATC) curves for Jason’s House of Apples.

Jason is currently producing 20 thousand pounds of apples. To maximize his profit
Jason should
A) keep production at 20 thousand pounds.
B) increase production to the output rate indicated by point d.
C) increase production to the output rate indicated by point e.
D) decrease production to the output rate indicated by point a.
A Nash equilibrium is
A) reached when an oligopoly’s market demand and supply intersect.
B) reached when each player chooses the best strategy for himself and for the group.
C) reached when each player chooses the best strategy for himself, given the other
strategies chosen by the other players in the group.
D) an equilibrium comprising non-dominant strategies only.
Figure 4-4
The figure above represents the market for iced tea. Assume that this is a competitive
market. If the price of iced tea is $1
A) the quantity supplied is less than the economically efficient quantity.
B) the quantity supplied is economically efficient but the quantity demanded is
economically inefficient.
C) economic surplus is maximized.
D) not enough consumers want to buy iced tea.
Figure 2-4 Figure 2-4 shows
various points on three different production possibilities frontiers for a nation. Consider
the following events:
a. a decrease in the unemployment rate

b. general technological advancement
c. an increase in consumer wealth Which of the events listed above could cause a
movement from V to X ?
A) a only
B) a and b only
C) b and c only
D) a, b, and c
Which of the following best describes the “wealth effect”?
A) When the price level falls, the real value of household wealth falls.
B) When the price level falls, the nominal value of household wealth falls.
C) When the price level falls, the nominal value of household wealth rises.
D) When the price level falls, the real value of household wealth rises.
Assume that China has a comparative advantage in producing corn and exports corn to
Japan. We can conclude that
A) China also has an absolute advantage in producing corn relative to Japan.
B) China has a lower opportunity cost of producing corn relative to Japan.

C) Japan has an absolute disadvantage in producing corn relative to China.
D) Labor costs are higher for corn producers in Japan than in China.
If a firm faces a downward-sloping demand curve
A) the demand for its product must be inelastic.
B) it can control both price and quantity sold.
C) it must reduce its price to sell more units.
D) it will always make a profit.