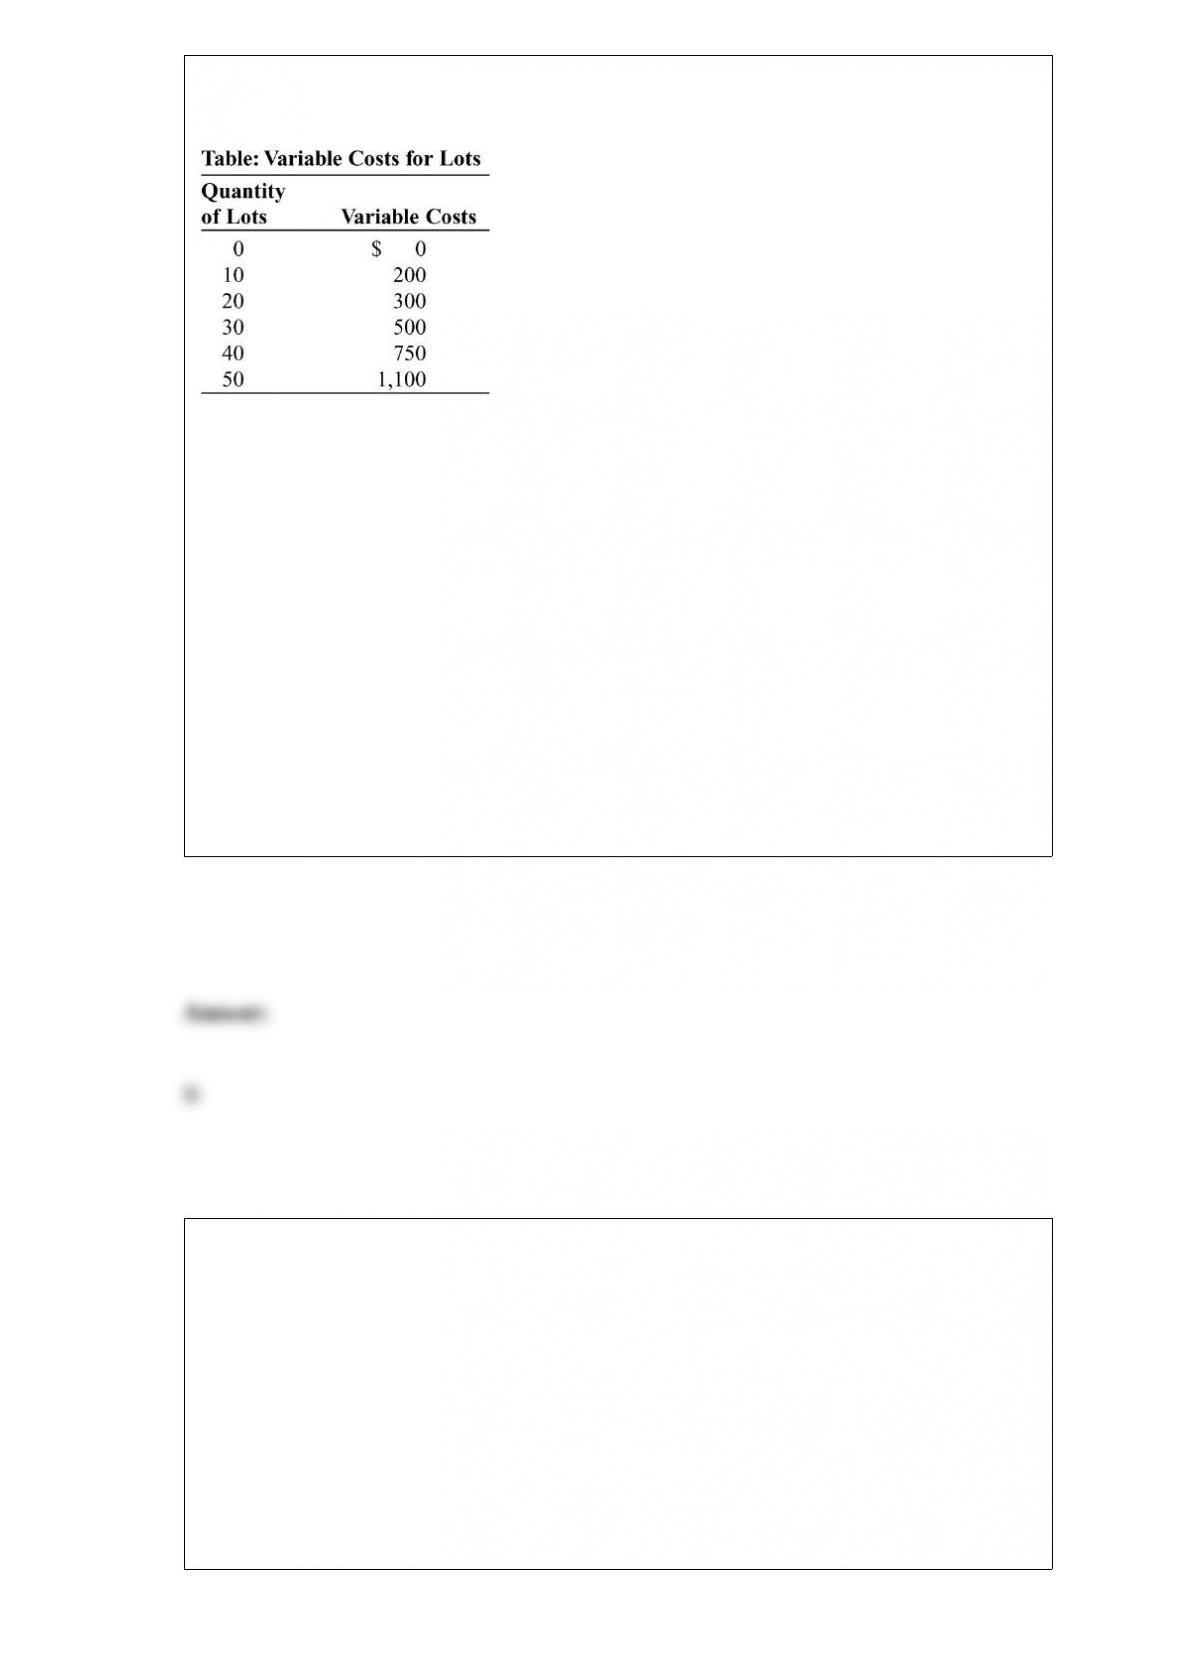
(Table: Variable Costs for Lots) Look at the table Variable Costs for Lots. During the
winter, Alexa runs a snow-clearing service in a perfectly competitive industry. Assume
that costs are constant in each interval; that is, the variable cost of clearing anywhere
from 1 through 10 lots is $200. Her only fixed cost is $1,000 for a snowplow. Her
variable costs include fuel, her time, and hot coffee. At what price does Alexa’ s
short-run supply curve start?
A) $200
B) $15
C) $50
D) $42
In a single year, the Netherlands can raise 100 tons of beef or produce 1,000 boxes of
tulips. In the same growing season, Belgium can raise 50 tons of beef or produce 750
boxes of tulips. In autarky, the opportunity cost of 1 ton of beef in the Netherlands is:
A) 100 tons of beef.
B) 1,000 boxes of tulips.
C) 10 boxes of tulips.
D) 0.1 box of tulips.
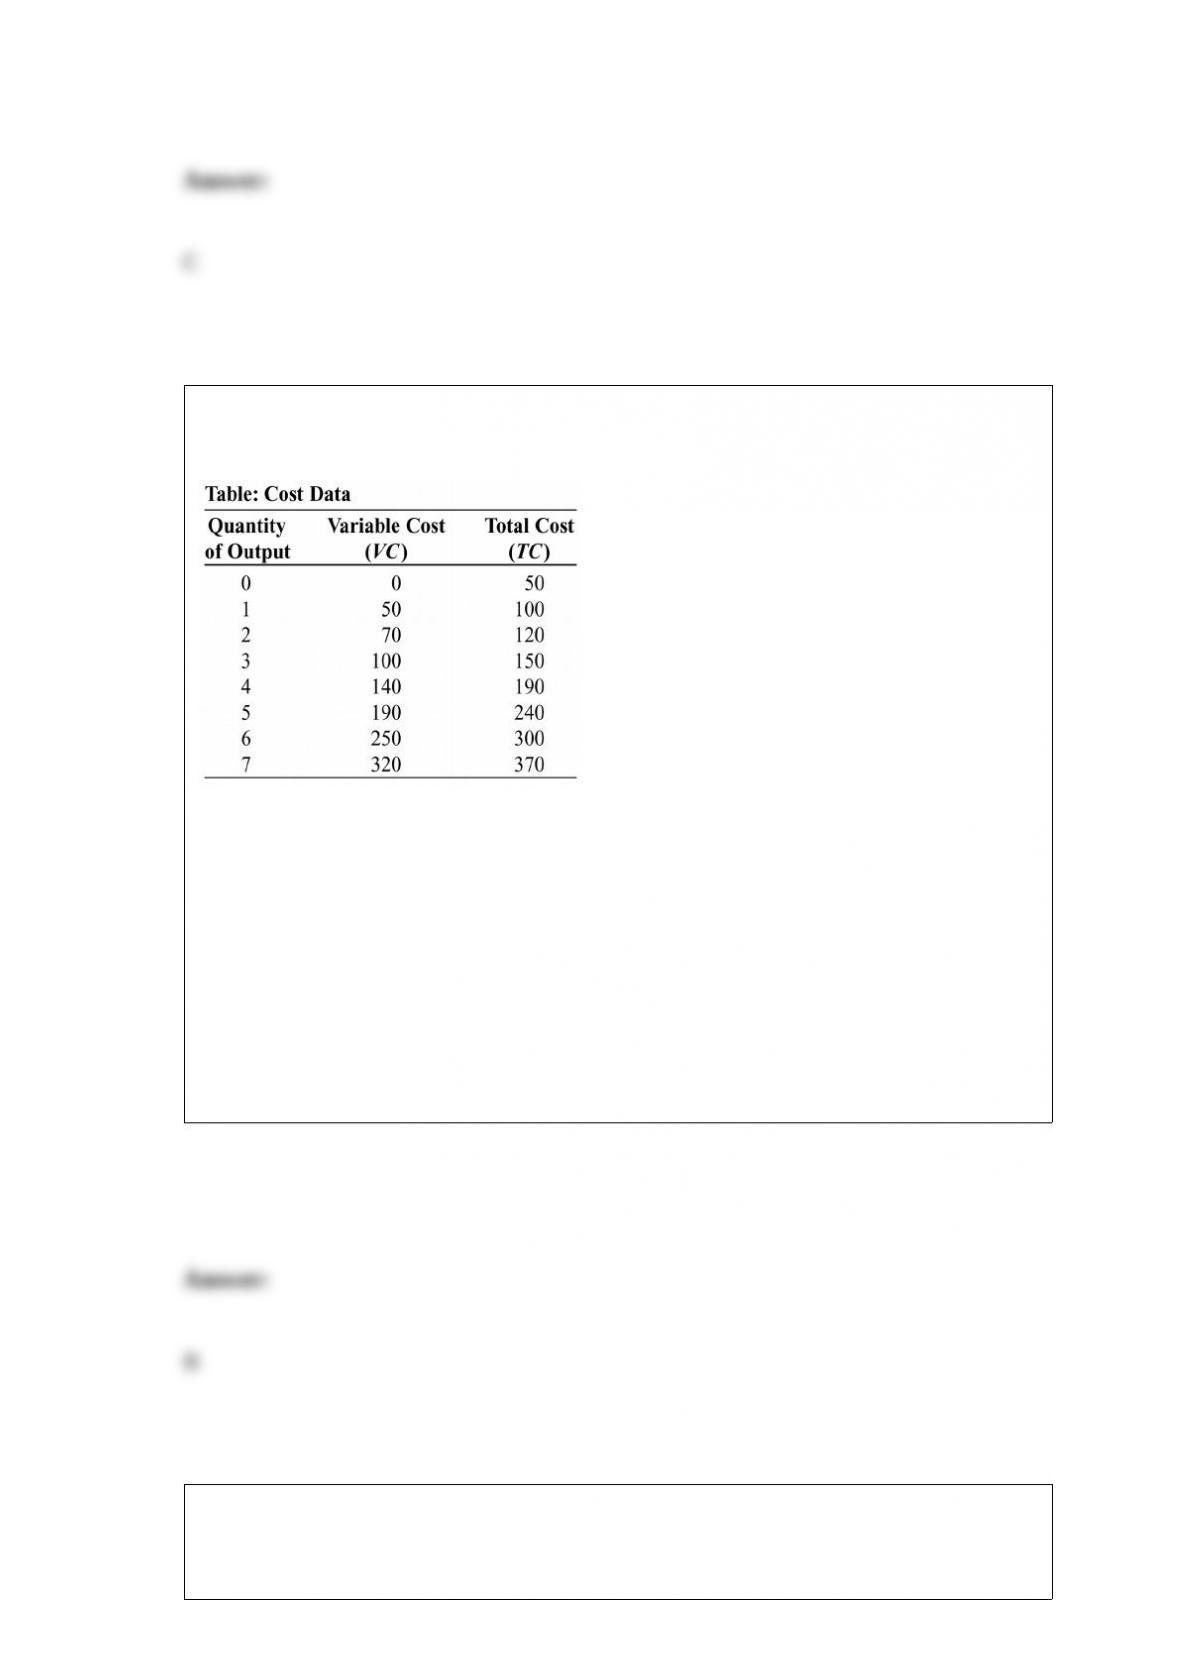
(Table: Cost Data) Look at the table Cost Data. The marginal cost of producing the fifth
purse is:
A) $60.
B) $50.
C) $35.
D) $20.
A firm’s marginal cost is:
A) the ratio of the change in fixed cost to the change in the quantity of output.
B) the slope of the total cost curve.
C) the slope of the average variable cost curve.
D) the ratio of the change in total output to the change in the quantity of labor.
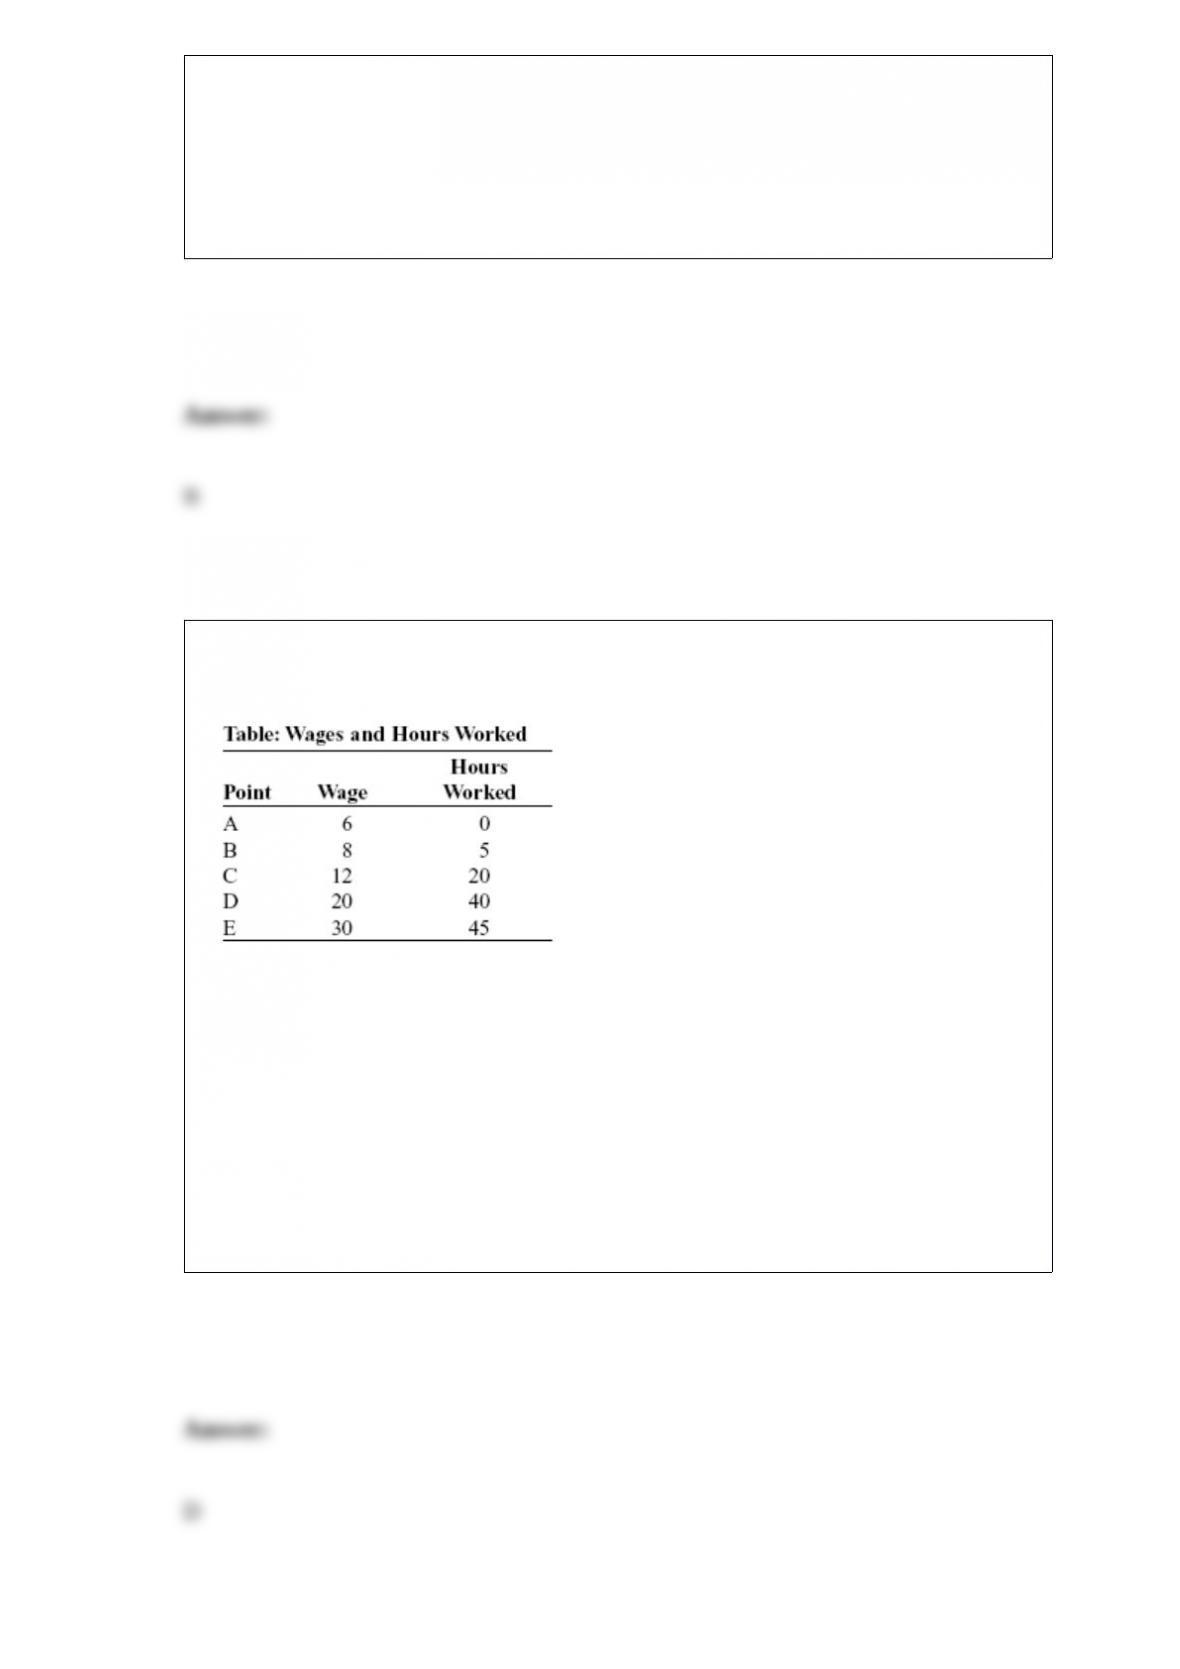
(Table: Wages and Hours Worked) Look at the
table Wages and Hours Worked. Graphing the relation with wages on the vertical axis
and hours worked on the horizontal axis, the slope between point A and point B is:
A) 2.5.
B) 5.
C) 2.
D) 2/5.
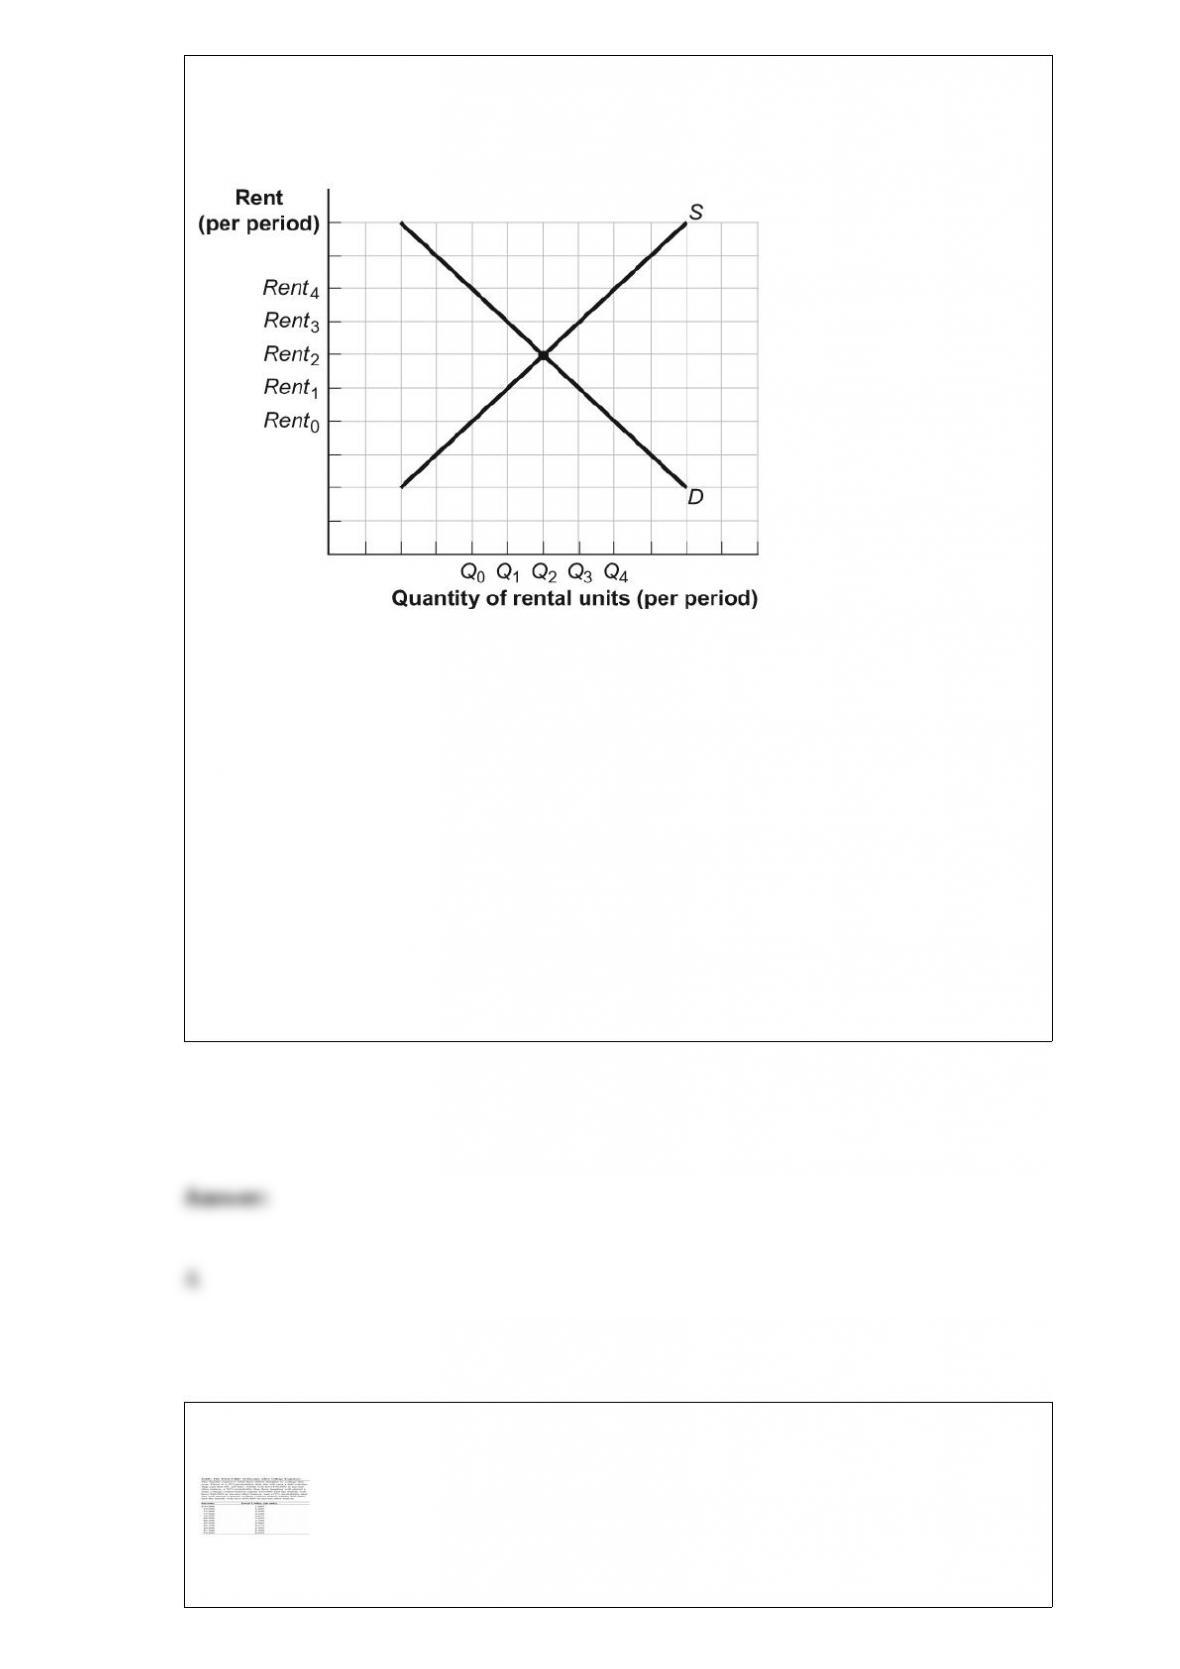
Figure: Rent Controls
(Figure: Rent Controls) Look at the figure Rent Controls. If rent controls are set at
Rent1:
A) the shortage of rental units is the distance Q3 ” Q1.
B) some renters will be willing to pay a price as high as Rent4 for Q1 units.
C) no one will have to pay a higher actual price than Rent0, nor will anyone be willing
to do so.
D) there will be a surplus of rental units, but it is impossible to tell how large the
surplus is based on the information provided.
(Table: Total Utility of Income After College Expenses) Look at the table Total Utility

of Income After College Expenses. Mr. and Mrs. Smith would be willing to pay as
much as _____ for insurance to pay their daughter’s tuition and eliminate the
uncertainty in the family’s income after tuition.
A) $12,000
B) $10,000
C) $8,000
D) $5,000
Ellen consumes goods X and Y. As she consumes less X, she must be compensated with
additional units of Y, and her marginal rate of substitution of X for Y decreases as she
consumes more Y. This means that goods X and Y are:
A) ordinary.
B) unique.
C) complements.
D) substitutes.
The short-run shut-down price is:
A) the price at which economic profit is zero.
B) the minimum of the AVC curve.
C) the intersection of the MC and ATC curves.
D) the minimum of the AFC curve.
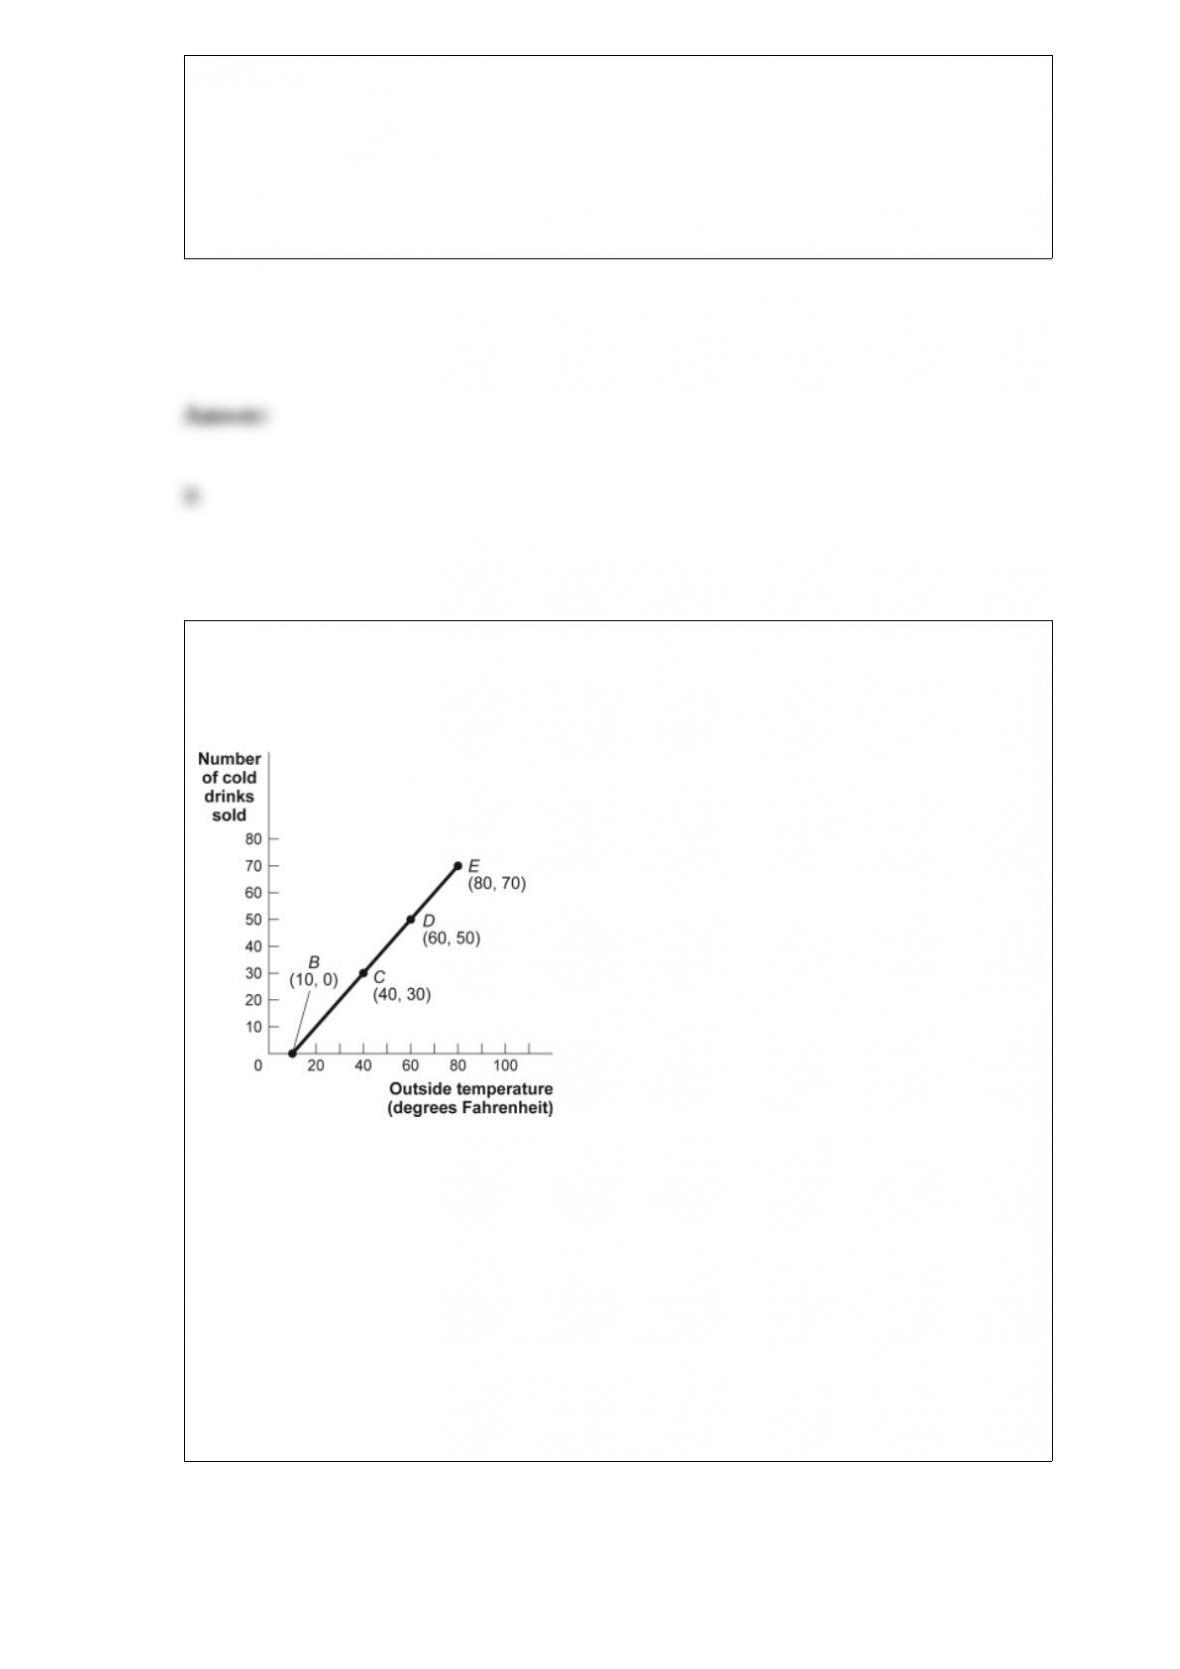
Figure: Cold Drinks Sold and Temperature
(Figure: Cold Drinks Sold and Temperature)
Look at the figure Cold Drinks Sold and Temperature. If we move from point B to point
C in the figure, the outside temperature has ______ degrees and the number of cold
drinks sold has ______.
A) decreased by 30; decreased by 30
B) increased by 20; increased by 20
C) increased by 30; increased by 30
D) increased by 40; increased by 40
Which of the following is a normative statement?
A) The rate of unemployment is 9%.
B) A high rate of economic growth creates jobs.
C) The federal government spends half of its budget on national defense.
D) Everyone in the United States deserves to be covered by national health insurance.
An ambiguous change in price and a decrease in quantity are most likely caused by:

A) no shift in supply and a shift to the left in demand.
B) a shift to the left in supply and a shift to the left in demand.
C) a shift to the right in supply and a shift to the left in demand.
D) a shift to the left in supply and a shift to the right in demand.
The production possibility frontier is bowed out because:
A) resources are not equally suited for the production of both goods.
B) resources are scarce.
C) economic growth leads to inefficiency.
D) resources are inefficiently used.
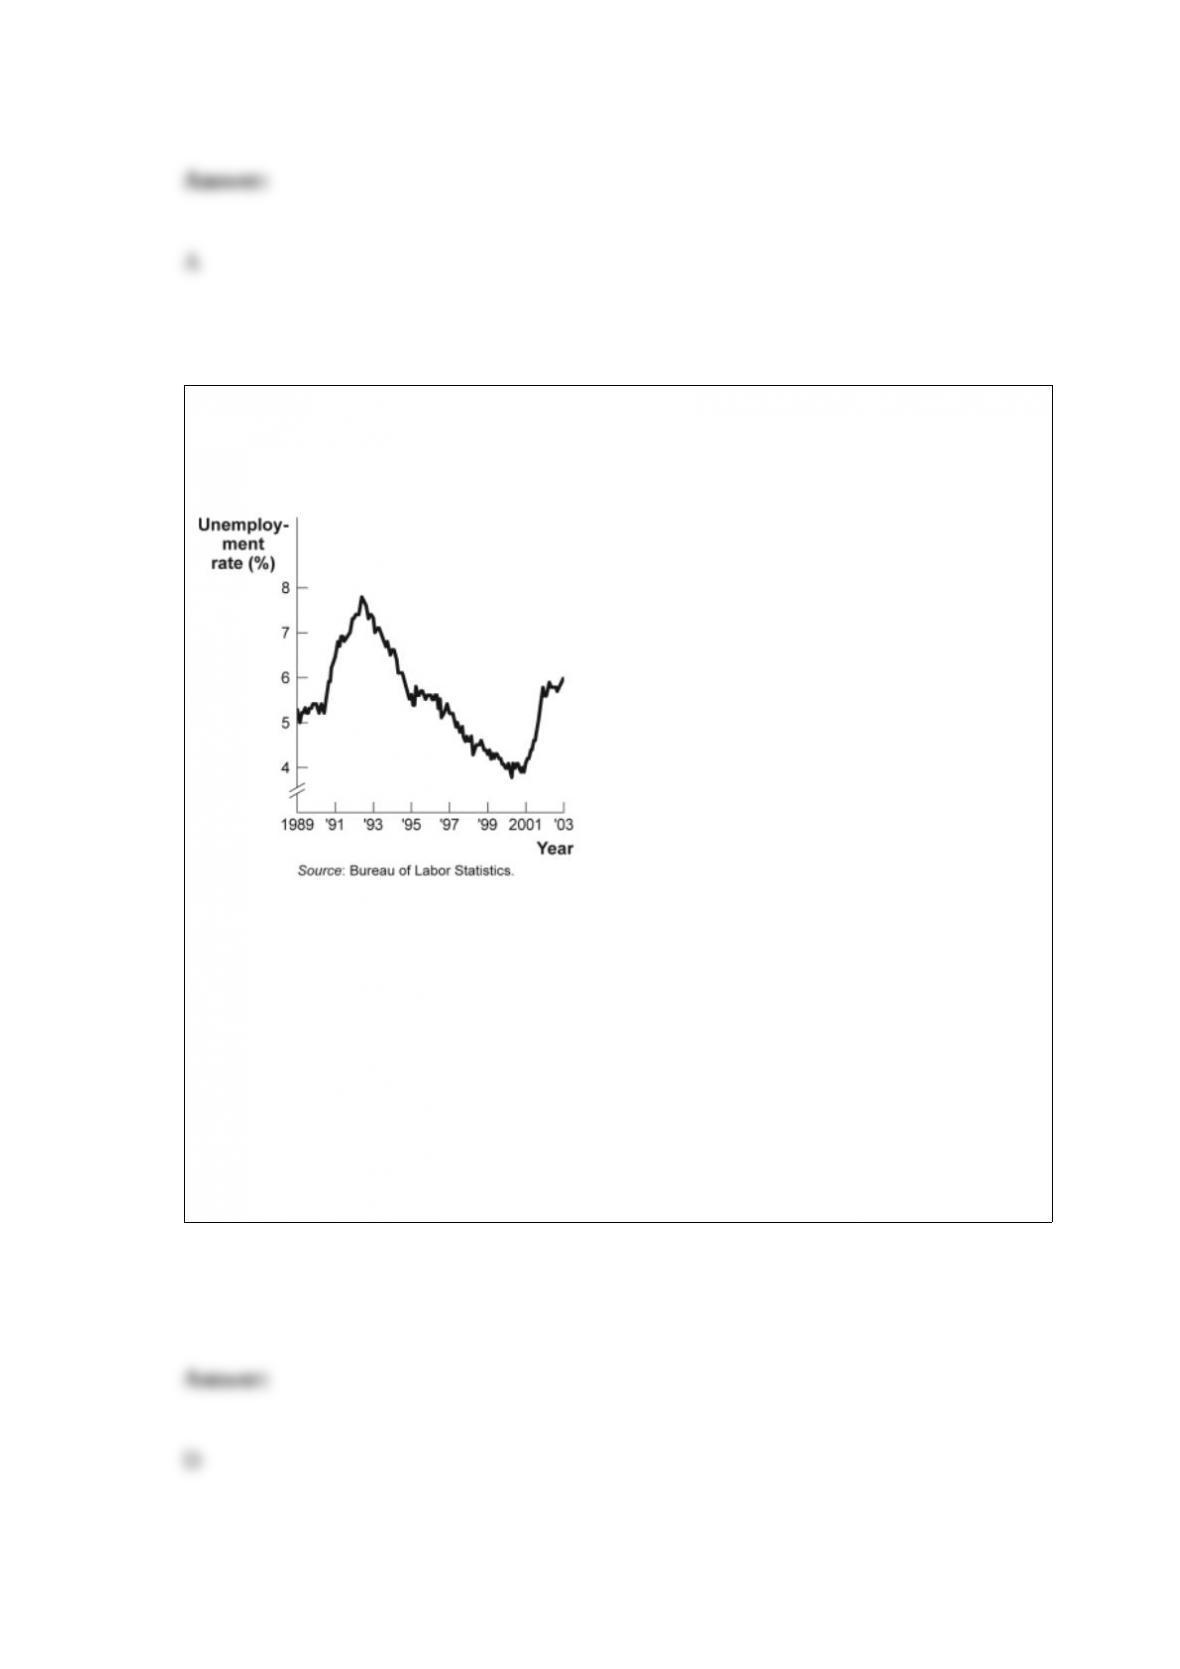
Figure: Unemployment Rate over Time
(Figure: Unemployment Rate over Time) Look
at the figure Unemployment Rate over Time. In the time-series graph, as we move from
the beginning of 2001 to the beginning of 2003, we see that the unemployment rate has
_____ from approximately _____ to approximately _____.
A) decreased; 5%; 4%
B) increased; 5.3%; 7.3%
C) decreased; 7.7%; 5.5%
D) increased; 4%; 6%
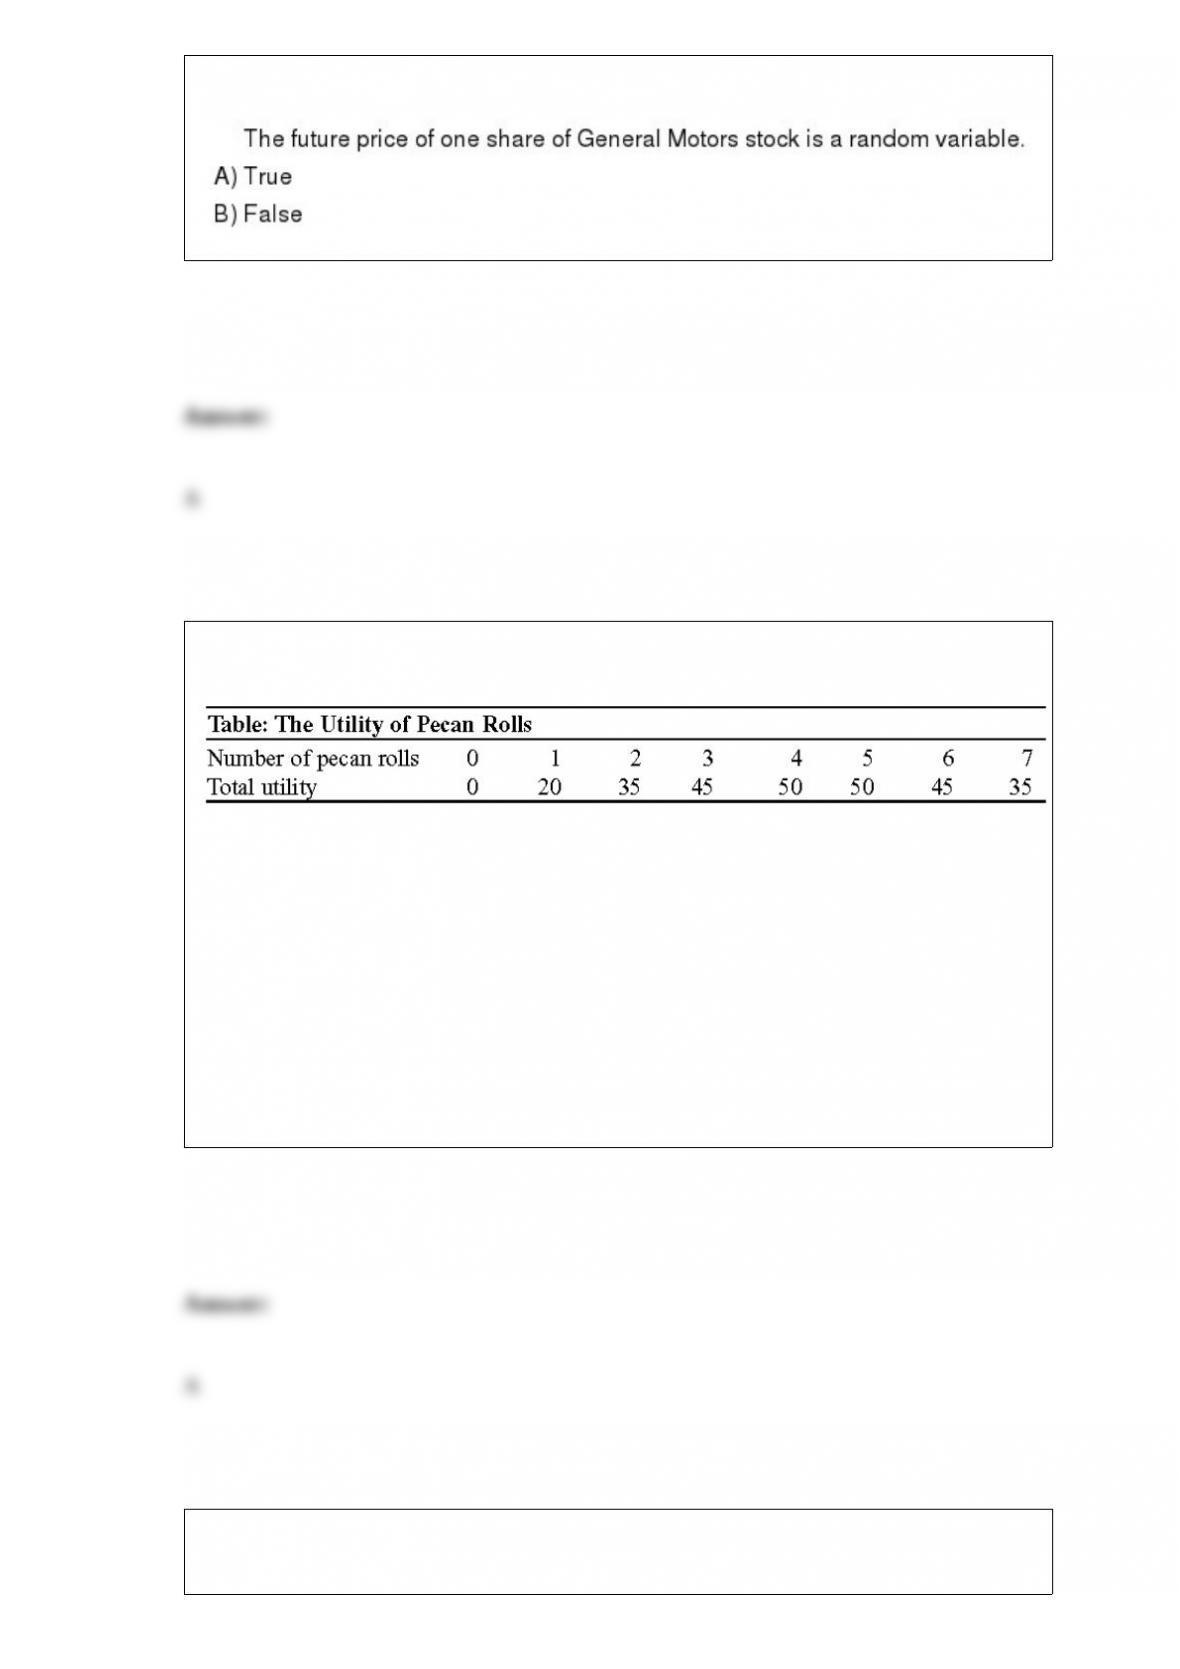
(Table: The Utility of Pecan Rolls) Look at the table The Utility of Pecan Rolls.
Marginal utility begins to diminish at the _____ roll.
A) second
B) third
C) fifth
D) sixth
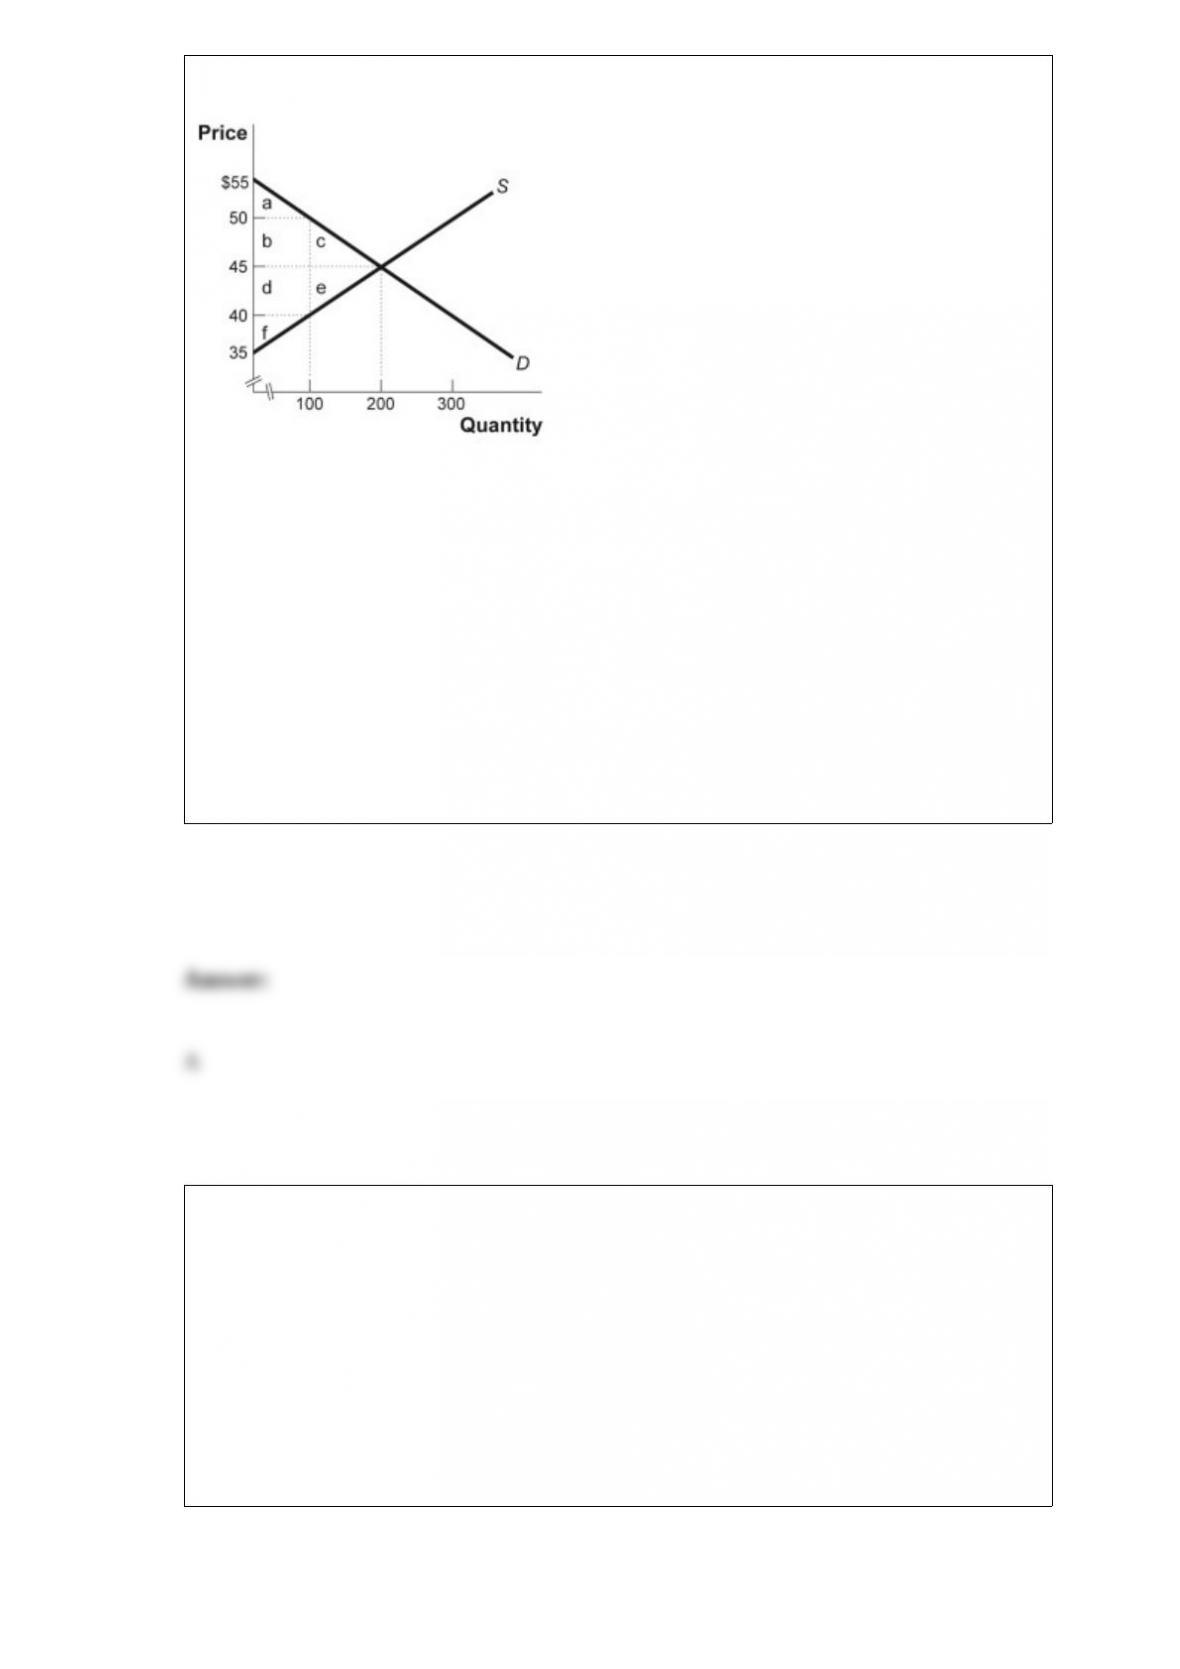
Figure: The Market for Blue Jeans
(Figure: The Market for Blue Jeans) Look at the figure The Market for Blue Jeans. The
government recently levied a $10 tax on the producers of blue jeans. What area or areas
in the graph identify the loss of producer surplus due to the tax?
A) d + e
B) e
C) d
D) d + e + f
Nara has gone to three movies this week. She has some extra money, so she decides to
go to another. This statement best represents this economic concept:
A) Resources are scarce.
B) The real cost of something is what you must give up to get it.
C) “How much” is a decision at the margin.
D) There are gains from trade.
No individual is willing to pay to provide the efficient level of a public good, since the:
A) marginal cost of production is zero.
B) good will be nonrival and thus underconsumed.
C) individual’s marginal benefit is less than the marginal social benefit.
D) marginal benefit of allowing one more individual to consume the good is zero.
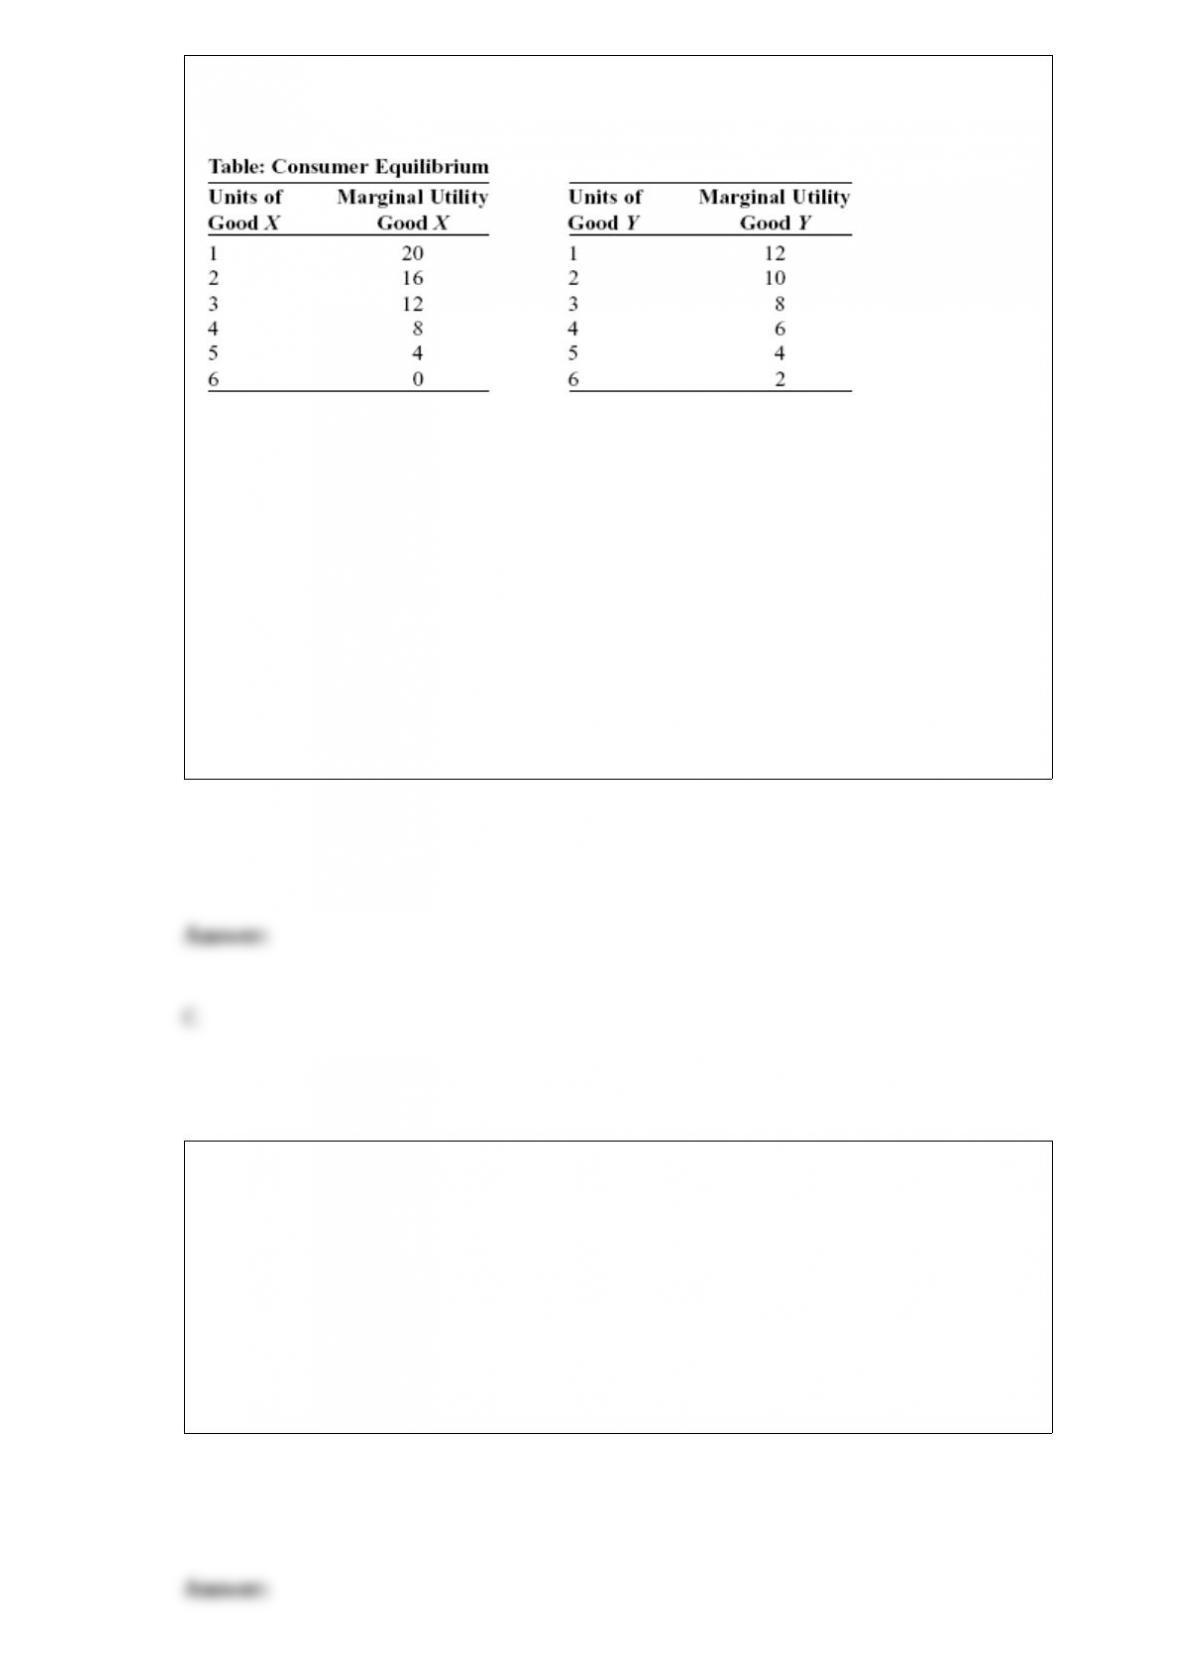
(Table: Consumer Equilibrium) Look at the table Consumer Equilibrium. Assume that
goods X and Y both cost $1 per unit and you have $7 to spend on both goods. To
maximize utility, you would consume _____ units of X and _____ units of Y.
A) 2; 5
B) 3; 4
C) 4; 3
D) 5; 2
The largest component of the factor distribution of income in the United States is:
A) interest and rents.
B) taxes.
C) corporate profits.
D) compensation of employees.
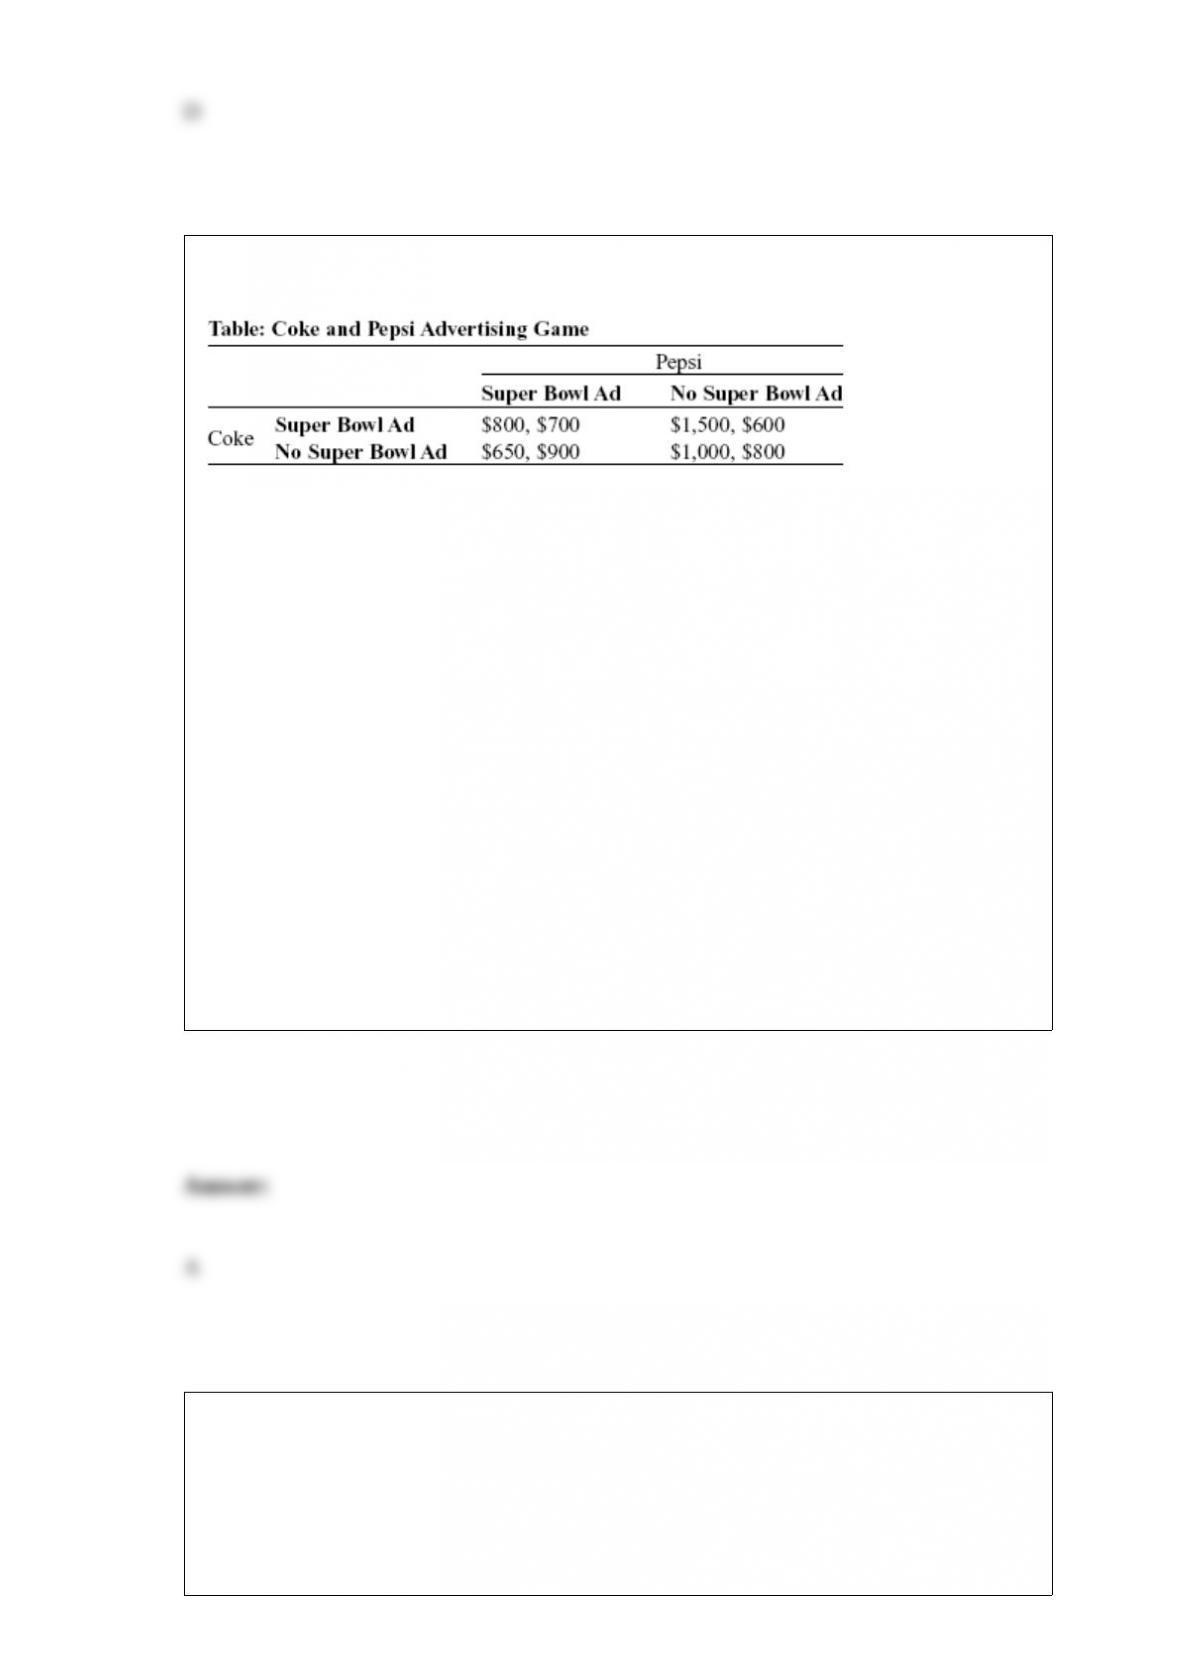
(Table: Coke and Pepsi Advertising Game) Look at the table Coke and Pepsi
Advertising Game. The soft-drink industry is dominated by Coke and Pepsi, and each
firm spends a lot of money on advertising. Suppose each firm is considering a costly
television commercial during halftime of the Super Bowl. The table shows the payoff
matrix of profits that each firm would receive from its advertising decision, given the
advertising decision of their rival. Profits in each cell of the payoff matrix are given as
(Coke, Pepsi). If each firm makes the decision whether to advertise on the Super Bowl
independently, the Nash equilibrium is for Coke _____ and Pepsi _____ during the
Super Bowl.
A) to advertise; to advertise
B) not to advertise; not to advertise
C) not to advertise; to advertise
D) to advertise; not to advertise
Industries that are made up of many competing producers, each selling a differentiated
product, and whose firms earn zero economic profits in the long run are:
A) perfectly competitive.
B) monopolies.

C) oligopolies.
D) monopolistically competitive.
The principal government agency in the United States responsible for enforcing
national environmental policies is the:
A) Department of Agriculture.
B) Department of the Interior.
C) Environmental Protection Agency.
D) Department of Justice.
Figure: Rent Controls
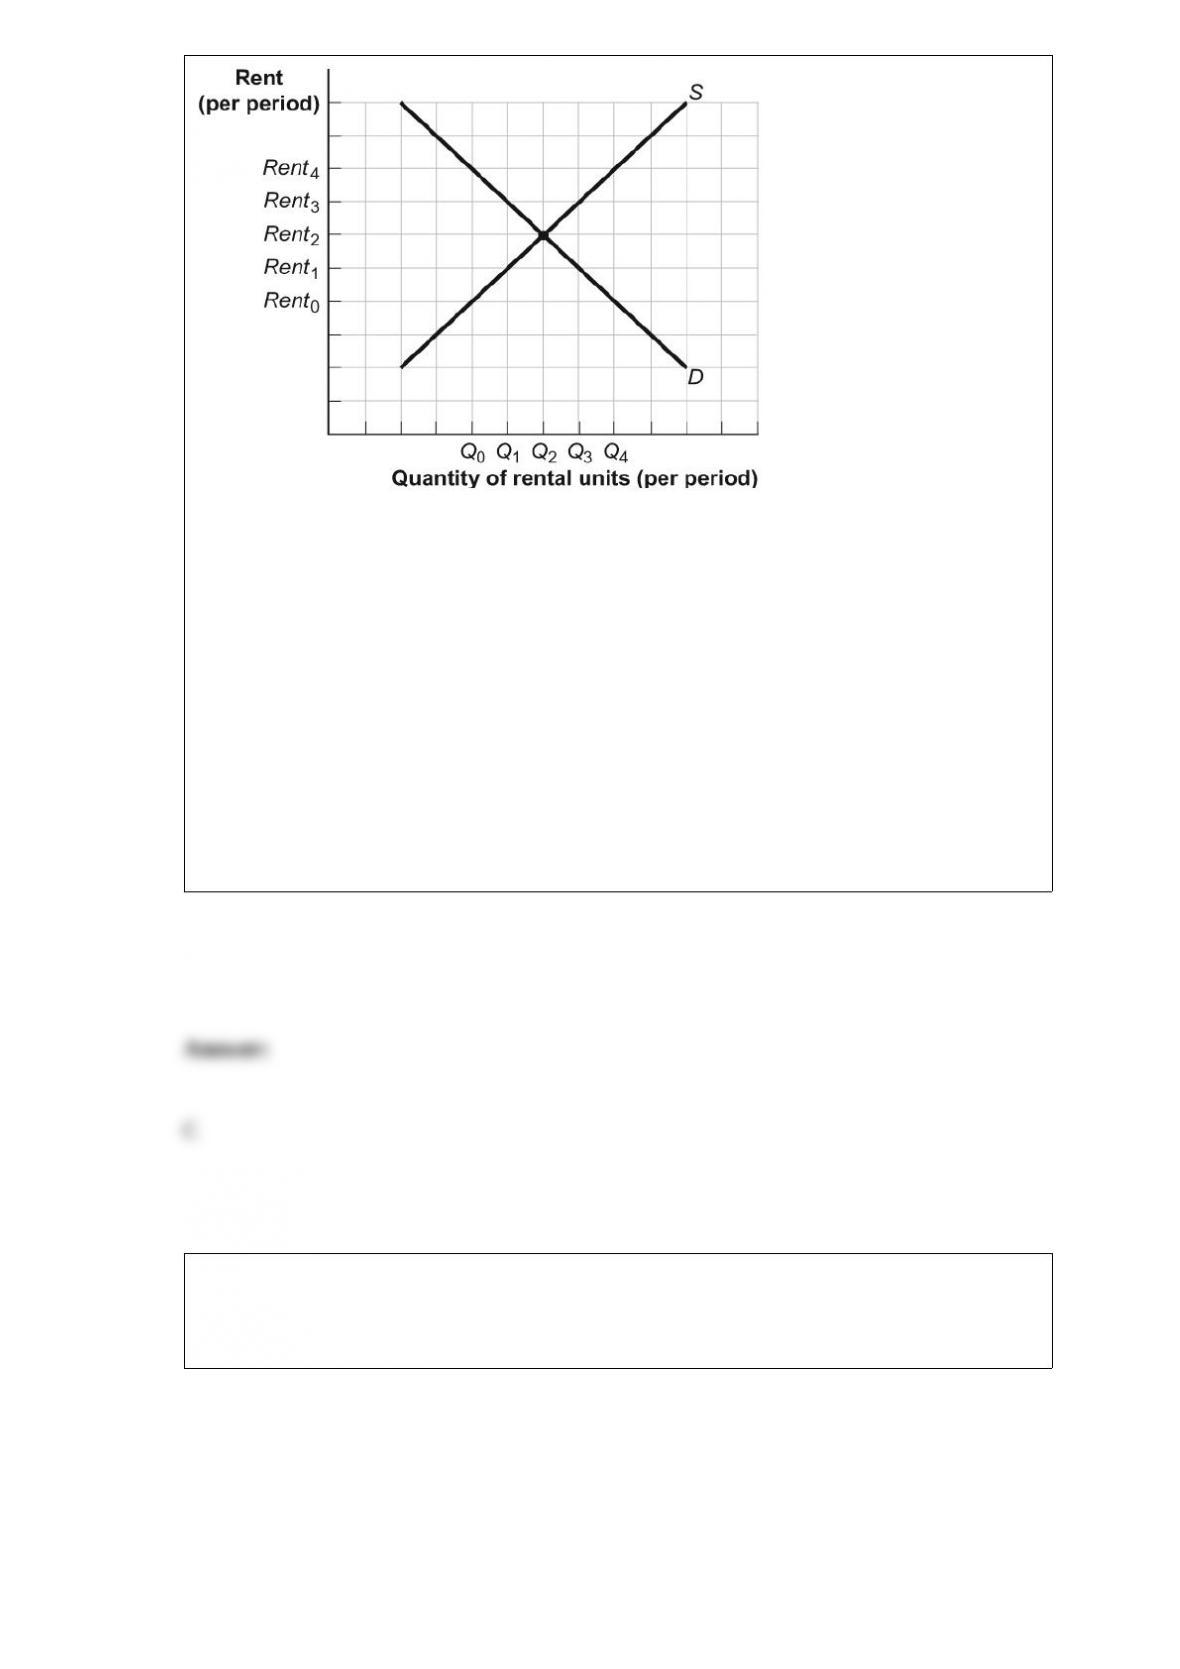
(Figure: Rent Controls) Look at the figure Rent Controls. Suppose that rent controls are
imposed. If the government wanted a rent control ceiling to be effective immediately,
what is one possible price to set?
A) Rent3
B) Rent4
C) Rent1
D) Rent2
Figure: Supply and Demand
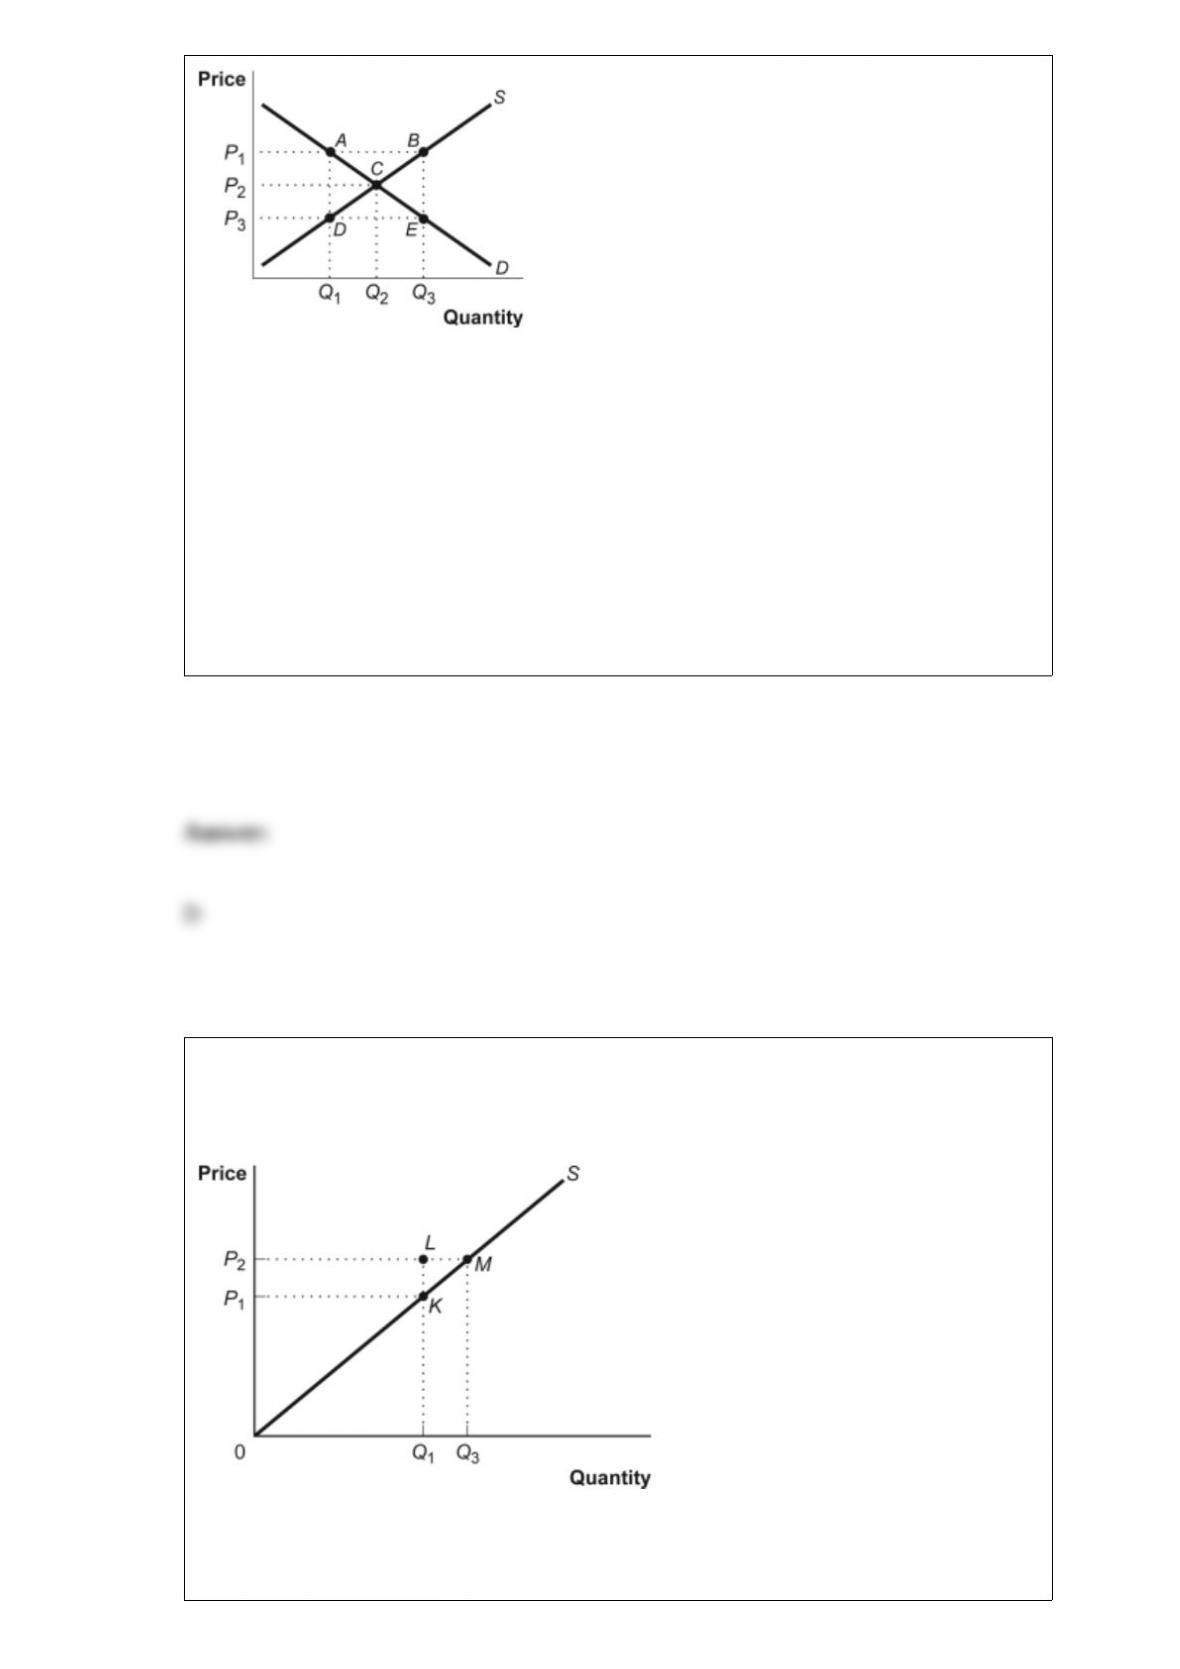
(Figure: Supply and Demand) Look at the figure Supply and Demand. A price ceiling of
P1 causes:
A) a shortage equal to the distance AB.
B) a surplus equal to the distance AB.
C) a shortage equal to the distance DE.
D) no change to the market.
Figure: Producer Surplus II
(Figure: Producer Surplus II) Look at the figure Producer Surplus II. If the price rises
from P1 to P2, producer surplus increases by the area:

A) LMK.
B) P1K0.
C) P2M0.
D) P2P1KM.
In the long run:
A) the firm has time to change the level of all inputs.
B) inputs are neither variable nor fixed.
C) at least one input is free.
D) all inputs are more expensive.
Figure: Payoff Matrix for the United States and the European Union
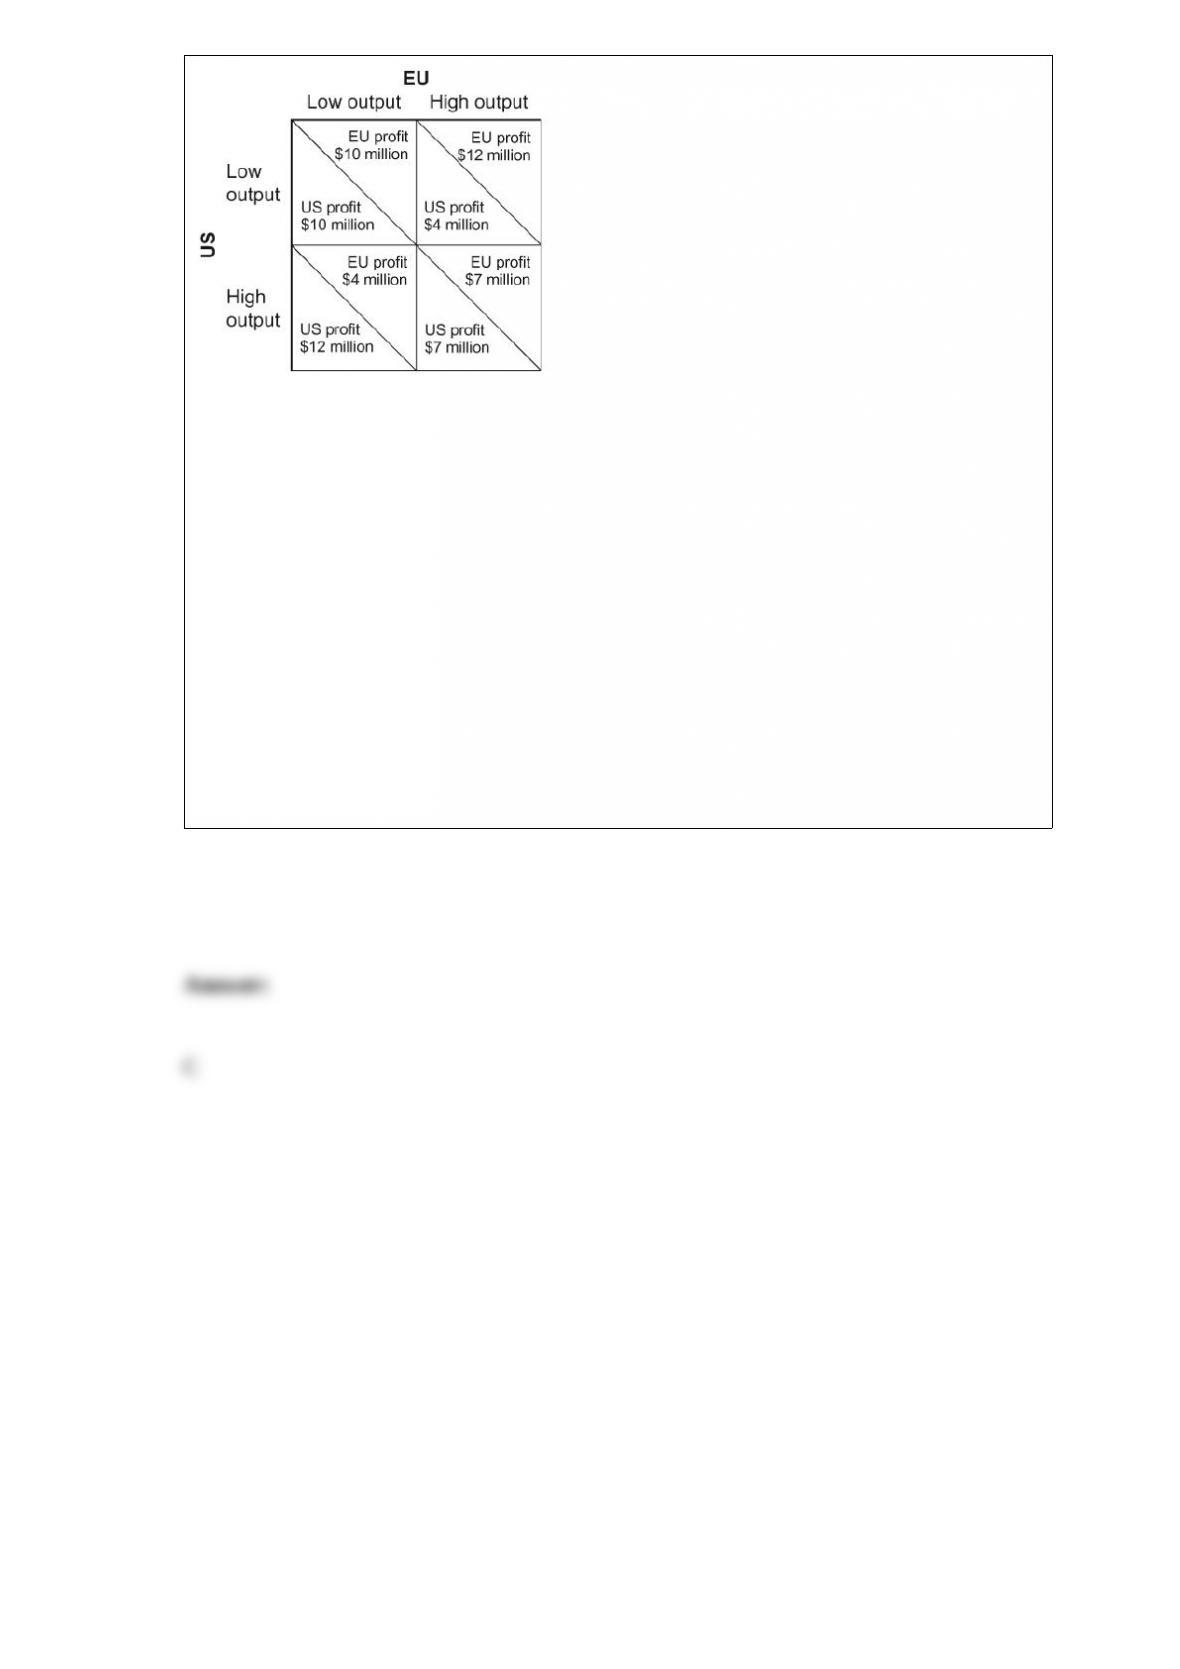
(Figure: Payoff Matrix for the United States and the European Union) Look at the
figure Payoff Matrix for the United States and the European Union. Suppose that the
United States and the European Union both produce corn, and each region can make
more profit if output is limited and the price of corn is high. The joint
profit-maximizing combination is for the United States to produce a _____ output and
the European Union to produce a _____ output.
A) high; high
B) high; low
C) low; low
D) low; high