
With the increased usage of cell phone services, what has happened to the price
elasticity of demand for land-line telephone services?
A) It has become more price inelastic.
B) It has become more price elastic.
C) It has become more income elastic.
D) The absolute value of the price elasticity coefficient has probably gone down.
Which of the following best explains the negative slope of the short-run Phillips curve?
A) Weak growth in aggregate demand keeps the economy below potential GDP, so
unemployment rises but inflation falls.
B) Aggregate demand grows so quickly that the inflation rate rises as unemployment
rises.
C) Long-run aggregate supply increases quickly enough that inflation falls as
unemployment also falls.
D) Short-run aggregate supply increases at the same pace as aggregate demand
increases so that inflation and unemployment do not change.
Table 2-12
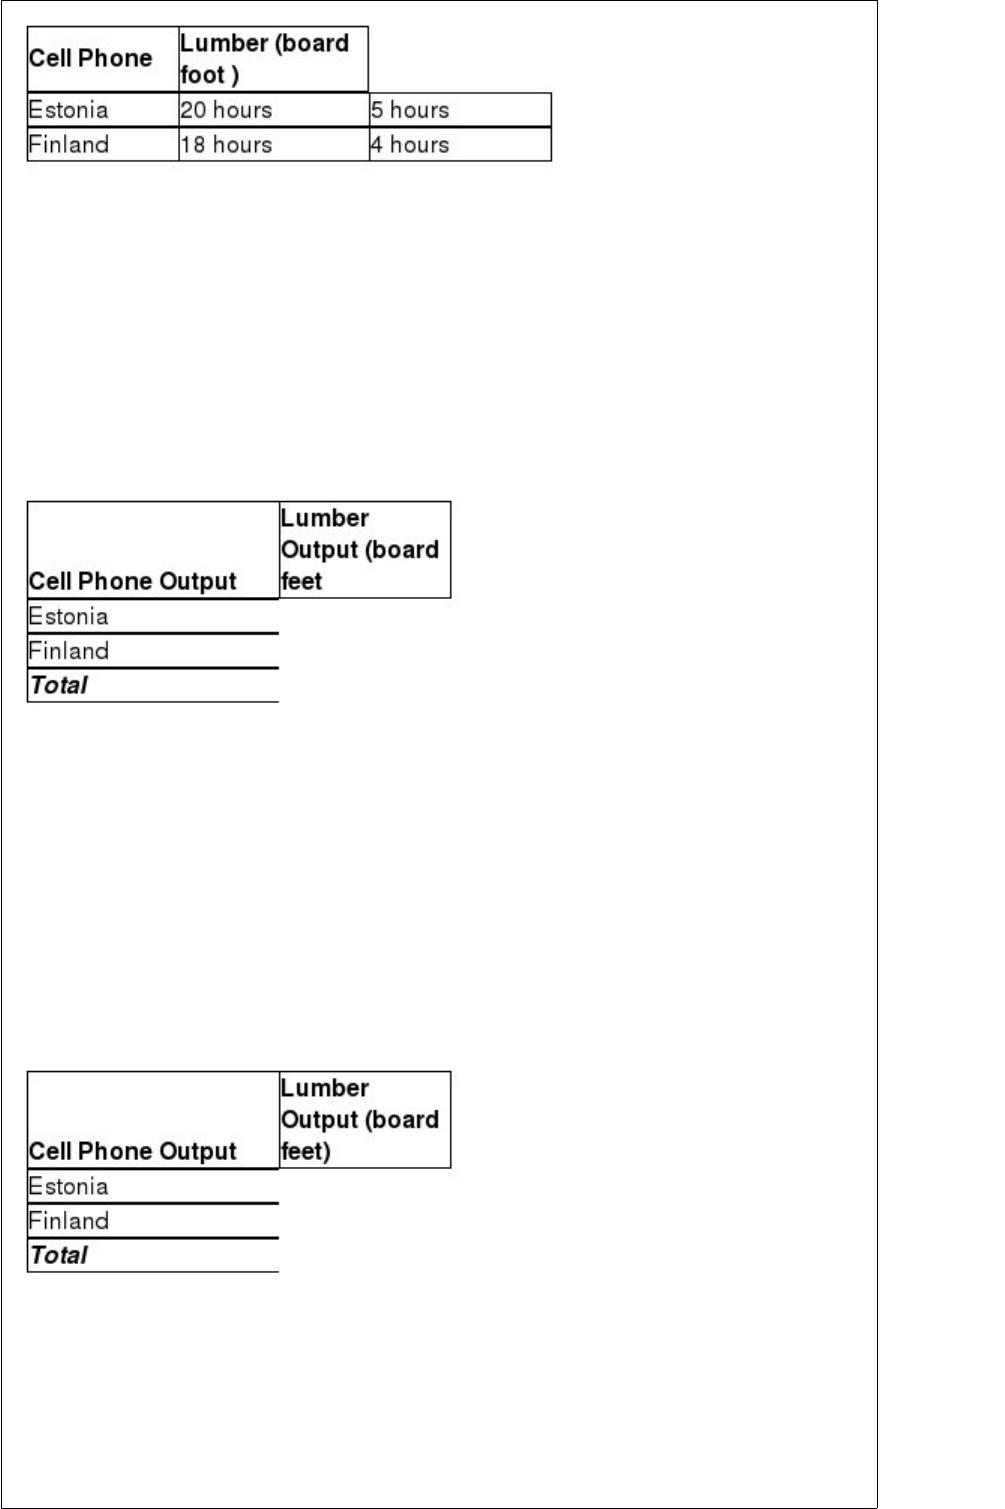
This table shows the number of labor hours required to produce a cell phone and a
board foot of lumber in Estonia and Finland. a. If each country has a total of 3,600 labor
hours to devote to the production of the two goods, draw the production possibilities
frontier for each country. Put “Cell Phone” on the horizontal axis and “Lumber” on the
vertical axis. Be sure to identify the intercept values on your graphs.
b. Suppose each country allocates 55% its labor hours to lumber production and 45% to
the production of cell phones. Complete Table 2-13 below to show each country’s
output of the two products. Table 2-13: Production and Consumption with no Trade
c. If the two countries do not trade and consume whatever they produce, identify the
current production and consumption point for each country on their respective
production possibilities frontiers. Label Estonia’s consumption point “E” and Finland’s
consumption point, “F.”
d. Suppose the two countries specialize and trade. Who should produce cell phones and
who should produce lumber? Explain your answer.
e. Complete Table 2-14 below to show each country’s output with specialization. Table
2-14: Output with Specialization
f. Did specialization increase the combined output for the two countries without any
increase in resources? If so, by how much?
g. Suppose Estonia and Finland agree to trade so that in exchange for 400 board feet of
lumber, the exporter of lumber receives 90 cell phones. Complete Table 2-15 below to
show each country’s consumption bundle after trade. Table 2-15: Consumption with
Trade
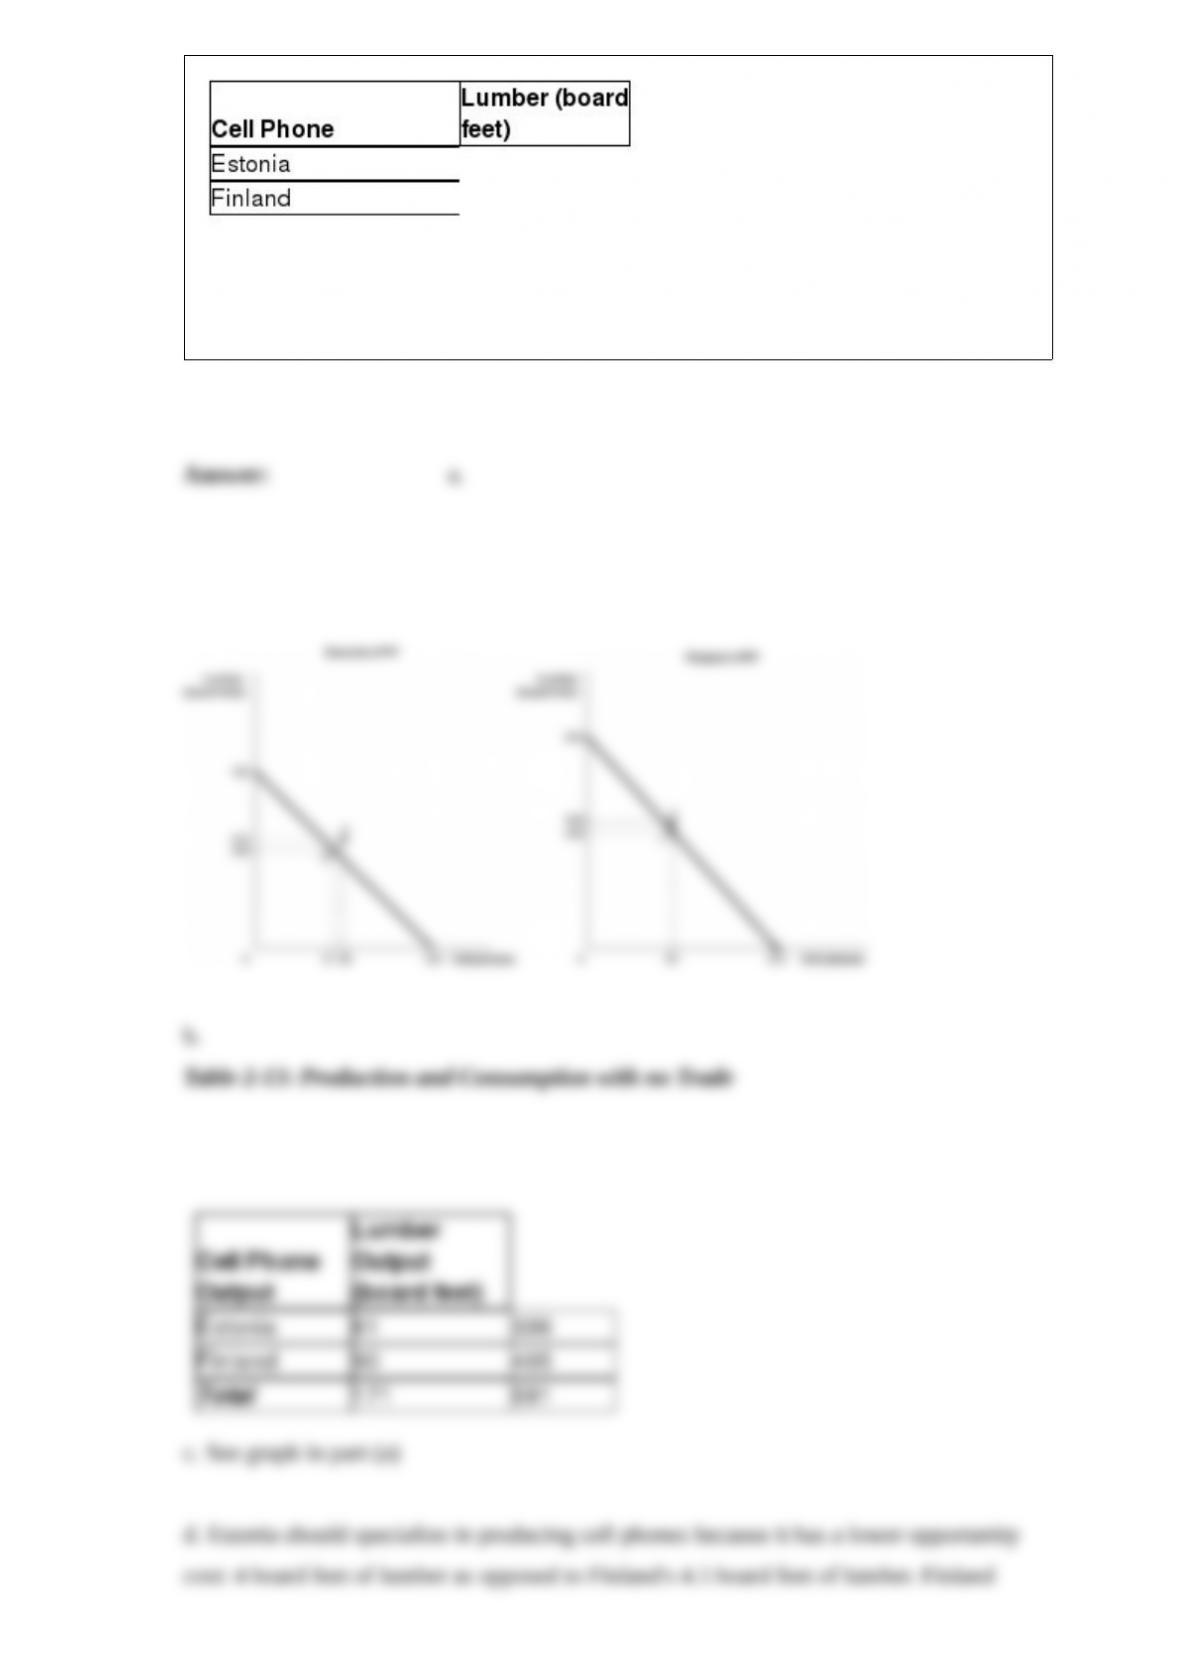
h. Show the consumption points after trade on each country’s production possibilities
frontier. Label these points “X” for Estonia and “Y” for Finland.
i. Has trade made the two countries better off? Explain your answer.
Which of the following is not an example of a trade restriction?
A) tariffs
B) quotas and voluntary export restraints
C) legislation requiring that cars sold in a country have a 50 percent domestic content
D) consumer preferences for goods produced domestically
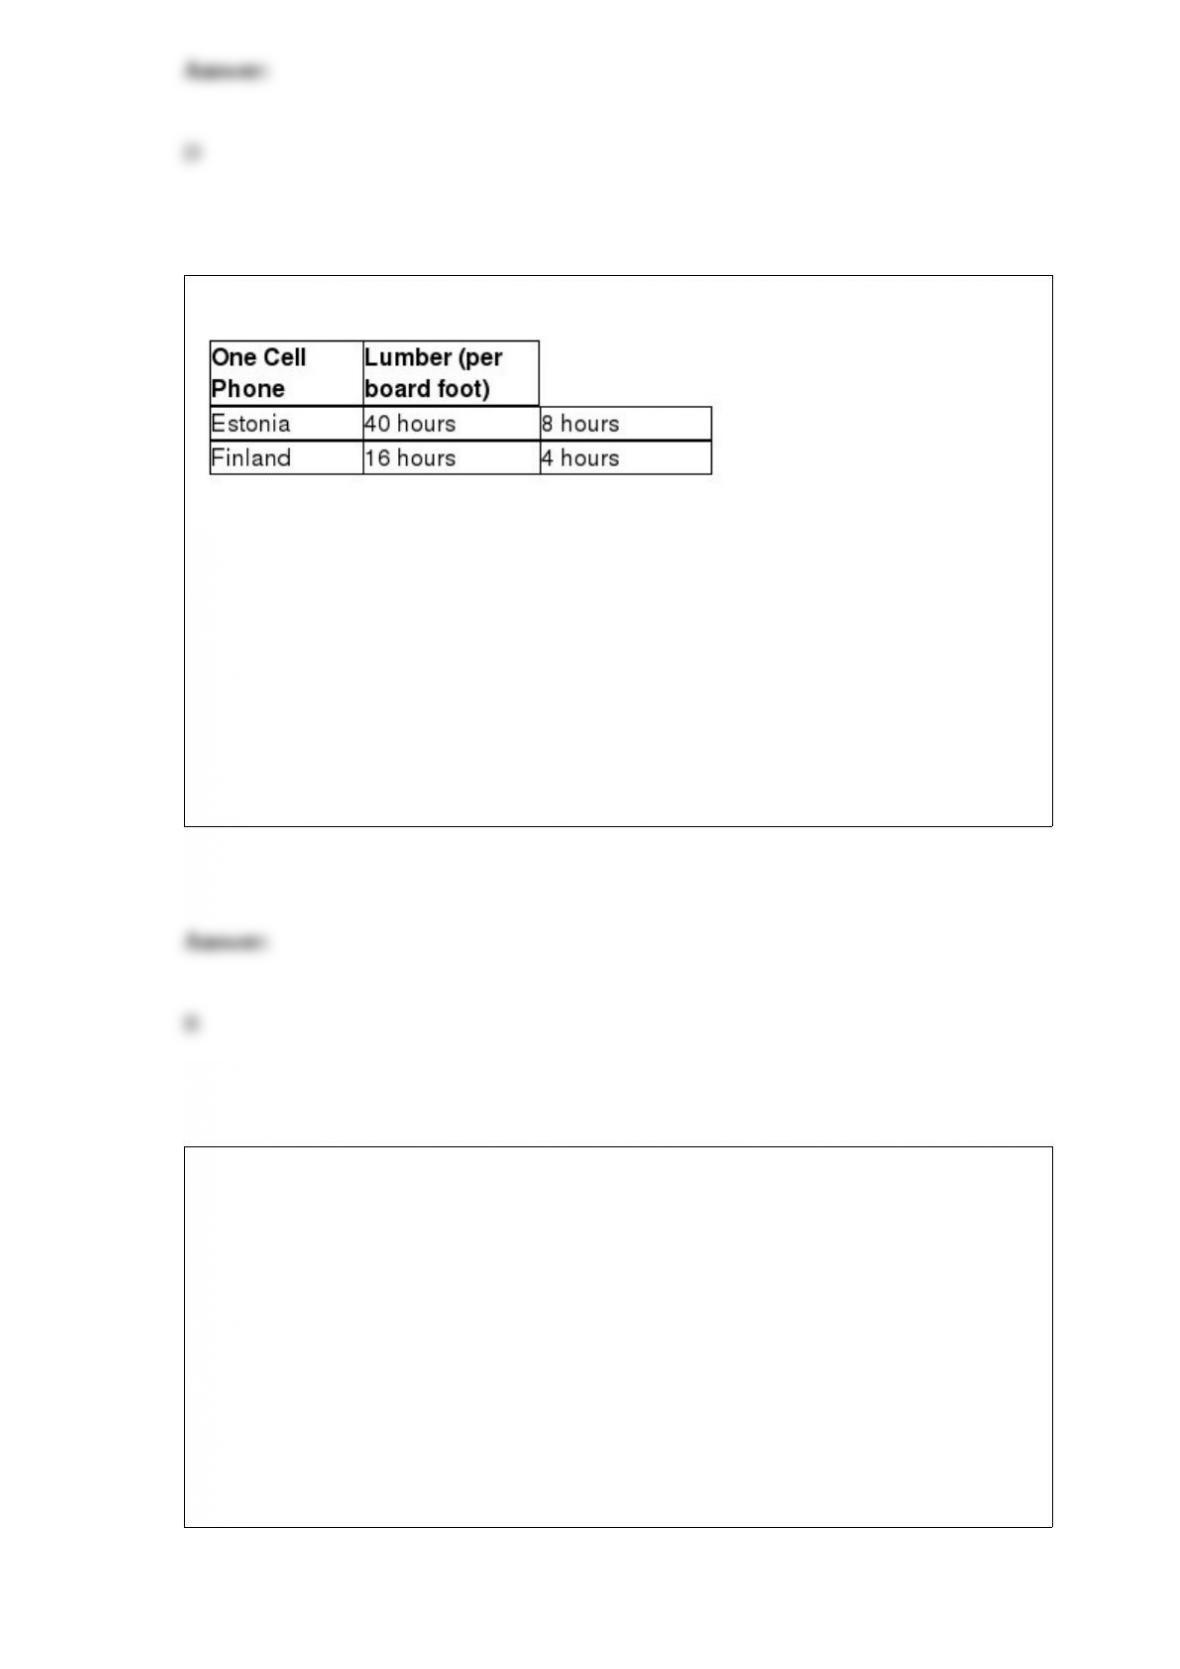
Table 2-16
Table 2-16 shows the number of labor hours required to produce a cell phone and a
board foot of lumber in Estonia and Finland. Estonia has a comparative advantage in
the production of
A) both products.
B) lumber.
C) cell phones.
D) neither product.
If Valerie purchases ankle socks at $5 and gets 25 units of marginal utility from the last
unit, and bandanas at $3 and gets 12 units of marginal utility from the last bandana
purchased, she
A) is maximizing total utility and does not want to change their consumption of ankle
socks or bandanas.
B) wants to consume more ankle socks and fewer bandanas.
C) wants to consume more of bandanas and fewer ankle socks.
D) wants to consume less of both ankle sock and bandanas.
Consumer surplus in a market for a product would be equal to the area under the
demand curve if
A) producer surplus was equal to zero.
B) marginal cost was equal to the market price.
C) the product was produced in a perfectly competitive market.
D) the market price was zero.
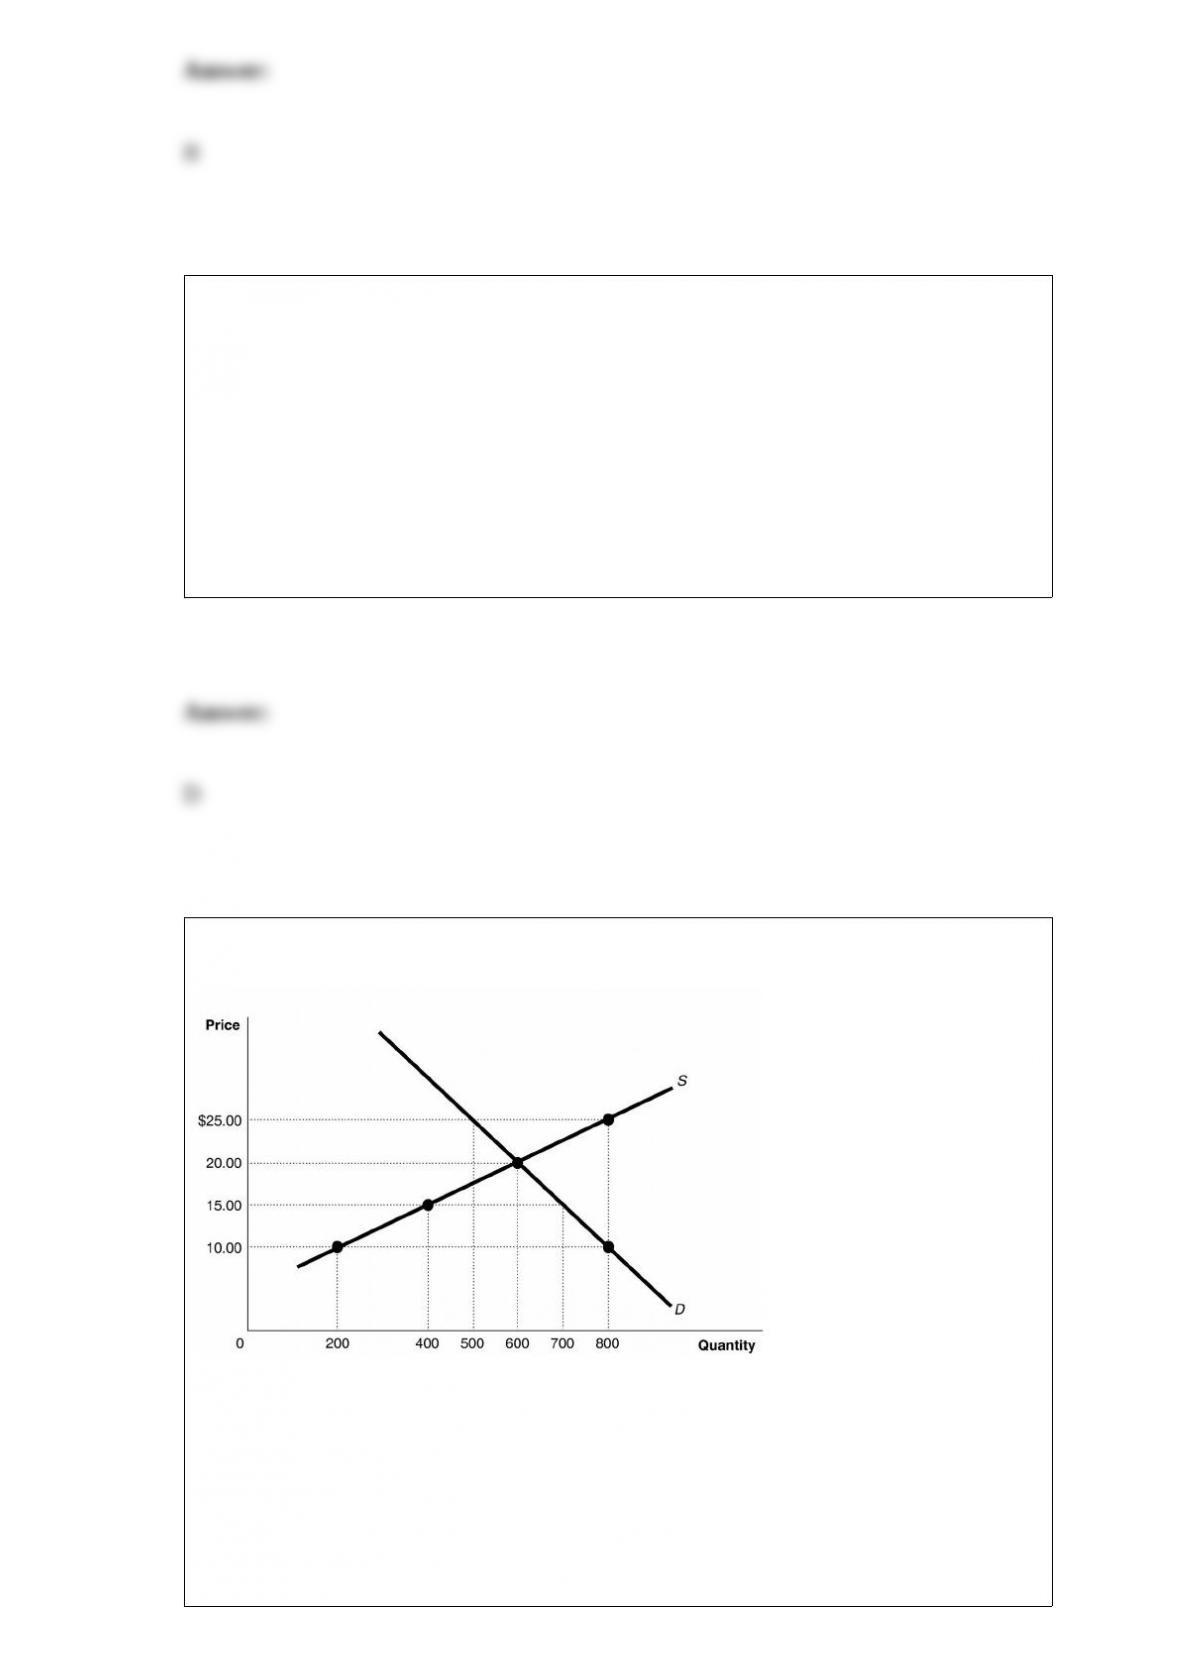
Figure 3-4
At a price of $15, how many units will be sold?
A) 300
B) 400
C) 600

D) 700
Which of the following would decrease the value of the dollar in the long run?
A) a decrease in inflation in the United States relative to other countries
B) a decrease in the demand for American goods relative to goods from other countries
C) an increase in U.S. tariffs on foreign goods
D) a decrease in the supply of dollars on the foreign exchange market
The long run refers to a time period
A) during which a firm is able to purchase all of its inputs, including its plant and
equipment.
B) long enough for a firm to vary all of its inputs, to adopt new technology and change
the size of its physical plant.
C) long enough for a firm to pay all of its creditors in full.
D) long enough for a firm to change the use of its variable inputs.
a. What is the World Trade Organization?
b. When was it established?
c. How many countries are members of the World Trade Organization?
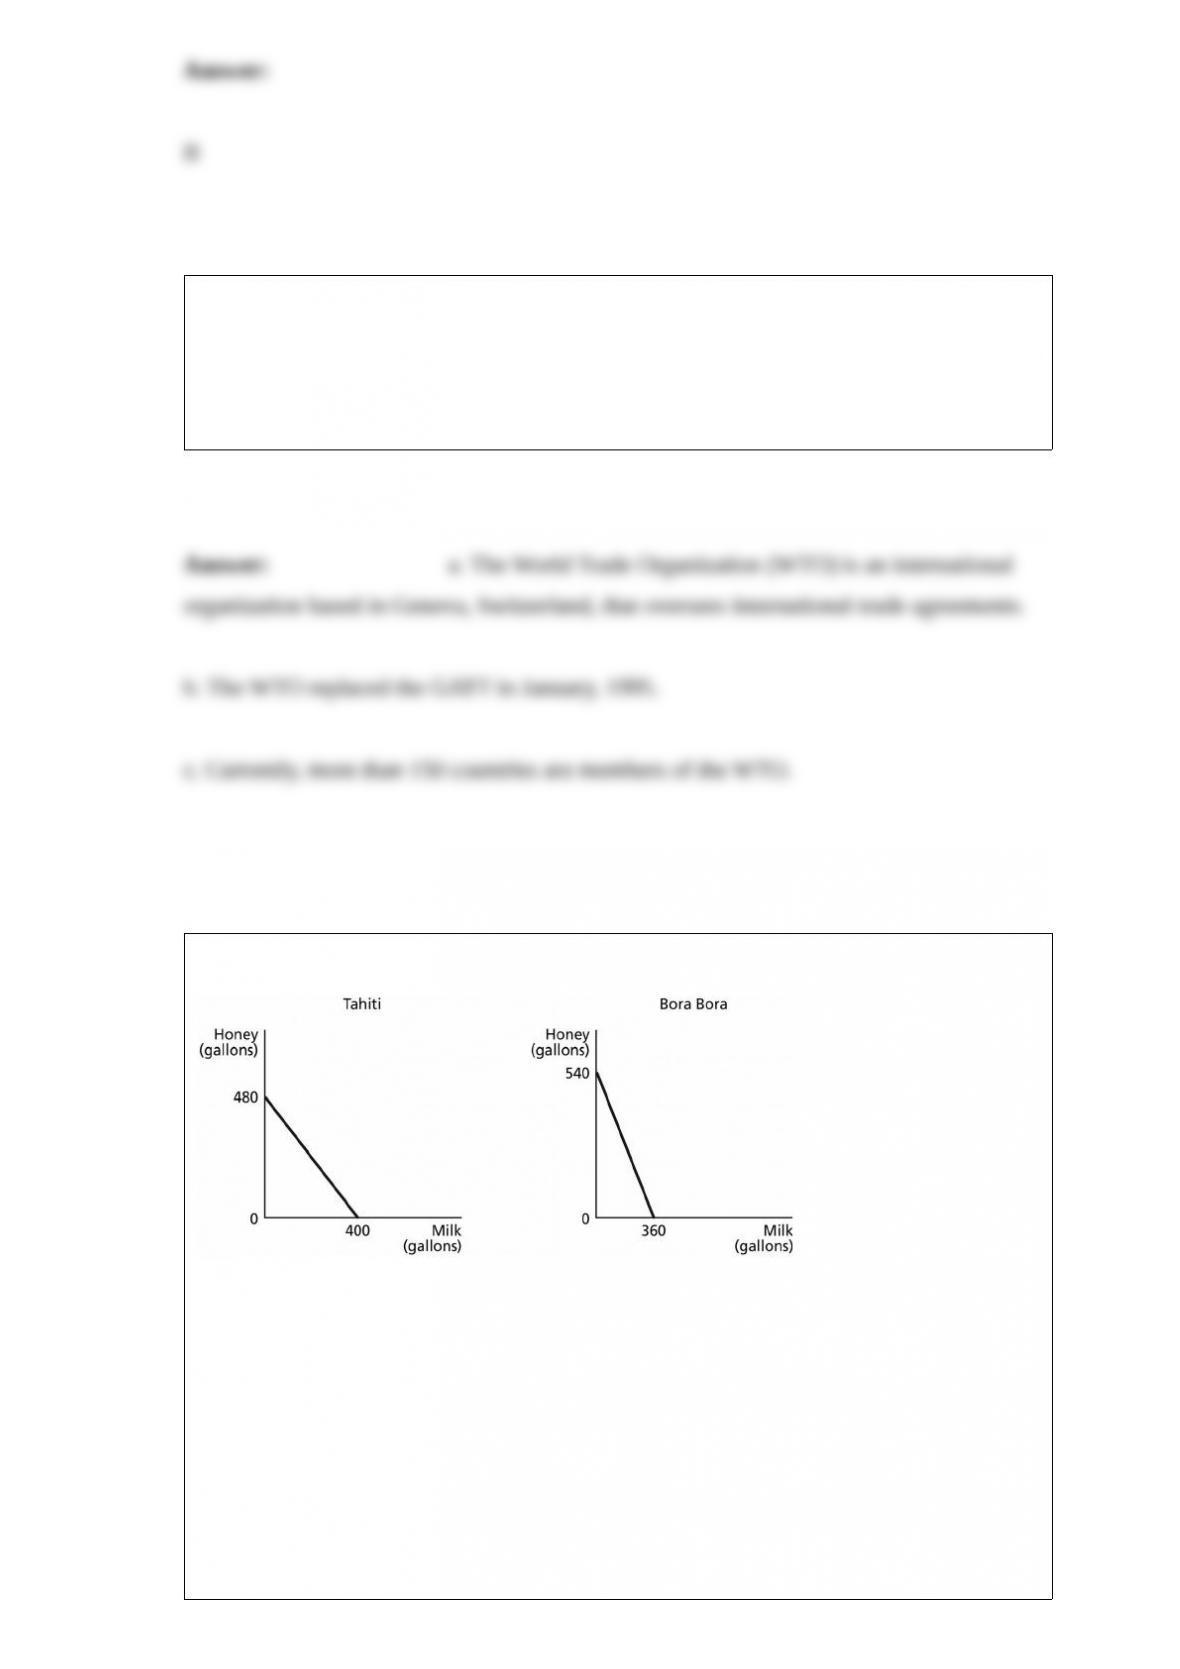
Figure 2-10
Figure 2-10 shows the
production possibilities frontiers for Tahiti and Bora Bora. Each country produces two
goods, milk and honey.
What is the opportunity cost of producing one gallon of milk in Bora Bora?
A) 2/3 gallon of honey
B) 0.8 gallon of honey
C) 1.125 gallons of honey

D) 1.5 gallons of honey
Economists have estimated that the cross-price elasticity of demand between beer and
spirits is -0.50, the income elasticity for spirits is 1.21 and the income elasticity for
wine is 5.03. These elasticities mean that
A) beer and spirits are complements, spirits and wine are luxuries.
B) beer and spirits are normal goods, spirits and wine are luxuries.
C) beer and spirits are complements, spirits are substitutes.
D) beer and spirits are substitutes, spirits and wine are luxuries.
Figure 3-7
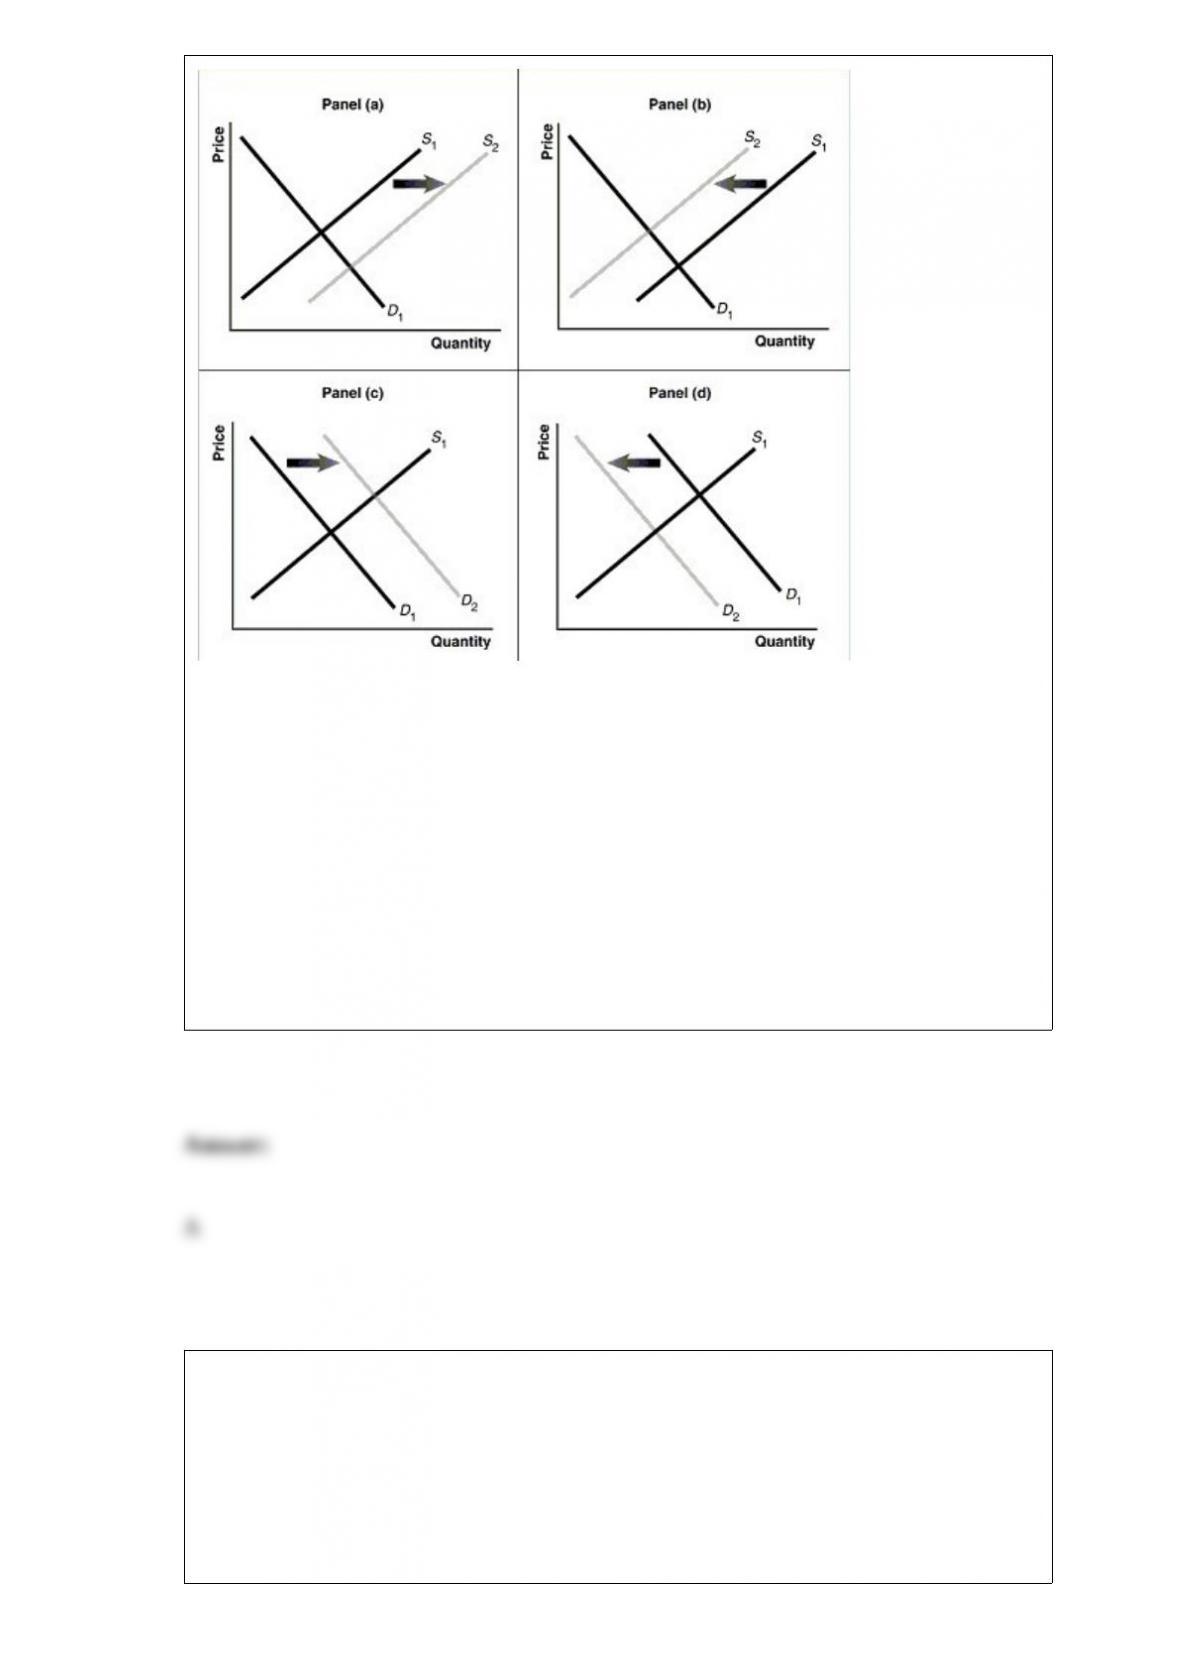
Assume that the graphs in this figure represent the demand and supply curves for
almonds. Which panel best describes what happens in this market when there is an
increase in the productivity of almond harvesters?
A) Panel (a)
B) Panel (b)
C) Panel (c)
D) Panel (d)
The marginal tax rate is
A) the amount of taxes paid as a percentage of income.
B) the amount of per-capita taxes paid.
C) the amount of taxes paid as a percentage of gross domestic product (GDP).

D) the fraction of each additional dollar of income that must be paid in taxes.
Inflation tends to ________ during the expansion phase of the business cycle and
________ during the recession phase of the business cycle.
A) increase; decrease
B) decrease; increase
C) decrease; decrease further
D) increase; increase further
If 11 workers can produce a total of 54 units of a product and a 12th worker has a
marginal product of 6 units, then the average product of 12 workers is
A) 60 units.
B) 54 units.
C) 48 units.
D) 5 units.
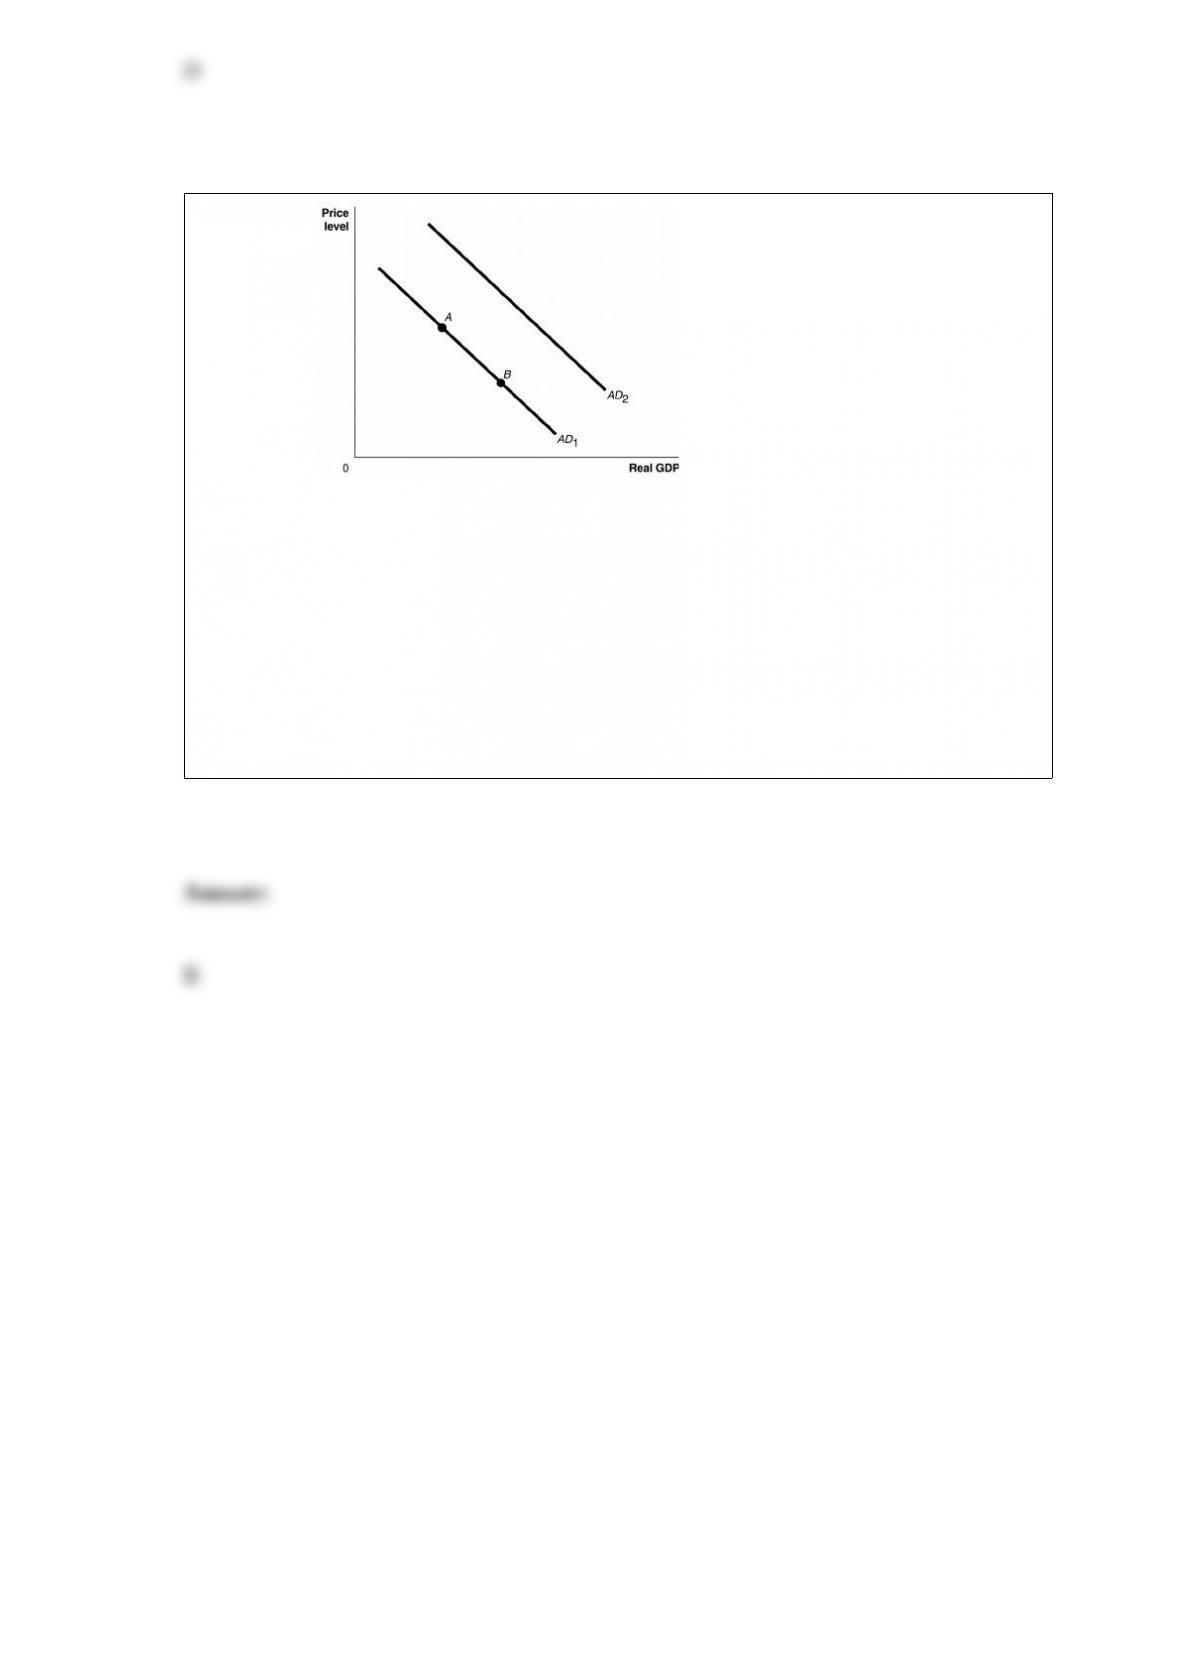
Figure 24-1
Ceteris paribus, an increase in interest rates would be represented by a movement from
A) AD1 to AD2.
B) AD2 to AD1.
C) point A to point B.
D) point B to point A.