In perfect competition, the firm produces the output such that _____, and in monopoly,
the firm produces the output such that _____.
A) P > MR = MC; P = MR = MC
B) P = MR = MC; P < MR = MC
C) P = MR = MC; P > MR = MC
D) P = MR = MC; P = MR = MC
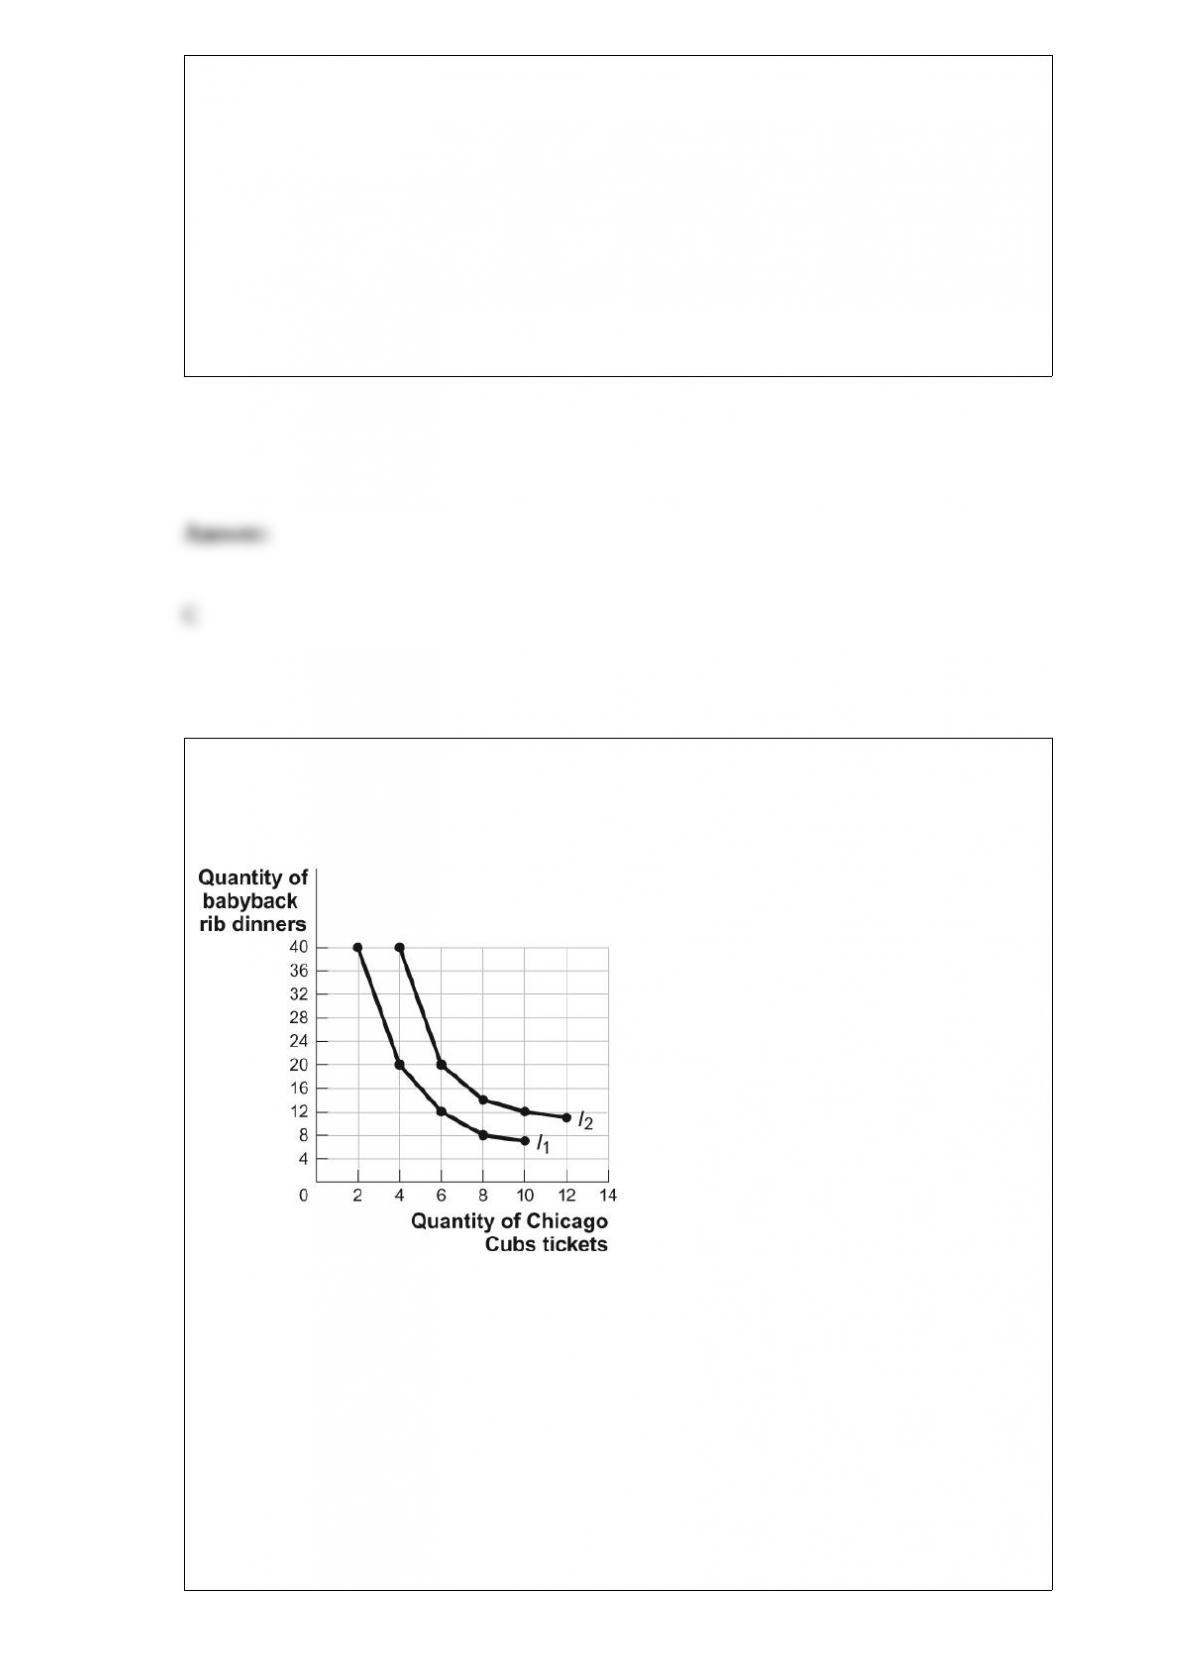
Figure: The Indifference Curve Map II
(Figure: The Indifference Curve Map II) Look at the figure The Indifference Curve Map
II. Sara enjoys attending Chicago Cubs baseball games and eating baby back rib
dinners. The figure shows two of her indifference curves for Cubs tickets and baby back
rib dinners. Which of the following combinations gives Sara the highest level of utility?
A) 40 baby back rib dinners and 2 Cubs tickets
B) 20 baby back rib dinners and 4 Cubs tickets
C) 12 baby back rib dinners and 10 Cubs tickets
D) All combinations give the same level of utility.
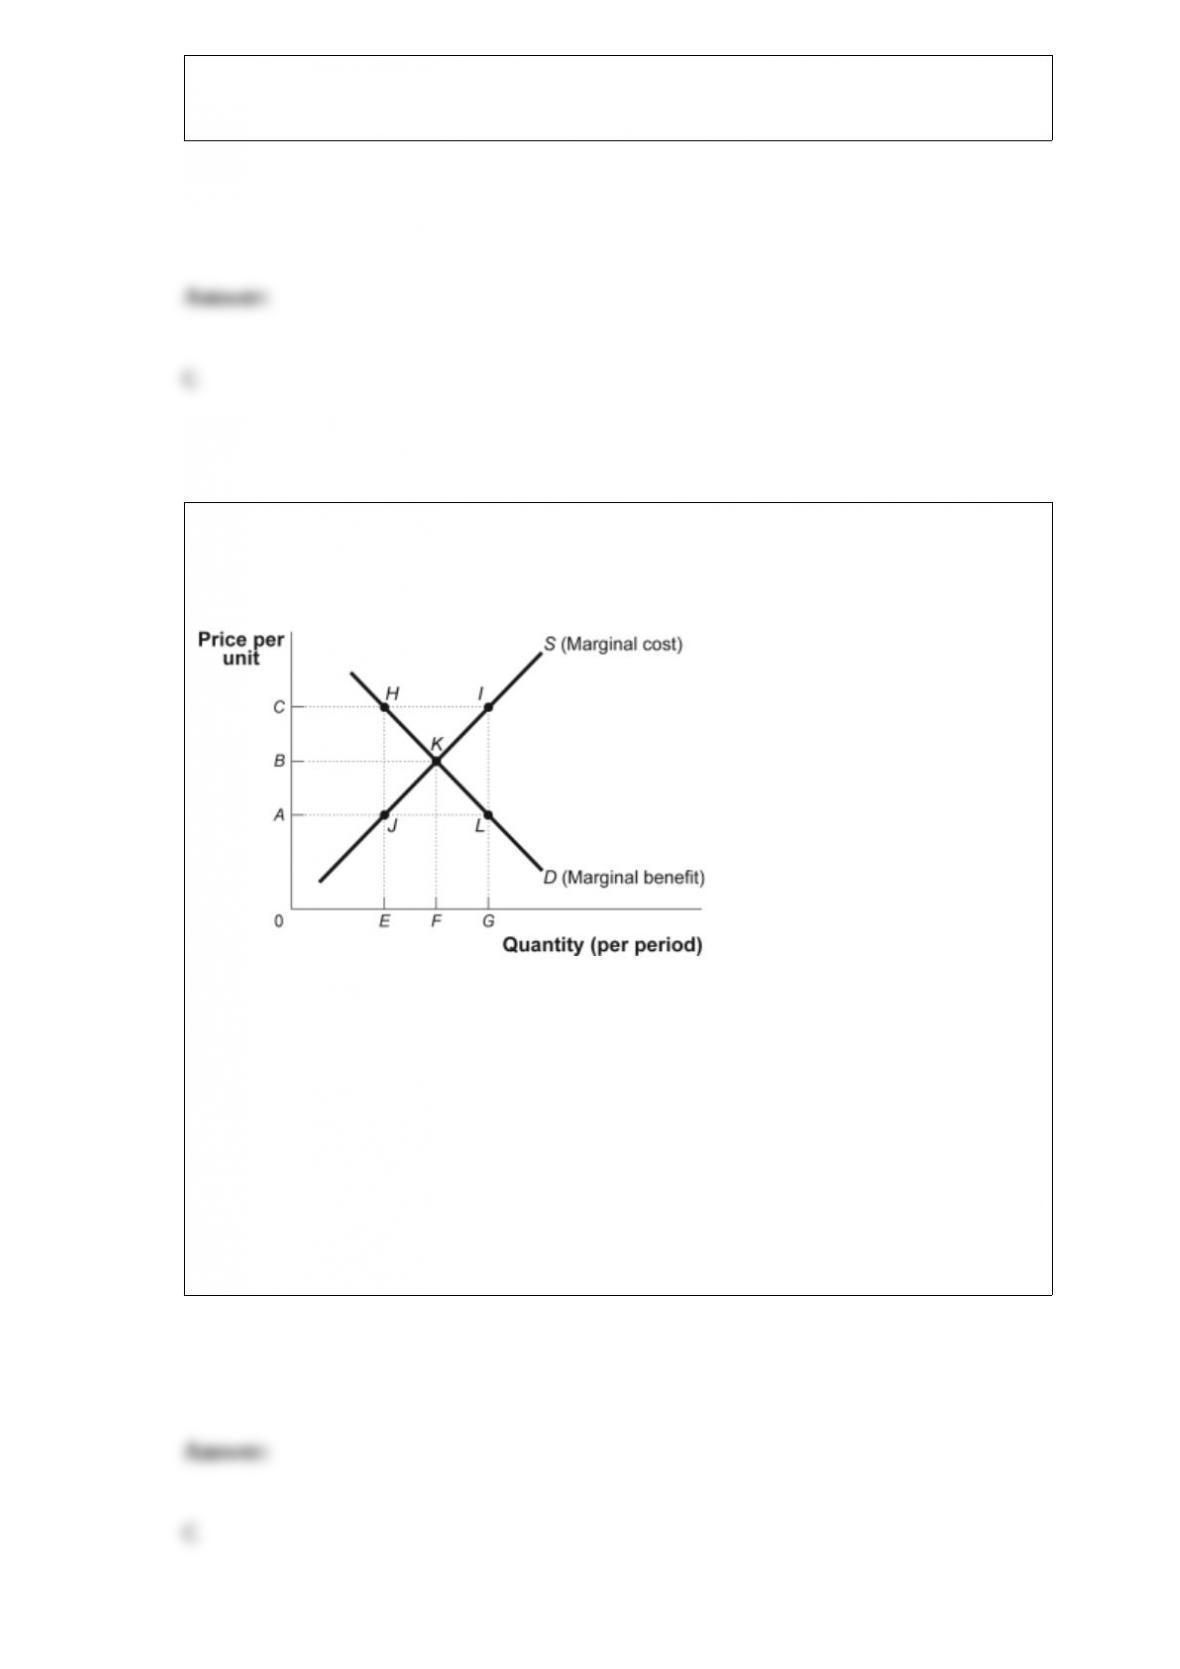
Figure: Market Failure
(Figure: Market Failure) In the figure Market Failure, the equilibrium price is _____
and the equilibrium quantity is _____ for a competitive market.
A) A; E
B) A; G
C) B; F
D) C; E

(Table: Value of the Marginal Product of Labor and Demand) In the figure Value of the
Marginal Product of Labor and Demand, the total product of labor is shown for the
hourly production of power cords. Assume that the market for power cords is perfectly
competitive. If the price of a power cord is $2, the value of the marginal product for the
fifth worker is:
A) $0.
B) $20.
C) $40.
D) $60.
A positive relationship between swimsuits purchased and ice cream purchased could be
the result of:
A) reverse causality.
B) a magnified scale on the swimsuit axis.
C) a truncation of the ice cream axis.
D) an omitted variable, such as the external temperature.
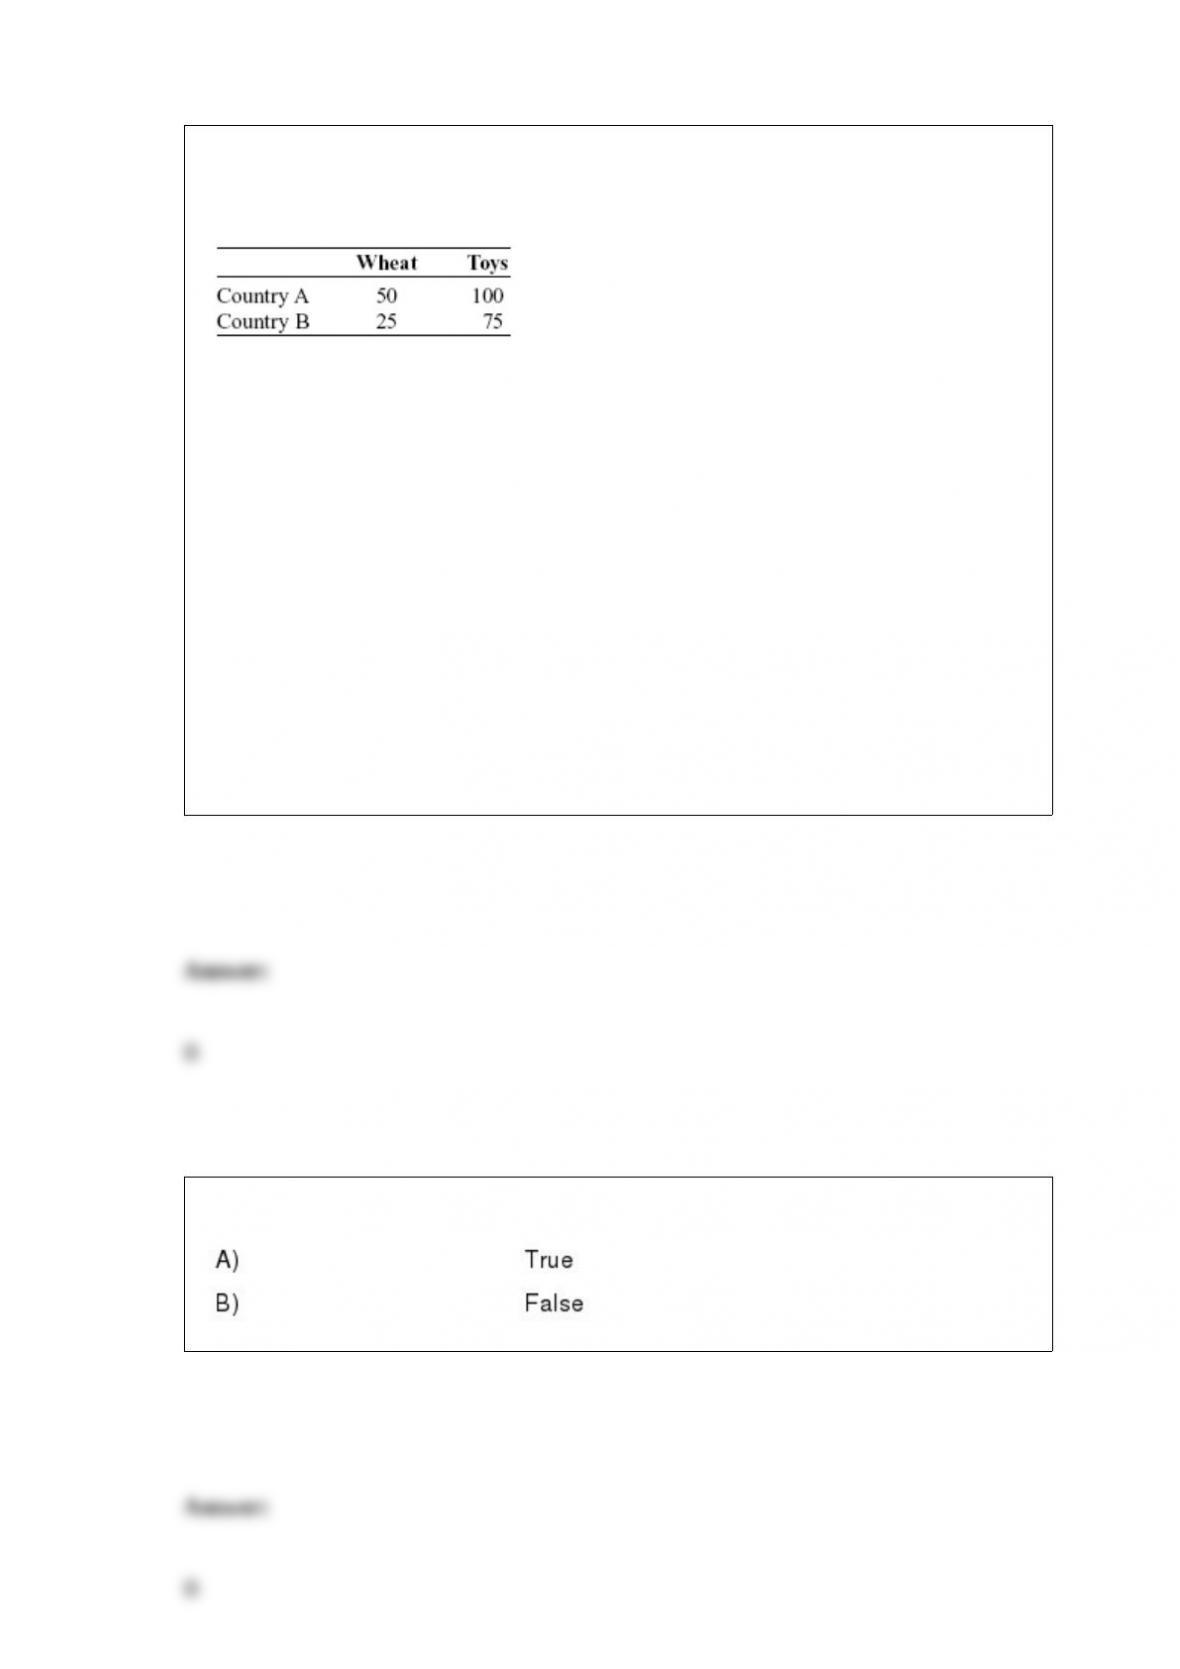
Scenario: The Production of Wheat and Toys
The table describes the production of two goods,
wheat and toys, in country A and country B. Each country has a linear production
possibility frontier with respect to its production of the two goods. The numbers in each
column represent the total number of units each country could produce if it used all of
its resources to produce the good.
(Scenario: The Production of Wheat and Toys) Look at the scenario Production of
Wheat and Toys. The opportunity cost of producing a unit of wheat in country B is:
A) 75 toys.
B) 3 toys.
C) 25 units of wheat.
D) 0.33 units of wheat.
Efficiency deals with helping society decide what its goals should be.

If good A is a normal good and its price decreases, the _____ effect will cause a(n)
_____ in consumption of it.
A) substitution; decrease
B) income; decrease
C) income; increase
D) substitution effect and the income; decrease
In a perfectly competitive market, tastes and preferences lead to an increase in the
demand for the good. Holding everything else constant, this will lead to an increase in
price that will result in _____, which will _____, which will _____.
A) positive economic profits; attract new firms; reduce the price
B) economic losses; attract new firms; reduce the price
C) positive economic profits; lead some firms to leave the industry; further increase the
price
D) economic losses; lead some firms to leave the industry; further increase the price
Which of the following activities is a public good?
A) going to school
B) voting
C) smoking
D) getting a flu shot
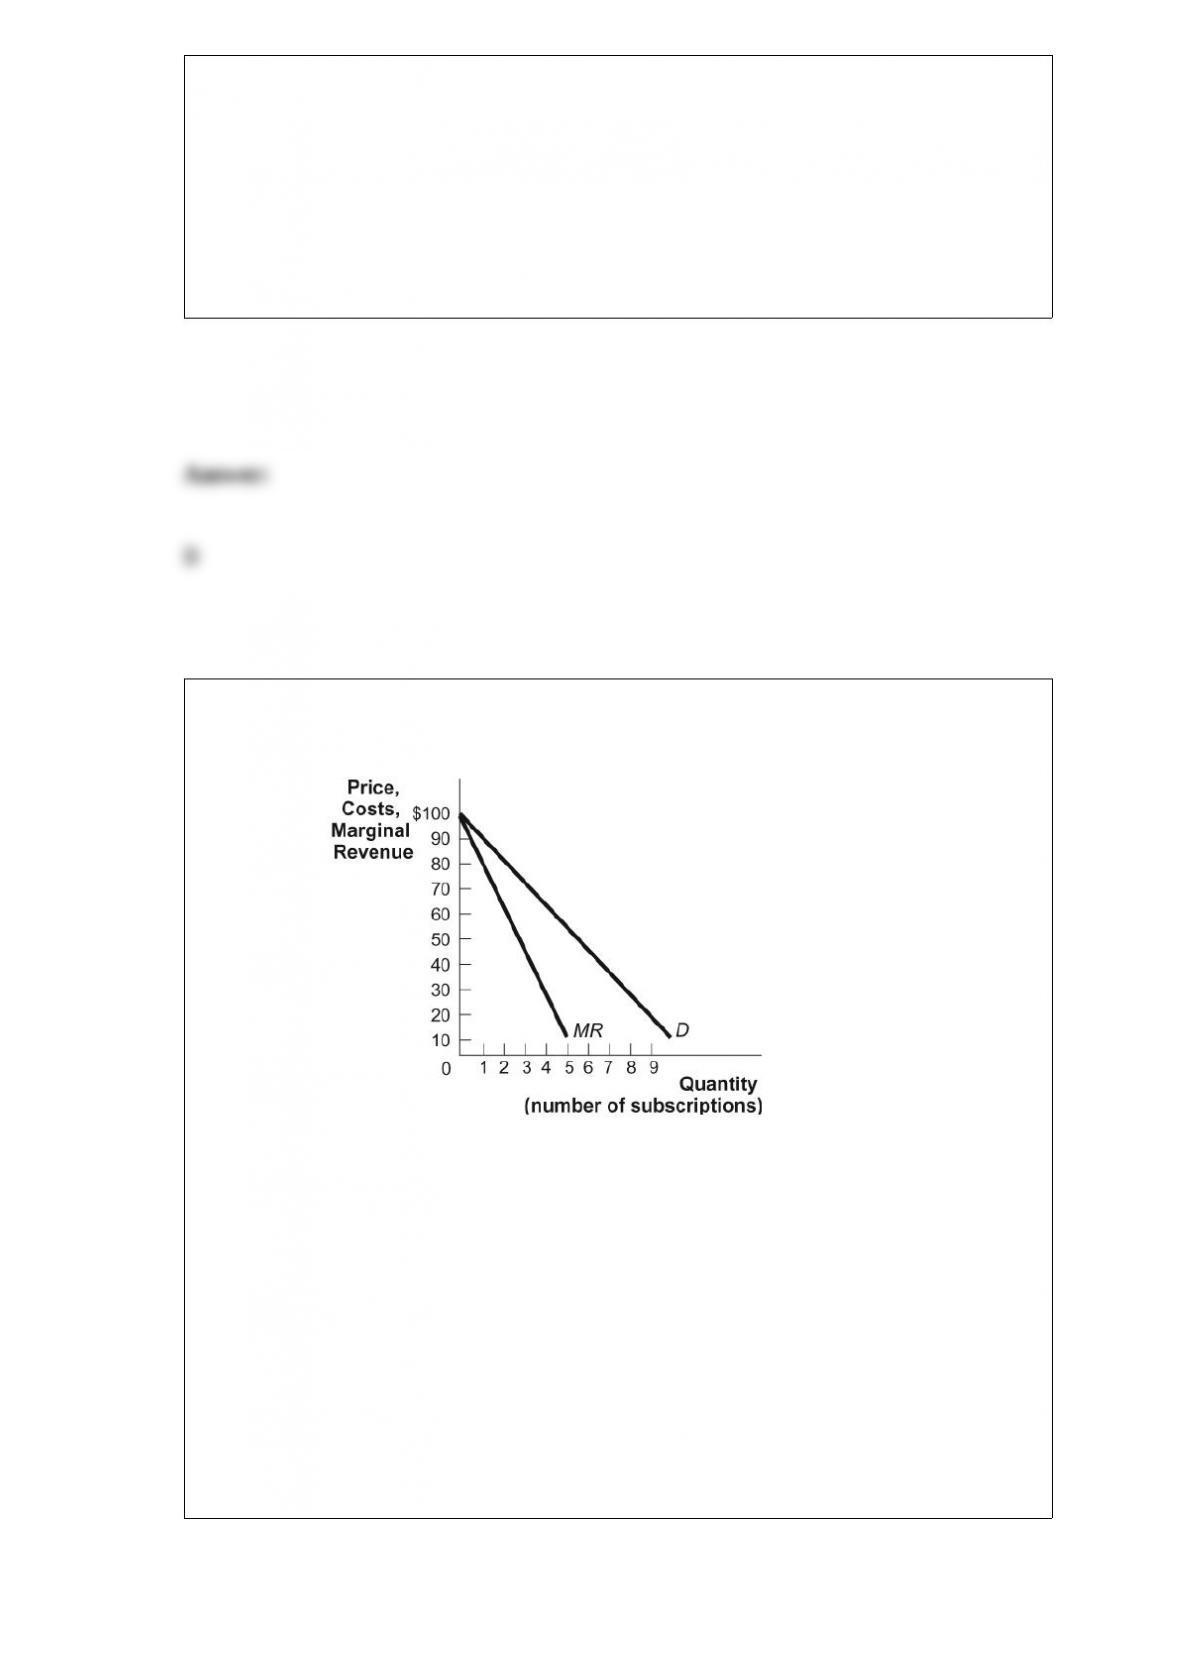
Figure: PPV
(Figure: PPV) Look at the figure PPV, which shows the demand and marginal revenue
for a pay-per-view football game on cable TV. Assume that the marginal cost and
average cost are a constant $20. If the cable company is in a perfectly competitive
industry, how much is producer surplus?
A) $0
B) $320
C) $160
D) $500
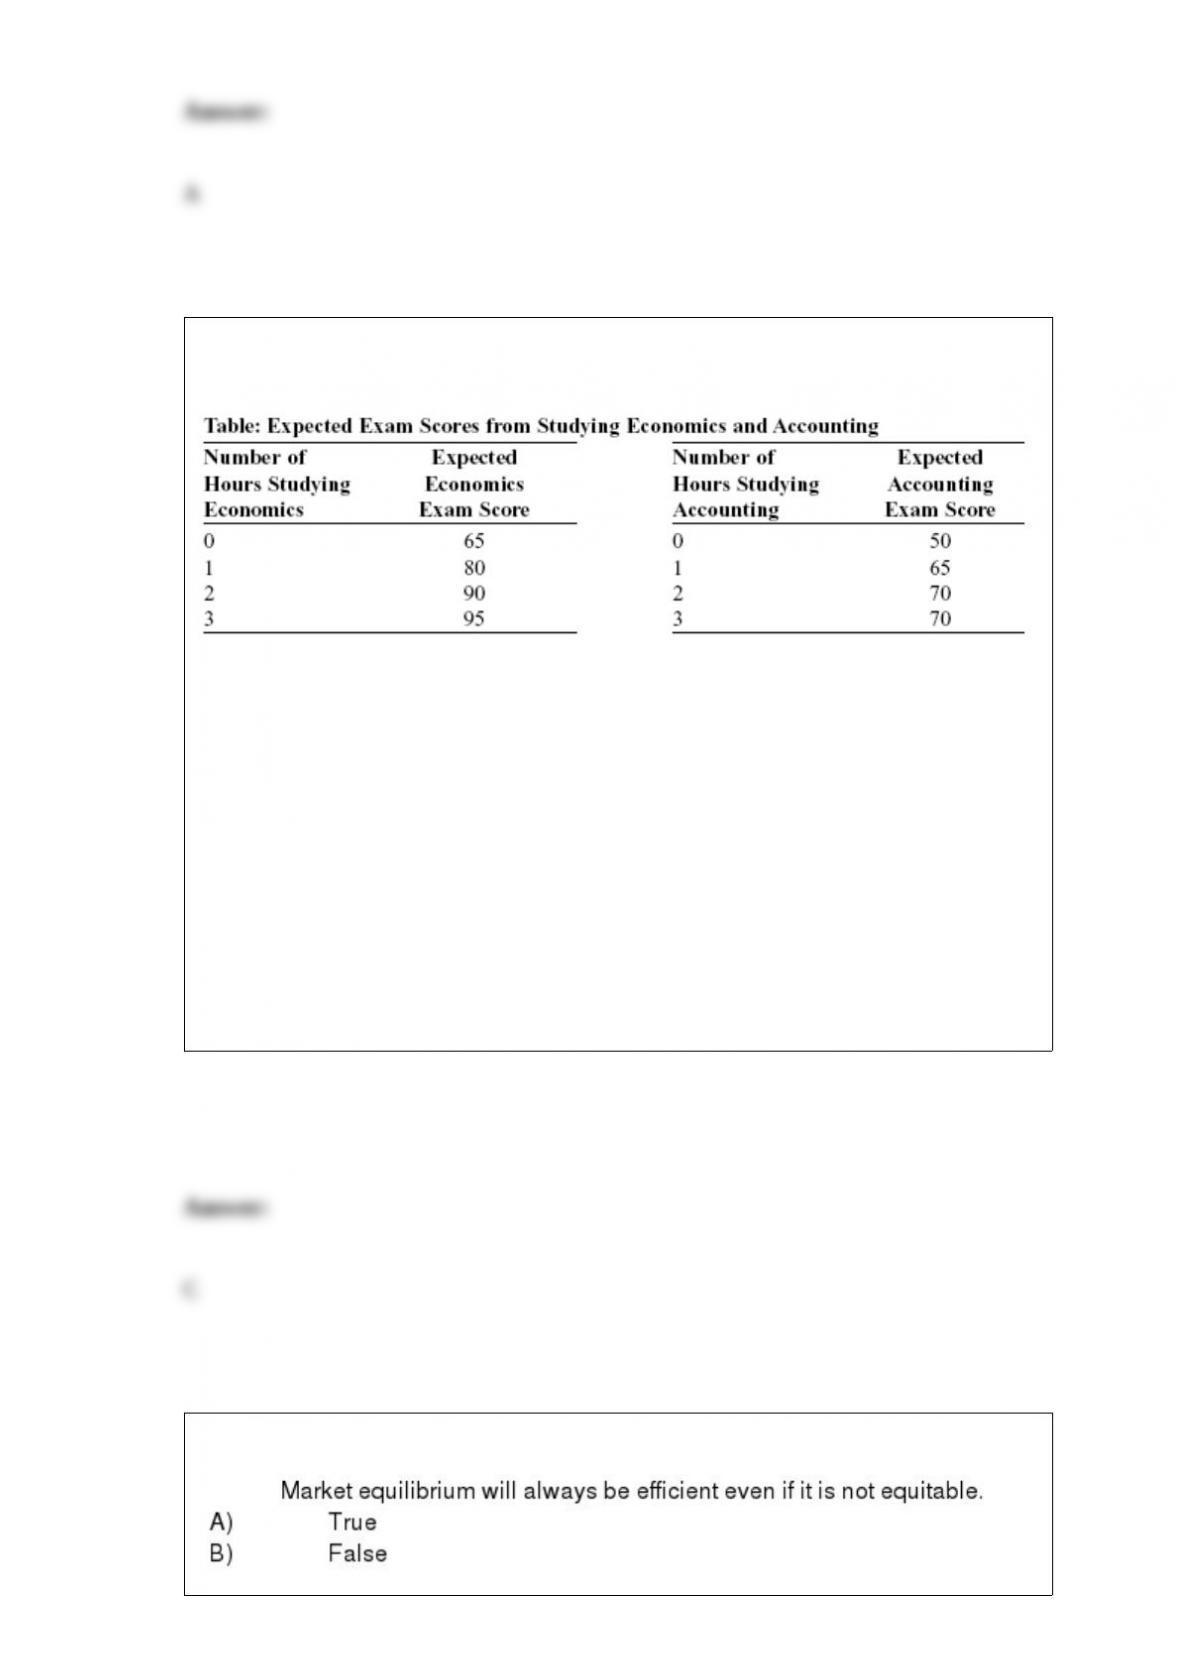
(Table: Expected Exam Scores from Studying Economics and Accounting) Look at the
table Expected Exam Scores from Studying Economics and Accounting. The marginal
benefit in terms of your economics score of spending the first hour studying economics
is _____ points.
A) 5
B) 10
C) 15
D) 20
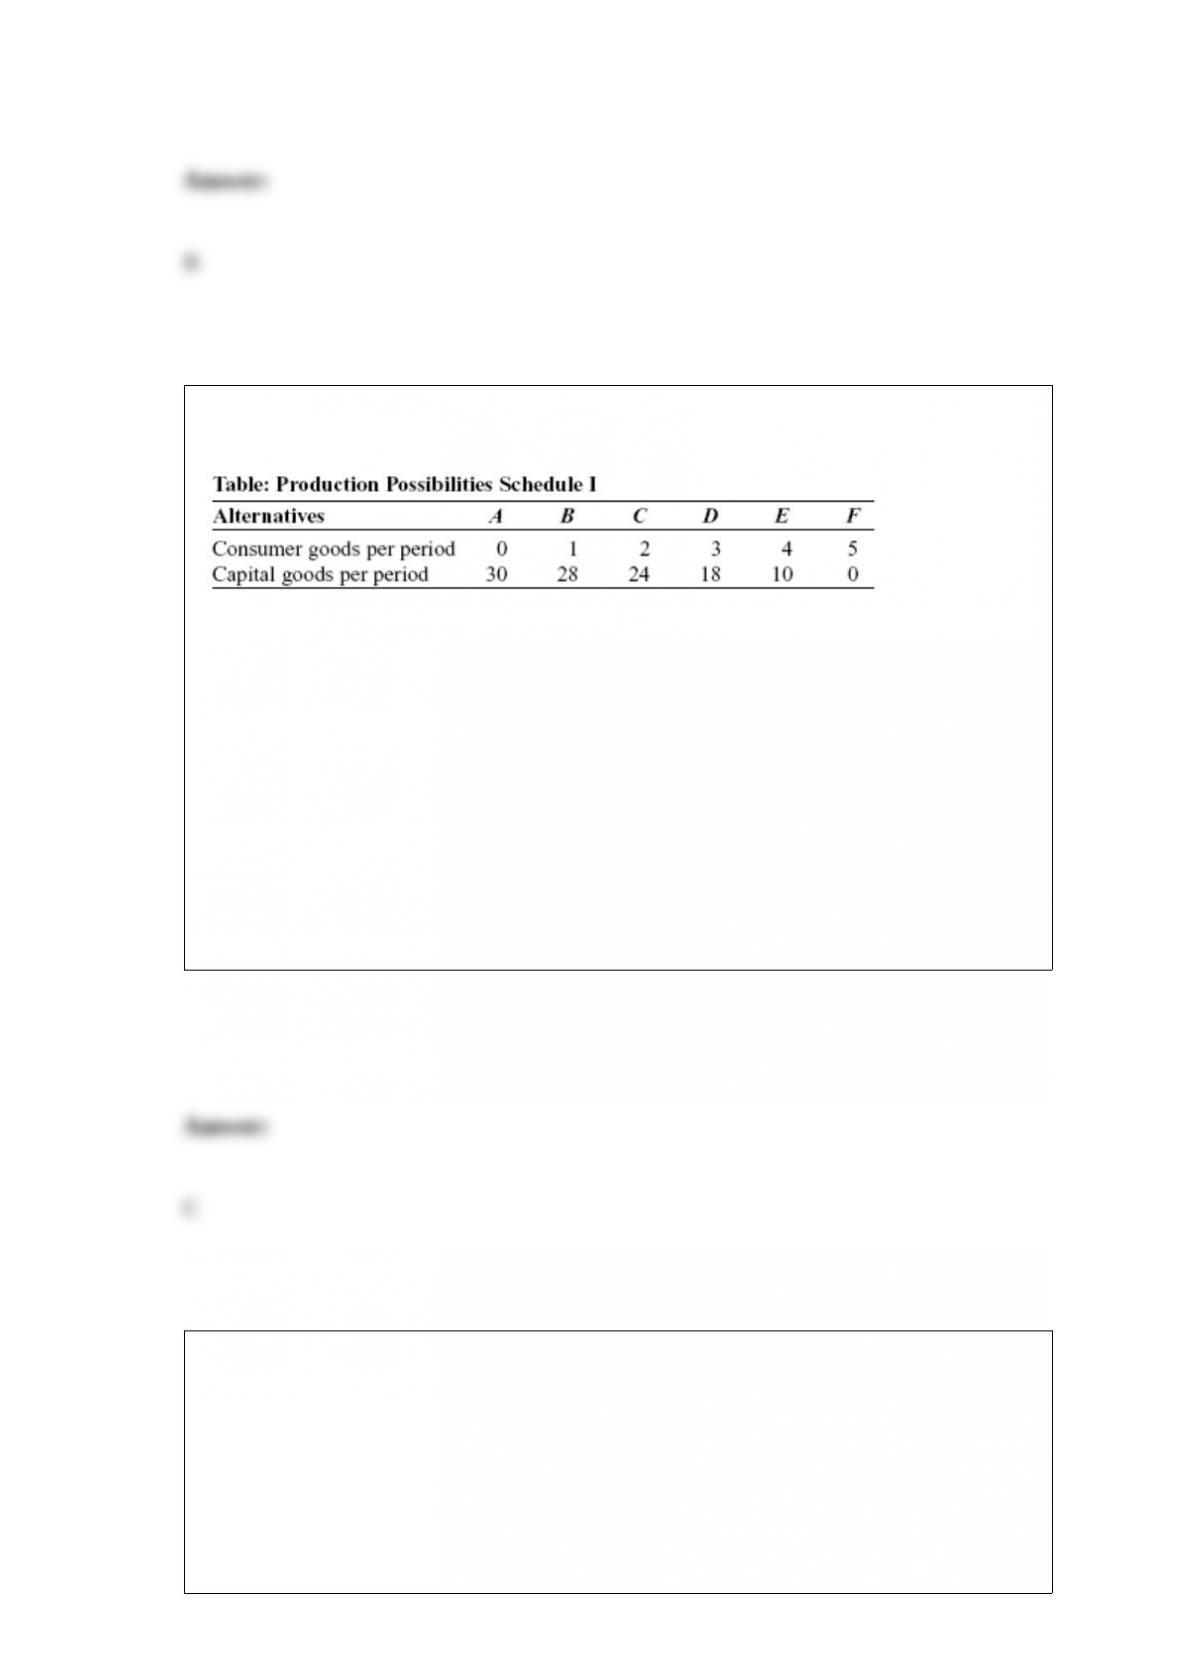
(Table: Production Possibilities Schedule I) Look at the table Production Possibilities
Schedule I. If the economy produces two units of consumer goods per period, it also
can produce at most _____ units of capital goods per period.
A) 30
B) 28
C) 24
D) 18
A firm’s demand curve for labor will shift because of:
A) a decrease in the wage rate.
B) an increase in the wage rate.
C) changes in preferences and the cultural norms that define how much we work.
D) a change in the product’s price.
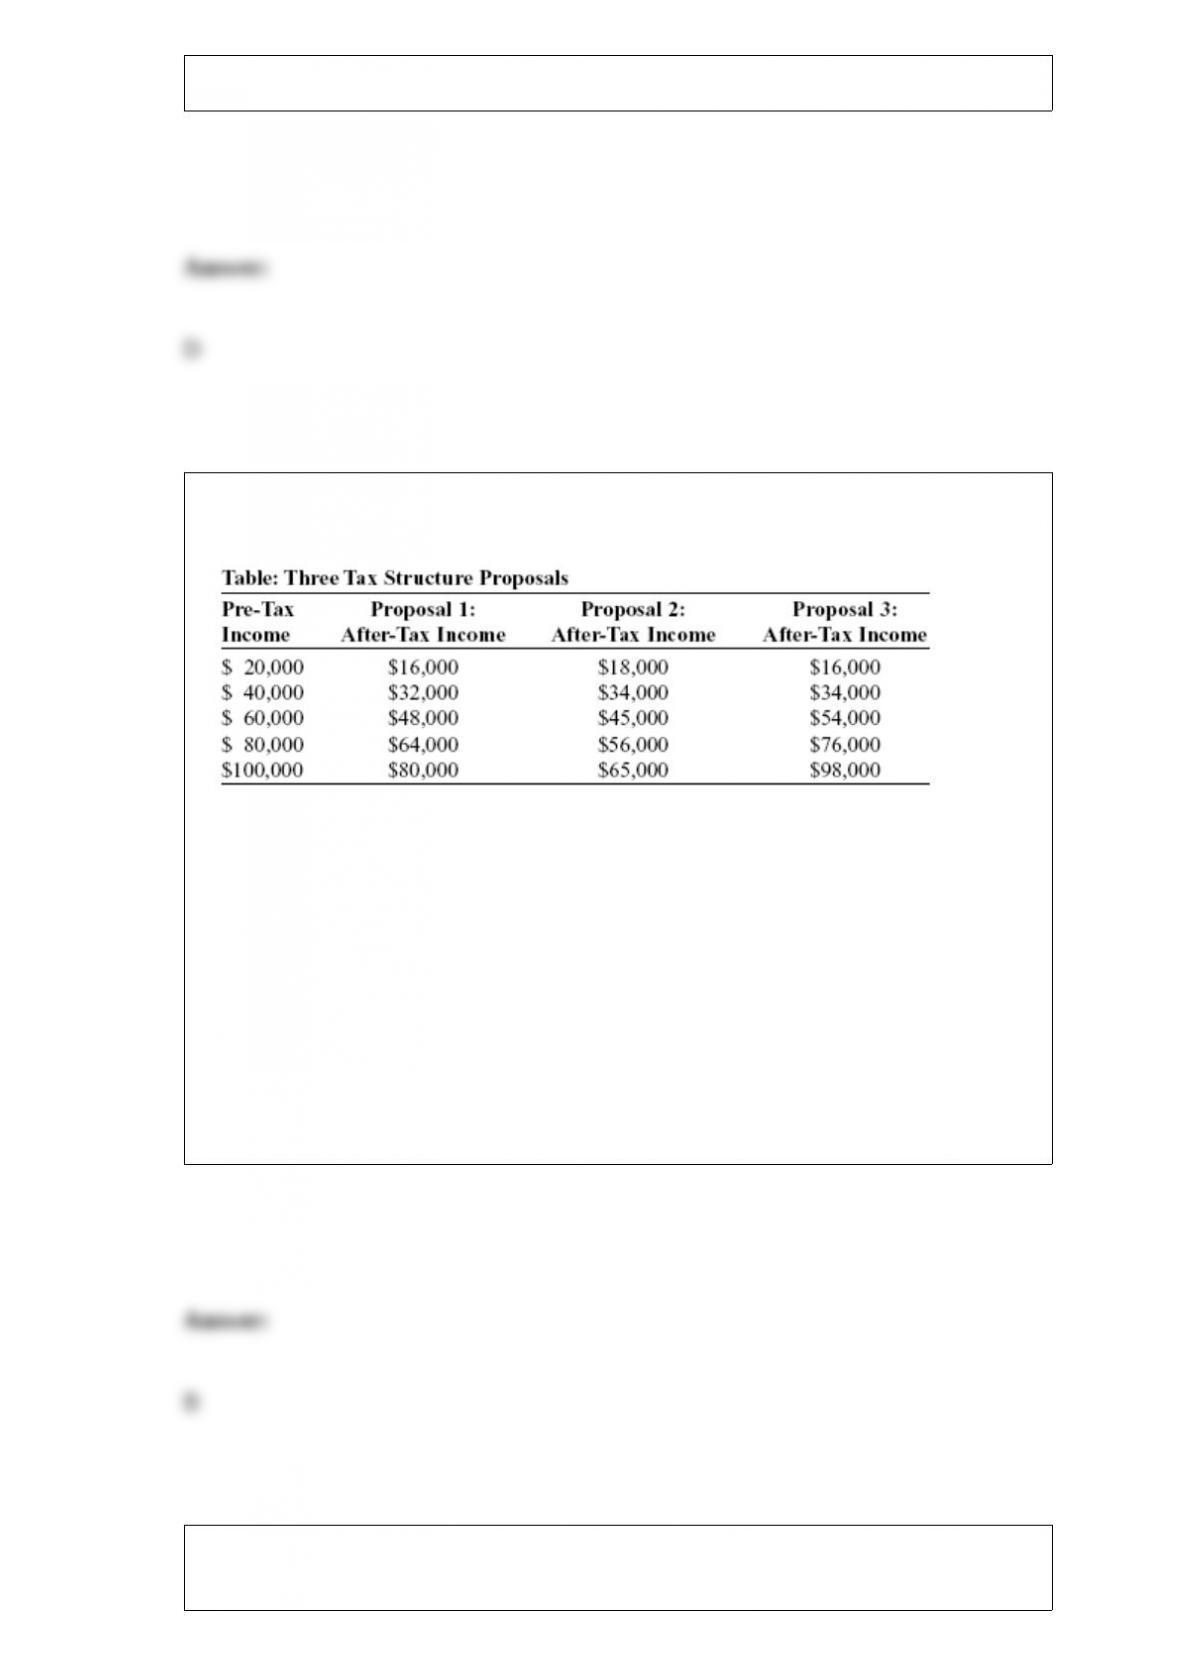
(Table: Three Tax Structure Proposals) Look at the table Three Tax Structure Proposals.
Policy makers interested in implementing a progressive tax structure would suggest
using:
A) proposal 1.
B) proposal 2.
C) proposal 3.
D) all of the proposals, since all are progressive.
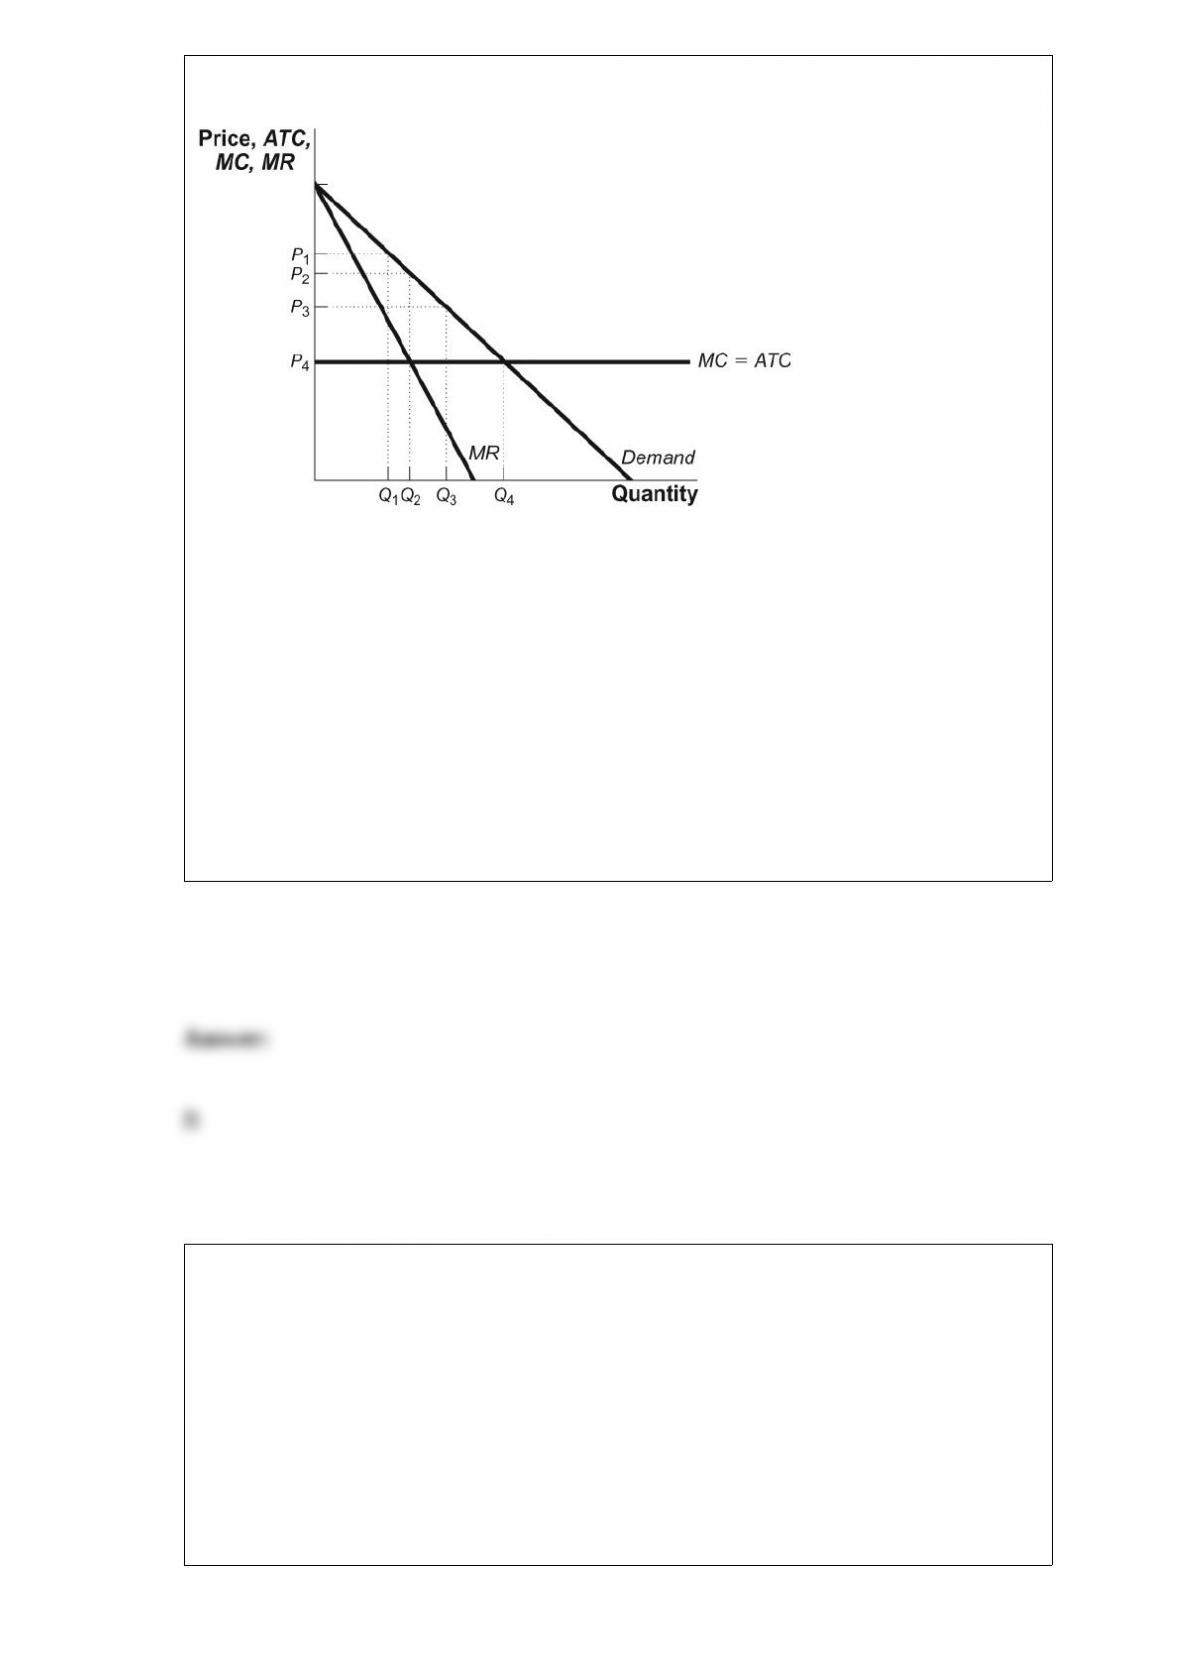
Figure: The Monopolist II
(Figure: The Monopolist II) Look at the figure The Monopolist II. The deadweight loss
associated with this monopoly can be measured as the area:
A) 0.5(P1 ” P2)(Q2 ” Q1).
B) 0.5 (P2 ” P4)(Q4 ” Q2).
C) 0.5 (P1 ” P3)Q3.
D) 0.5 (P1 ” P3)Q2.
The circular-flow diagram illustrates how firms _____ goods and services and _____
factors of production.
A) buy; sell
B) buy; buy
C) sell; buy
D) sell; sell
We can measure total producer surplus for good X as:
A) the sum of the individual producer surpluses for all buyers of X.
B) the area below the supply curve for X and above the price of X.
C) the area bounded by the supply curve for X and the two axes.
D) the area between the demand curve for X and the supply curve for X.

A monopolistically competitive firm has excess capacity in the long run. This means
that it:
A) produces less than the output at which average total costs are minimized.
B) produces less than the output at which price and marginal cost are equal.
C) could produce more by moving to a larger plant.
D) doesn’t maximize profits.
An increase in producer surplus would most likely occur if:
A) an effective price floor was imposed.
B) an effective price ceiling was imposed.
C) the market price of the good decreased.
D) no changes occurred in the market.
Figure: Demand and Supply of Gasoline
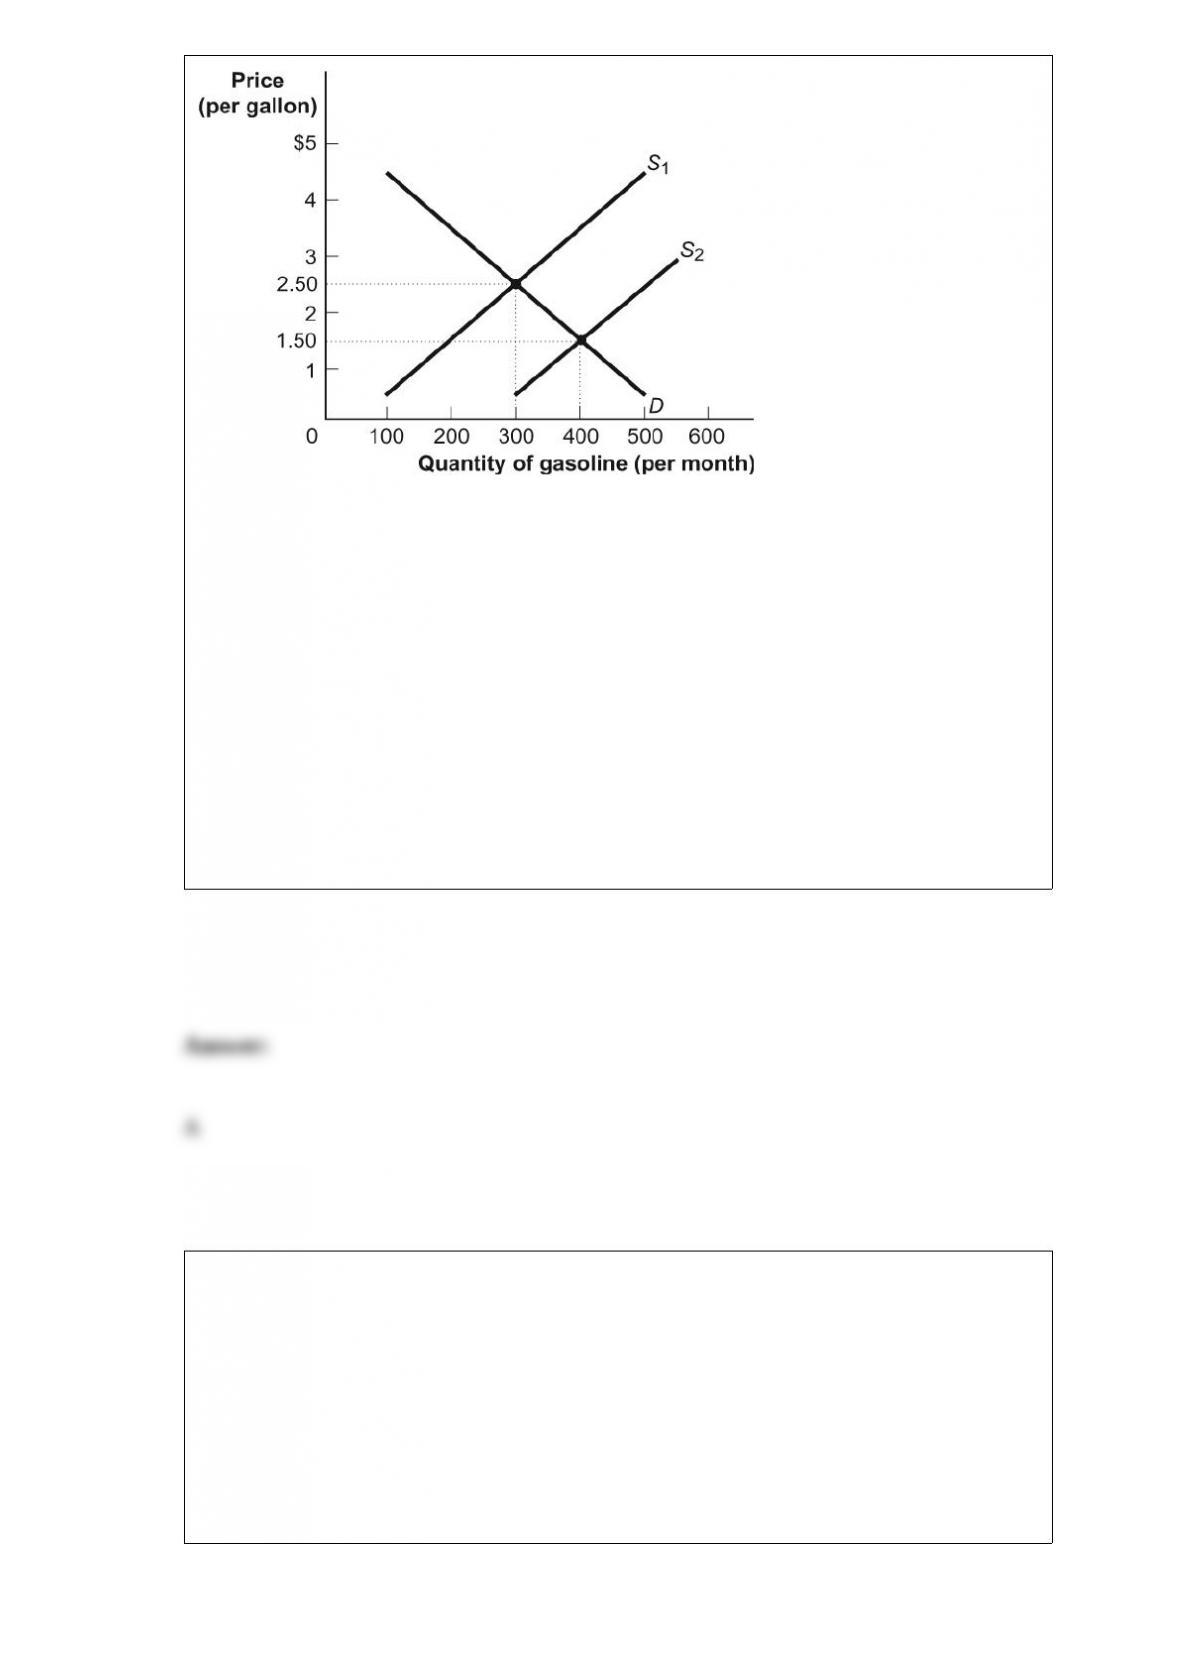
(Figure: Demand and Supply of Gasoline) Look at the figure Demand and Supply of
Gasoline. What might cause the supply curve to shift from S2 back to the initial supply
curve S1?
A) The Organization of Petroleum Exporting Countries (OPEC) restricts the production
of crude oil.
B) OPEC increases the production of crude oil.
C) U.S. citizens want to buy more gas.
D) Technology in the refinement of gasoline greatly improves.
Food stamps are an example of:
A) a negative income tax.
B) an in-kind benefit.
C) a monetary benefit.
D) unemployment insurance.
Which of the following is a normative statement?
A) Women’s labor force participation rate has increased during the past 100 years.
B) The federal minimum wage is higher today than it was in 1990.
C) Children in the United States are required to go to school until they reach a certain
age.
D) The best way to encourage growth in the economy is through government spending.

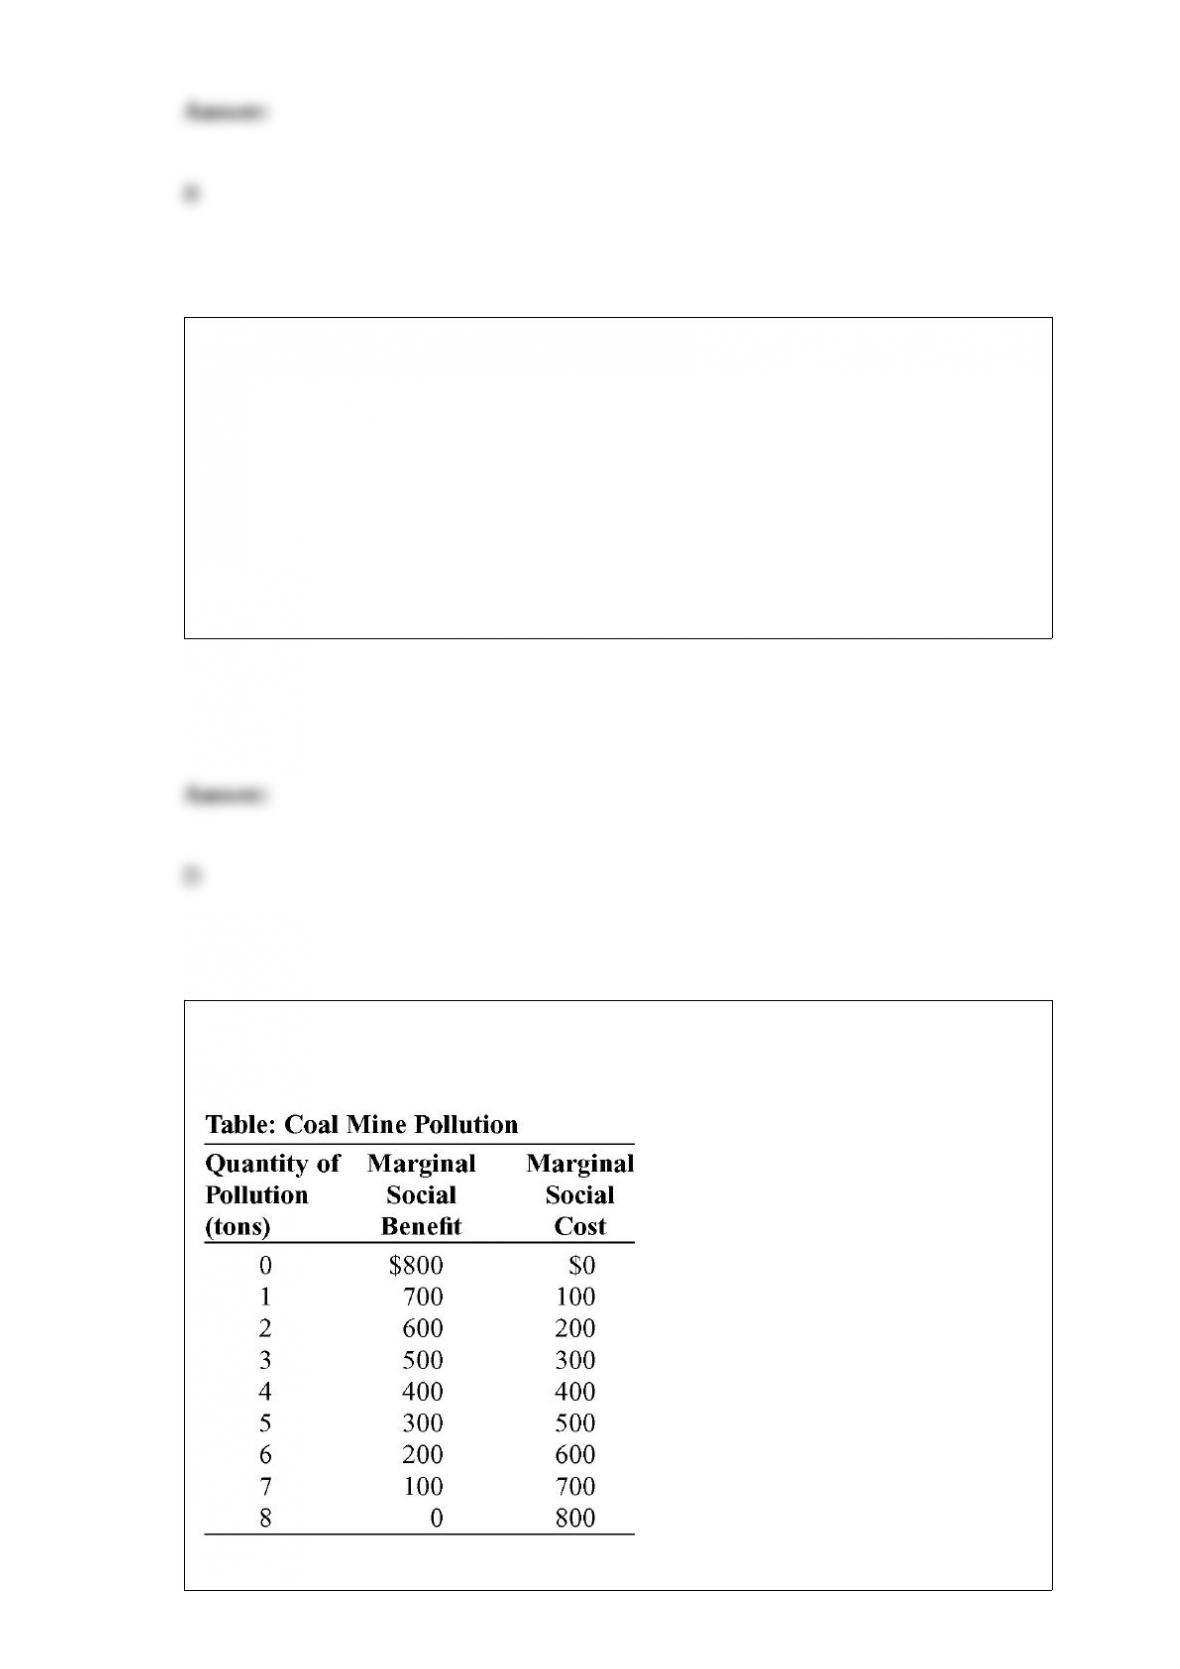
(Table: Coal Mine Pollution) The table Coal Mine Pollution shows the marginal social
benefit and cost of various amounts of pollution from a coal mine. The
market-determined quantity of pollution is _____ tons.
A) 0
B) 2
C) 4
D) 8
An assumption of the model of perfect competition is:
A) discrimination.
B) difficult entry and exit.
C) many buyers and sellers.
D) limited information.
The effect of international trade on U.S. factor markets is to:
A) increase the wage of highly educated workers.
B) increase the wage of unskilled workers.

C) decrease the wage of both highly educated workers and unskilled workers.
D) increase the wage of both highly educated workers and unskilled workers.
Which of the following is NOT true regarding a price-elastic demand curve?
A) Total revenue increases when the price falls.
B) The absolute value of the price elasticity is a fraction less than 1.
C) The absolute value of the price elasticity is greater than 1.
D) The percent changes in the quantity demanded exceed the percent changes in the
price for any small change in price.
Which pair of events is NOT independent?
A) You forget your umbrella; it rains.
B) There is a heat wave; demand for ice increases.
C) You didn’t study last night; there is a quiz in your economics class.
D) You don’t clean your apartment; you have unexpected company.
If a good is a necessity with few substitutes, all others things equal, then demand will
tend to:
A) be more price-elastic.
B) be less price-elastic.
C) have price elasticity equal to 1.
D) be the same as that of a luxury good.

The slope of a(n) _____ curve shows the rate at which two goods can be exchanged
_____.
A) indifference; without changing the total budget
B) utility; without changing the total budget
C) indifference; without changing total utility
D) marginal utility; to increase the consumer’s marginal utility