
Mental fatigue is a reason workers should be given some extra time to do their jobs.
Answer:
Most services contain a mix of tangible and intangible attributes known as the service
package which is the major output of the development process.
Answer:
A transformation process uses resources to convert inputs into some desired output.
Answer:
One of the major conclusions in job design is that task variety and skill variety are
important job design principles.
Answer:

Opportunity cost is the benefit forgone resulting from choosing an inferior course of
action.
Answer:
Lot-for-lot (L4L) is the most common lot sizing technique.
Answer:
When the time estimates in a CPM analysis vary into optimistic, most likely and
pessimistic, we should use the single time estimate CPM procedure.
Answer:
In a CPM analysis if you subtract the early finish from the late finish the result is the

activity’s slack time.
Answer:
There is not much that a firm can to influence independent demand.
Answer:
The objective function in a linear programming model can be nonlinear.
Answer:
According to the theory of constraints, a capacity-constrained resource (CCR) is one
whose utilization is close to capacity and could be a bottleneck if it is not scheduled
carefully.
Answer:

A necessary input to the material requirements planning (MRP) system is an exception
report.
Answer:
An assumption of learning curves is that the time required to complete a unit will
increase at an increasing rate as the cumulative number of units completed increases.
Answer:
In most cases, demand for products or services can be broken into several components.
Which of the following is not considered a component of demand?
A.Average demand for a period
B.A trend
C.Seasonal elements
D.Past demand
E.Autocorrelation

Answer:
Which of the following is not an important concept in TOC?
A.CCR
B.Rope
C.Drum
D.Buffer
E.File
Answer:
Which of the following is not a criterion that influences manufacturing plant or
warehouse facility location decisions?
A.Government barriers
B.Trading blocs
C.Environmental regulation
D.Immigration rules
E.Local labor costs

Answer:
You are using an exponential smoothing model for forecasting. The running sum of the
forecast error statistics (RSFE) are calculated each time a forecast is generated. You
find the last RSFE to be 34. Originally the forecasting model used was selected because
it’s relatively low MAD of 0.4. To determine when it is time to re-evaluate the
usefulness of the exponential smoothing model you compute tracking signals. Which of
the following is the resulting tracking system?
A.85
B.60
C.13.6
D.12.9
E.8
Answer:
On a good day a distributor will have $5,000 of inventory sales; on a medium day sales
of $3,000; on a bad day only $1,000. Suppose you have data on this distributor’s sales
for the past 100 days and that she had 25 good days, 50 medium days and 25 bad days.
If you draw a random number to represent her sales for the first simulated day and that
number were 89, which of the following were her simulated sales? (Note: arrange the
random number interval probability distribution so it starts with a good day at 00
followed by a medium day, etc.)
A.$5,000
B.$3,000

C.$2,500
D.$1,000
E.Can not be determined
Answer:
Which of the following is a data gathering tool from the operations consulting tool kit?
A.Gap analysis
B.Employee surveys
C.Organization charts
D.Statistical tools
E.Bottleneck analysis
Answer:
If the average aggregate inventory value is $1,200,000 and the cost of goods sold is
$600,000, which of the following is weeks of supply?
A.1,040

B.606
C.104
D.60.6
E.2.0
Answer:
Which of the following is not a priority rule used to schedule the sequence of jobs in a
production operation?
A.First-come-first served
B.Shortest operating time
C.Last-in-first-out
D.Critical ratio
E.Slack-time-remaining per operation
Answer:
Which of the following is considered a secondary report in an MRP system?
A.Planned order schedule

B.Performance reports
C.Inventory record
D.Firm orders from known customers
E.Engineering change reports
Answer:
When the textbook presented the topic of job design decisions, the “what” of these
decisions concerned which of the following?
A.Time of day
B.Tasks to be performed
C.Mental and physical characteristics of the workforce
D.Method of performance and motivation
E.The organizational rationale for the job
Answer:
The way to build greater flexibility in your workers is to do which of the following?

A.Pay higher wages to motivate a willingness to do a variety to tasks
B.Require a broader range of training
C.Provide a wide variety of technology to augment workers skills
D.Institute a “pay for skills” program
E.Use part-time employees with specialized skills as needed
Answer:
An advantage of the Level strategy for aggregate operations planning is which of the
following?
A.Total costs through the entire system are minimized
B.There is a smooth flow throughout the production system
C.There is variety for the workers through the mixing of models produced
D.The risk of backorders is minimized
E.Customer service is improved
Answer:
Which of the following should we use an “R” chart to monitor process quality?

A.Grades in a freshman “pass/fail” course
B.Tire pressures in an auto assembly plant
C.Vehicles passing emissions inspection
D.Computer software errors
E.Number of units with missing operations
Answer:
In developing an operations and supply strategy, which of the following would be an
important product-specific criteria to consider?
A.Focused factory
B.Production lot-size
C.Supplier after-sale support
D.Learning curve
E.Total quality management
Answer:
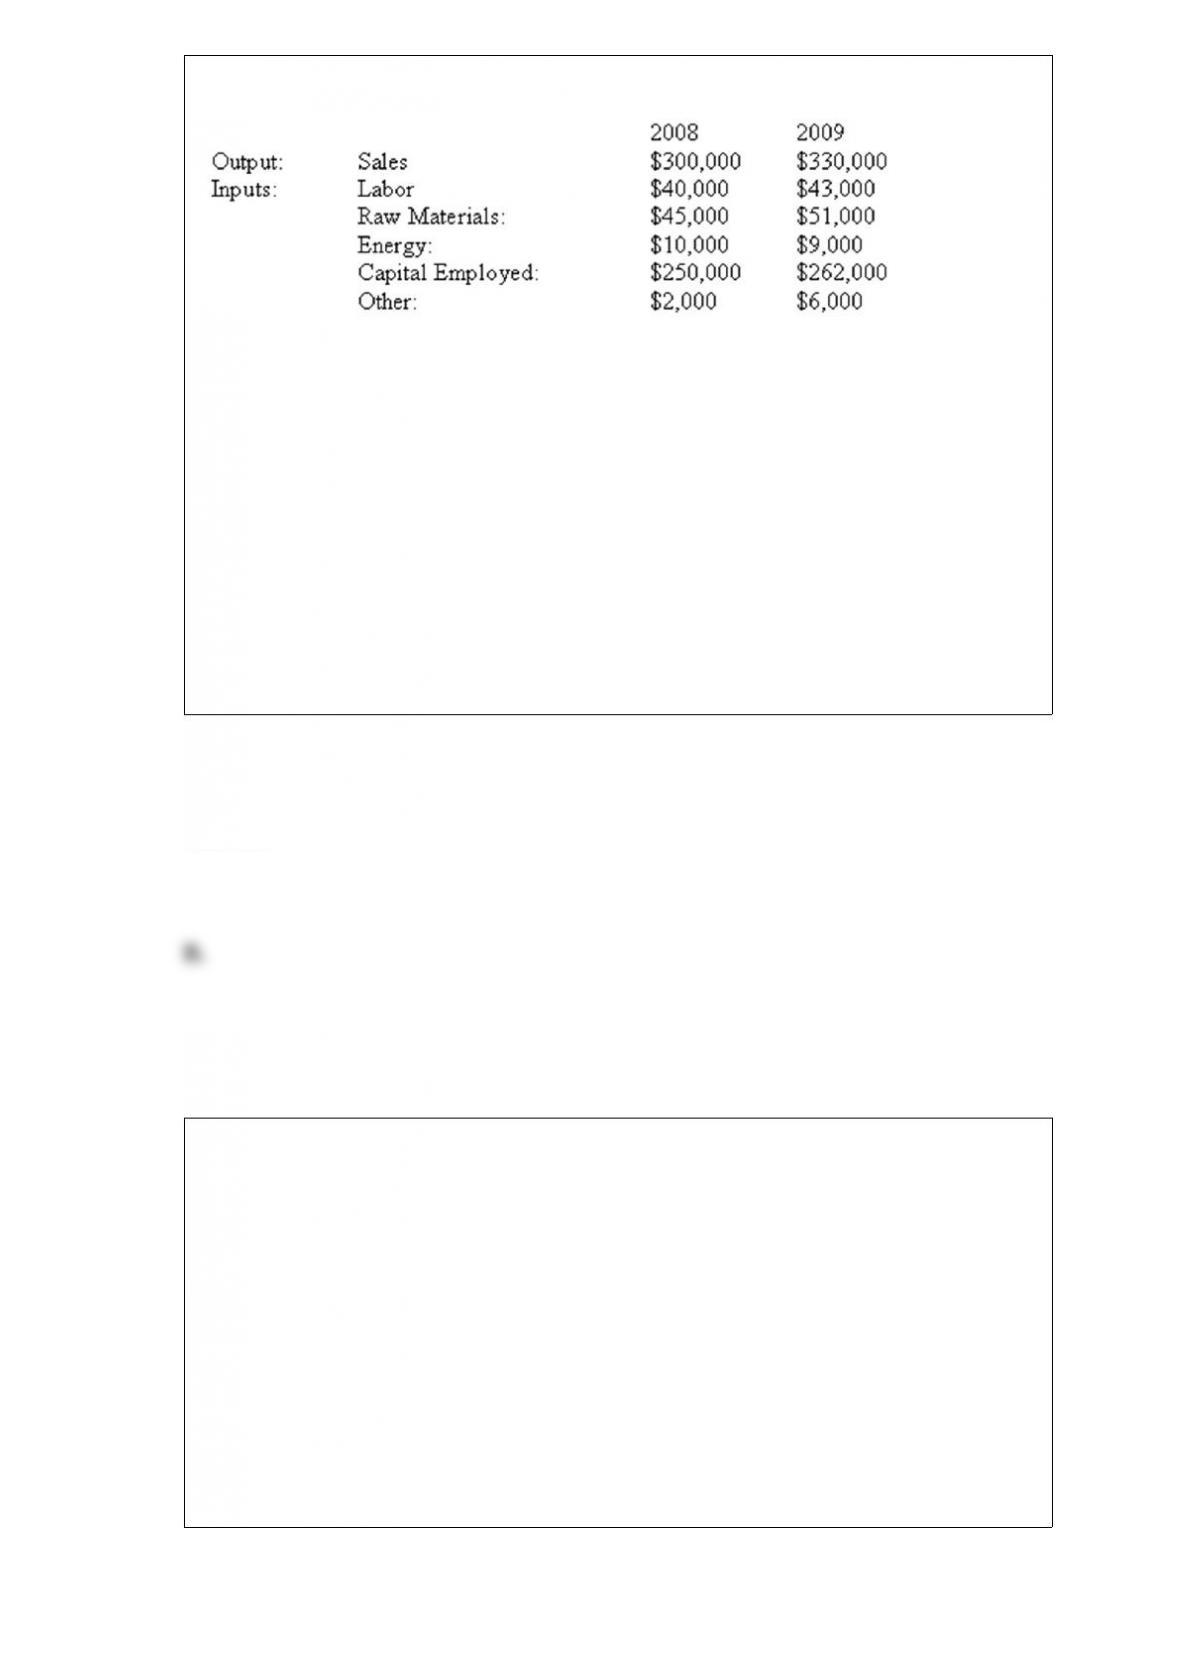
Various financial data for SunPath Manufacturing for 2008 & 2009 follow.
What is the percentage change in the labor partial productivity measure for SunPath
between 2008 & 2009?
A.9.22
B.2.33
C.0.53
D.2.88
E.10.39
Answer:
In the manufacturing strategy paradigm developed in the 1970’s, which of the following
are suggested?
A.Manufacturing can be a competitive weapon by excelling on all performance
measures
B.Manufacturing should focus on a limited set of tasks
C.Management should create a highly flexible factory
D.Manufacturing facilities can achieve the lowest possible cost
E.Manufacturing management is best done by people with engineering degrees

Answer:
Which of the following is not a data gathering tool from the operations consulting tool
kit?
A.Plant tours/Audits
B.Work sampling
C.Flowcharts
D.Factory blueprints
E.Organization charts
Answer:
If it takes a supplier four days to deliver an order once it has been placed and the
standard deviation of daily demand is 10, which of the following is the standard
deviation of usage during lead time?
A.10
B.20
C.40
D.100
E.400

Answer:
Which of the following are not used as reasons to justify time allowances in a time
study analysis?
A.Going to the washroom
B.Unavoidable work delays
C.Worker fatigue
D.Worker illness
E.Coffee breaks
Answer:
A desirable feature of simulation software is which of the following?
A.Have micro capability, such as the ability to zoom in on minute details
B.Output standard statistics such as cycle times, utilizations and wait times
C.Limiting the variety of data reported to help focus the analysis of alternatives
D.The ability to manipulate the frequency distribution pattern to achieve desired results
E.The ability to exactly mimic the actual situation being simulated

Answer:
Operations and supply management does not involve which of the following?
A.Using operations research/management science decision-making tools
B.Industrial engineering issues
C.Line management responsibilities
D.Improving operating systems
E.Portfolio management
Answer:
A company wants to forecast demand using the weighted moving average. If the
company uses two prior yearly sales values (i.e., year 2007 = 11,000 and year 2008 =
13,000) and we want to weight year 2007 at 35% and year 2008 at 65%, what is the
weighted moving average forecast for Year 2009?
Answer:
What does the text mean when it states that rather than to search for the perfect forecast
one should learn to live with inaccurate forecasts?
Answer:
What is that sequence of activities that consume the longest amount of time in a project
network of activities called?
Answer:
Using the fixed-time period inventory model and given an average daily demand of 300
units, 4 days between inventory reviews, 5 days for lead time, 1,200 units of inventory
on hand, a “z” of 1.96 and a standard deviation of demand over the review and lead
time of 12 units, what quantity should be ordered?
Answer:
Describe the implications of the product-process matrix for process design in a
competitive situation?
Answer:
What is the name for a matrix that helps a product design team translate customer
requirements into operating and engineering goals?
Answer:
How might the generic product development process described in the text be different if
developing a process-intensive product?
Answer:
What is the difference between statistical process control (SPC) and statistical quality
control (SQC)?
Answer:
What are the advantages and disadvantages of using a make-to-order process compared
to the advantages and disadvantages of a make-to-stock process in a manufacturing
operation?
Answer: