Process innovation is most successful in organizations that view their systems as a set
of functional areas vying for limited resources.
Dependent demand items are typically products for use by the final customer.
For a given process, the process capability ratio is not related to its specification limits.
Short-midrange forecasts tend to use quantitative models that forecast demand based on
historical demand.
One benefit of small lot production is that workers demonstrate fewer tendencies to let
poor quality pass.
Scheduling using the theory of constraints (TOC) requires that process batch sizes and
transfer batch sizes always match.
The objective function is a linear relationship that either minimizes or maximizes some
value.
Companies with a quality focus generally give their employees the authority to make
decisions that will improve quality.
Worldwide, extended producer responsibility (EPR) is becoming an important factor
influencing product design for personal computers and some household appliances.
A process flowchart is a useful tool for analyzing a process because it often highlights
nonproductive activities.
Variable control charts are used to monitor measurable characteristics of a process’s
outputs rather than descriptive characteristics.
If the average service rate is smaller than the average arrival rate an infinitely large
waiting line (queue) will form.
For most industrialized countries, the difference between a company’s success and
failure is dependent on the capability of its human resources.
Statistical process control can prevent poor quality before it occurs if a pattern is
evident in the plotted points.
When demand fluctuations are extreme using overtime and undertime is a feasible
strategy for adjusting capacity.
The production system that prizes flexibility and quality over efficiency and quantity is
known as
a. mass production.

b. craft production.
c. lean production.
d. electronic commerce.
The number of channels in a queuing process
a. denotes the number of servers in sequence a customer must go through.
b. denotes the size of the calling population.
c. denotes the number of parallel servers for servicing arriving customers.
d. denotes the average queue length.
For activities on a project’s critical path,
a. earliest start time (ES) equals latest start time (LS).
b. earliest start time (ES)is greater than latest start time (LS).
c. earliest start time (ES) is less than latest start time (LS).
d. earliest start time (ES) equals latest finish time (LF).

A qualitative procedure used to develop a consensus forecast is known as
a. exponential smoothing.
b. regression methods.
c. the Delphi technique.
d. naïve forecasting.
The decision to purchase goods and services that were produced in-house from an
outside supplier is called
a) sourcing.
b) outsourcing.
c) procurement.
d) None of these answer choices is correct.
A _______________ of material is used to plan the production of products with many
optional features.

a. K-bill
b. modular bill
c. phantom bill
d. time-phased bill
The ______________ technique selects numbers randomly from a probability
distribution for use in a trial run of a simulation.
a. Computer World
b. Monaco
c. steady-state
d. None of these answer choices is correct.
The ratio of a firm’s monthly output to the number of labor hours used in the same
month would be a measure of
a. labor productivity.
b. capital productivity.
c. machine productivity.
d. multifactor productivity.

A company is considering producing an item that can be sold for $37.50 per unit. If the
fixed costs for setting up production are $225,000 and the variable cost per unit for the
item is $35 then the breakeven volume for this item is
a. 6,000 units.
b. 6,429 units.
c. 72,500 units.
d. 90,000 units.
Given the following Product Structure Record
The number of E’s required for each A is
a. 1.
b. 2.
c. 3.
d. 4.
__________________________is a procedure, used by multifunction design teams, to
eliminate unnecessary features and functions from a product design.
a. Failure mode and effects analysis
b. Value analysis
c. Fault tree analysis
d. All of these answer choices is correct.
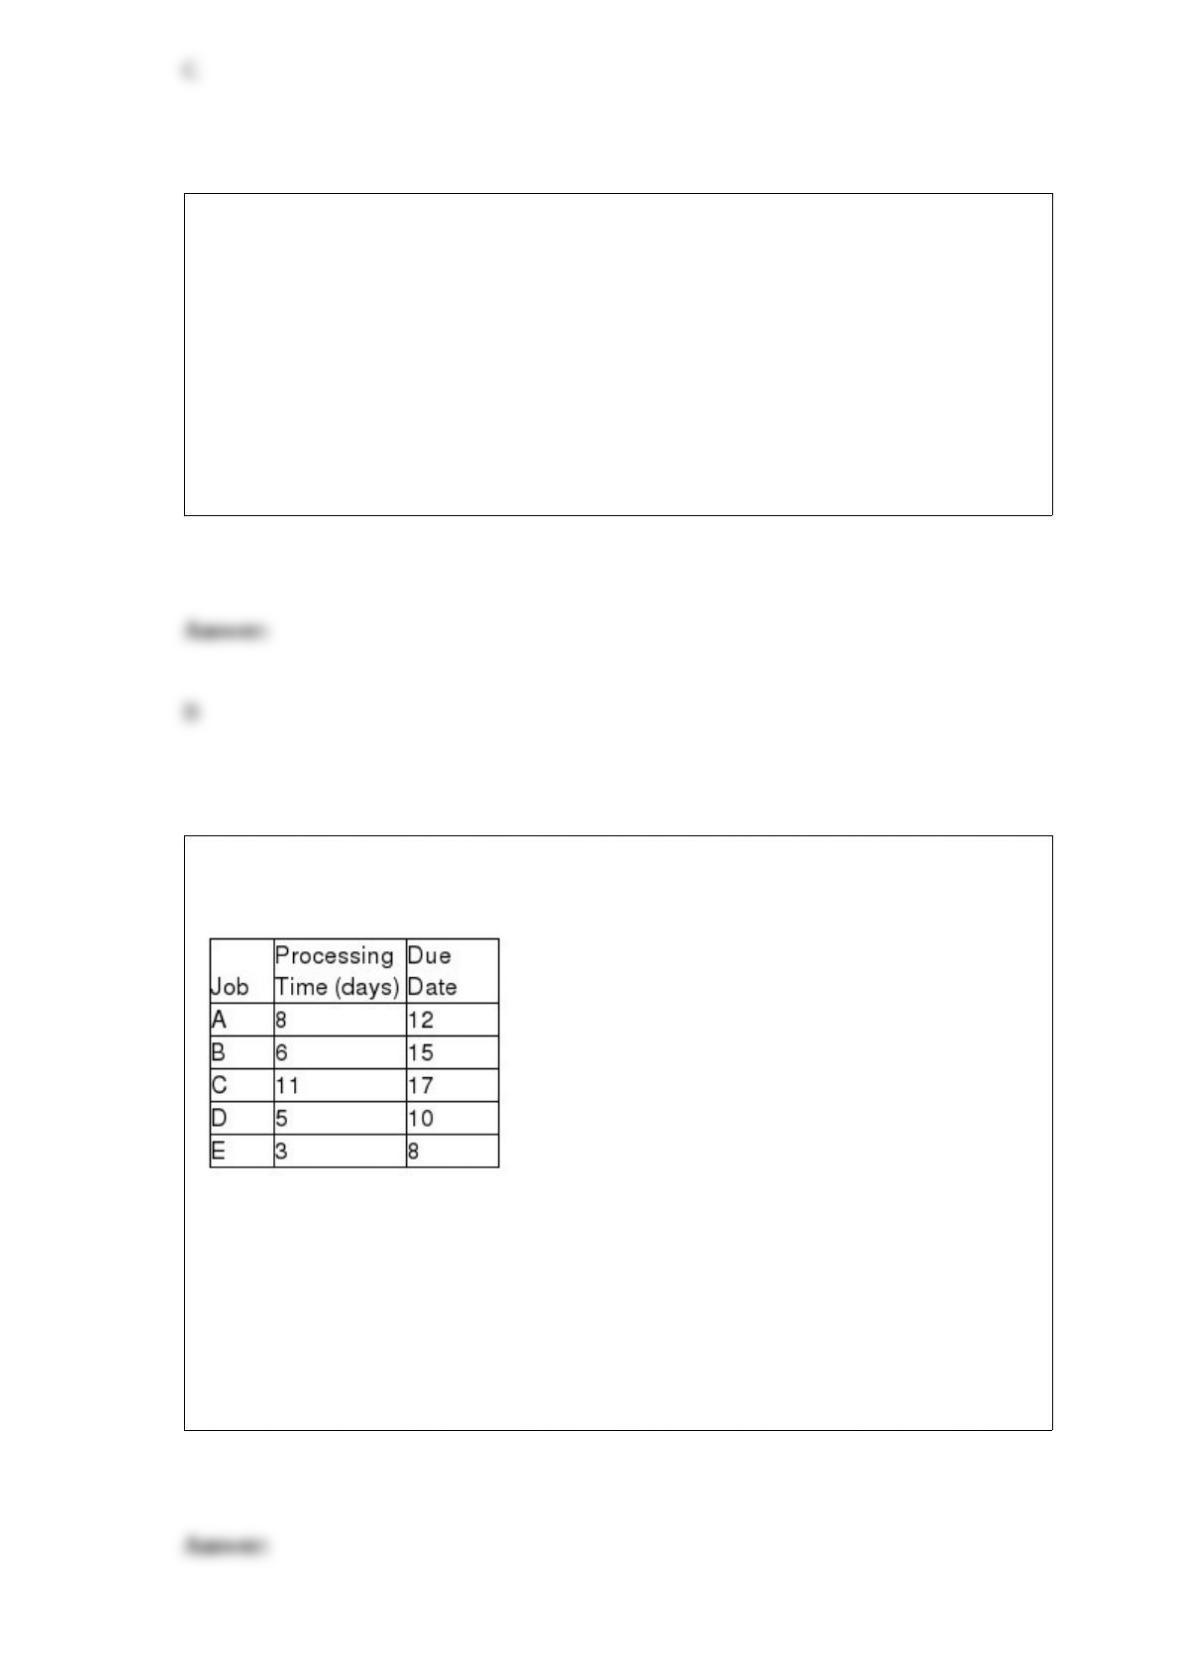
If the following jobs are sequenced according to the LPT rule then the total number of
jobs that would be late is (assume zero for today’s date)
a. 5 jobs.
b. 4 jobs.
c. 3 jobs.
d. 2 jobs.
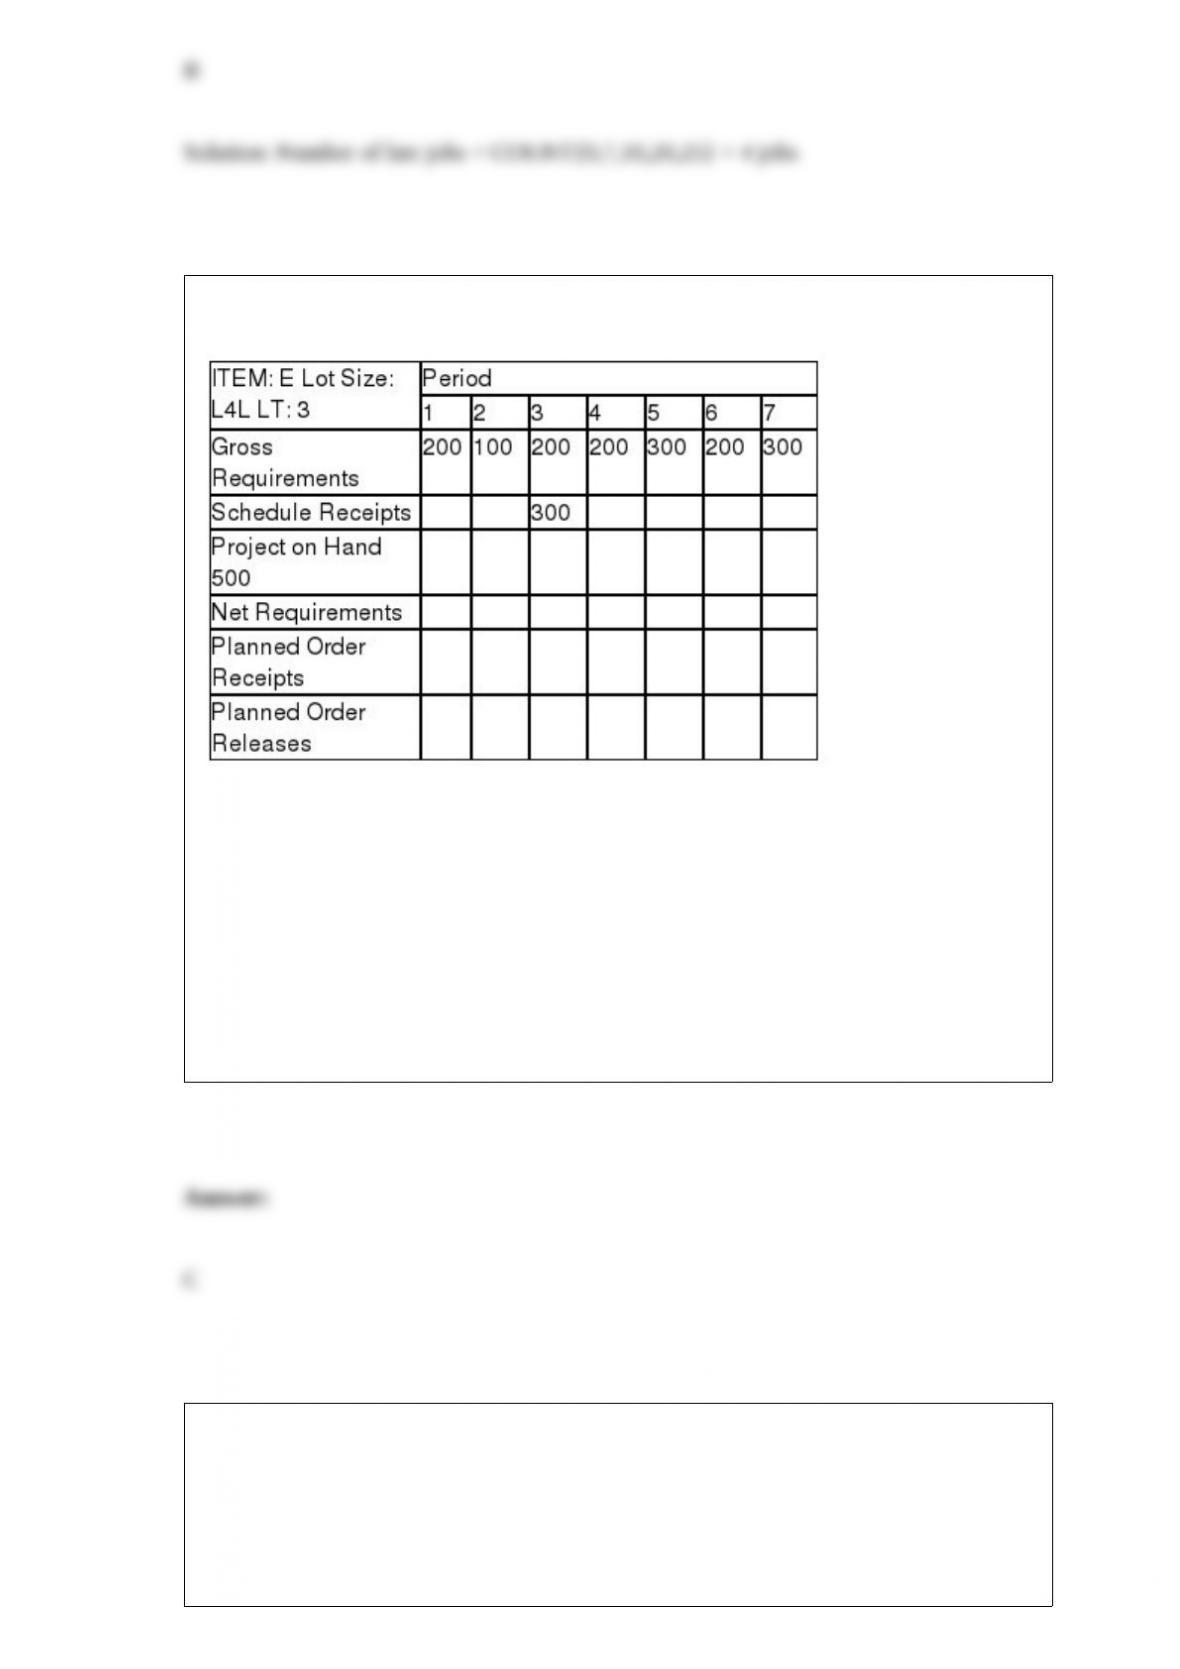
Given the following MRP matrix for Item E:
The projected on hand quantity at the end of period 3 is
a. 0.
b. 100.
c. 300.
d. 500.
Consider an espresso stand with a single barista. Customers arrive at the stand at the
rate of 28 per hour according to a Poisson distribution. Service times are exponentially
distributed with a service rate of 35 customers per hour. The average number of
customers in the system (i.e., waiting and being served) is
a. 4.0
b. 3.8
c. 3.2
d. 2.0
Which area of the world takes a lot of holidays potentially impacting project schedules?
a. Asia.
b. Southern Europe
c. North America
d. None of these answer choices is correct.
Consider an espresso stand with a single barista. Customers arrive at the stand at the
rate of 28 per hour according to a Poisson distribution. Service times are exponentially
distributed with a service rate of 35 customers per hour. The probability that the server
is idle is
a. 0.20
b. 0.60
c. 0.80
d. 1.00
In ___________________ replenishment, the supplier and customer care continuously
update data.
a. demand
b. ongoing
c. continuous
d. forecasted
If the following jobs are sequenced according to the FCFS rule then job C is completed
on day (assume zero for today’s date)
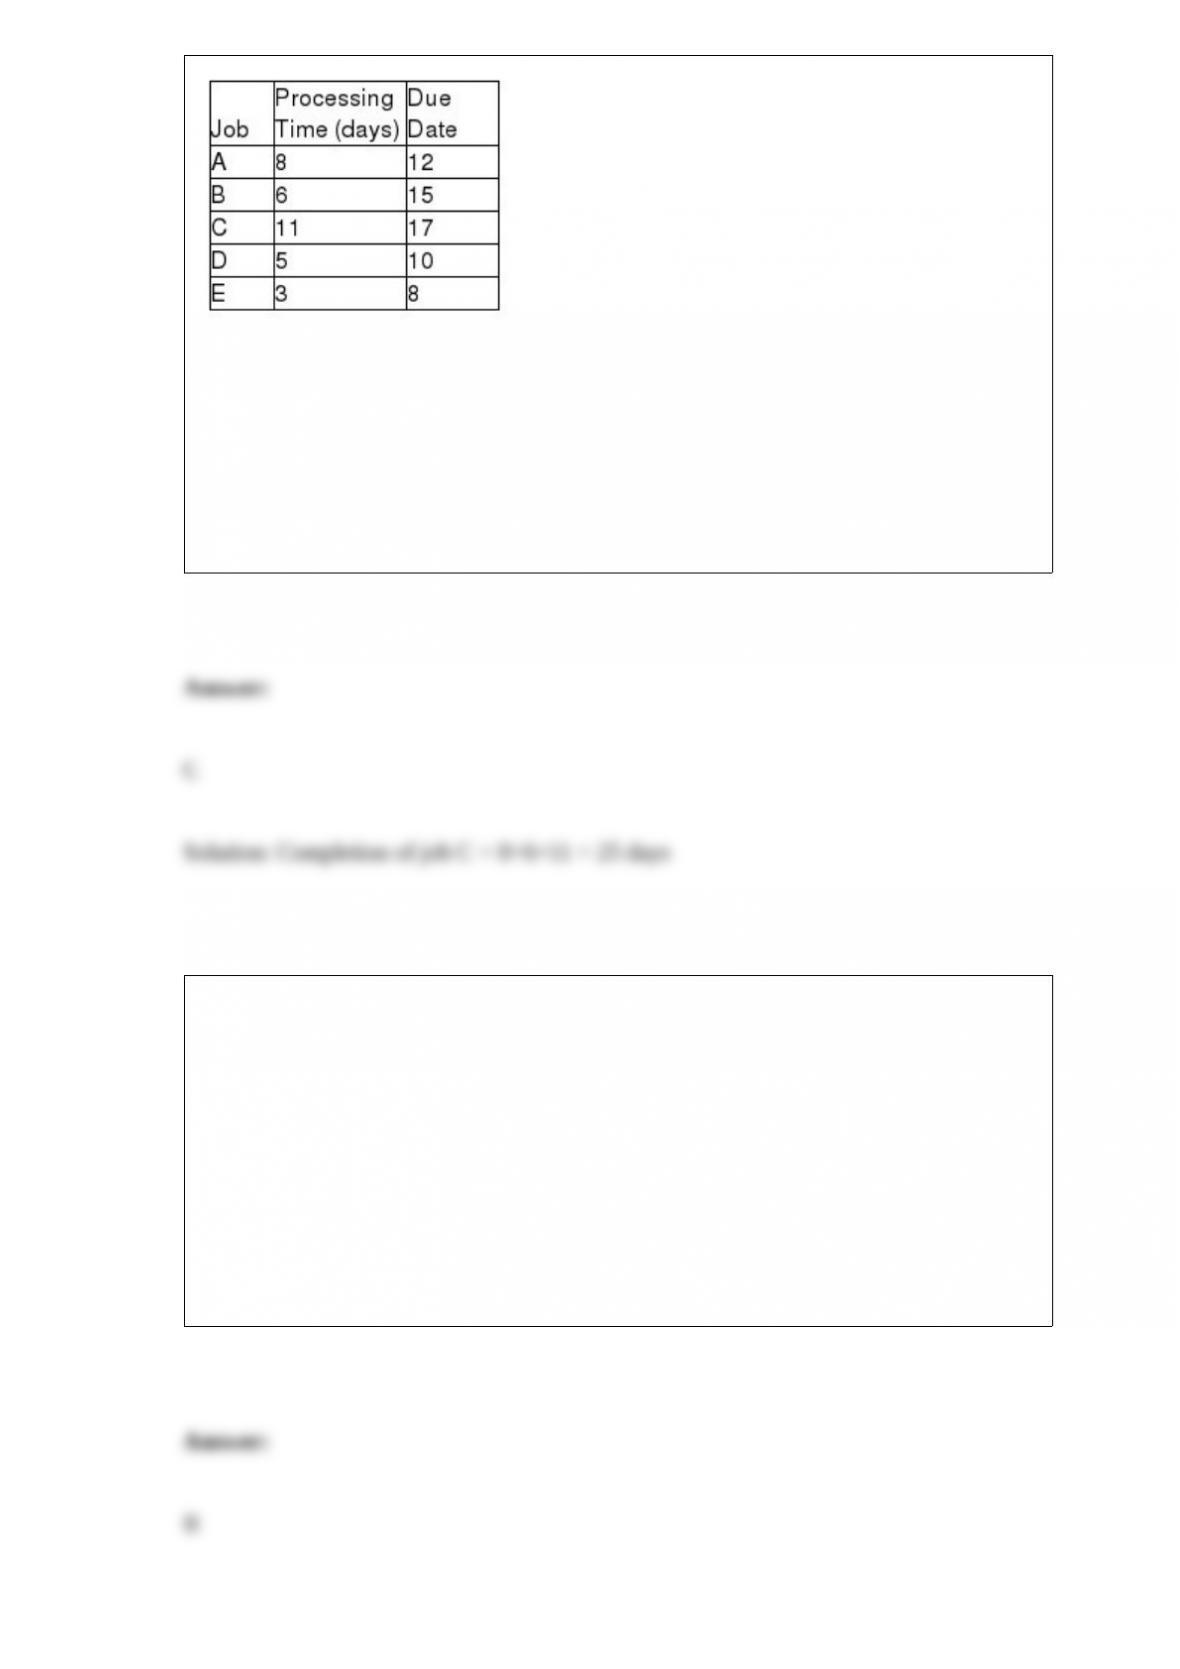
a. 11.
b. 17.
c. 25.
d. 30.
An operating characteristic (OC) curve is a graph that measures
a. the acceptable proportion of defects in a lot to the consumer.
a. the probability of accepting a lot for different quality levels with a specific sampling
plan.
a. the probability of accepting a lot in which the fraction of defectives exceeds the lot
tolerance percent defective.
a. the maximum number of defective items a consumer will accept in a lot.
A ___________ is a foolproof device that prevents defects from occurring.
a. kaizen
b. jidoka
c. muda
d. poka-yoke
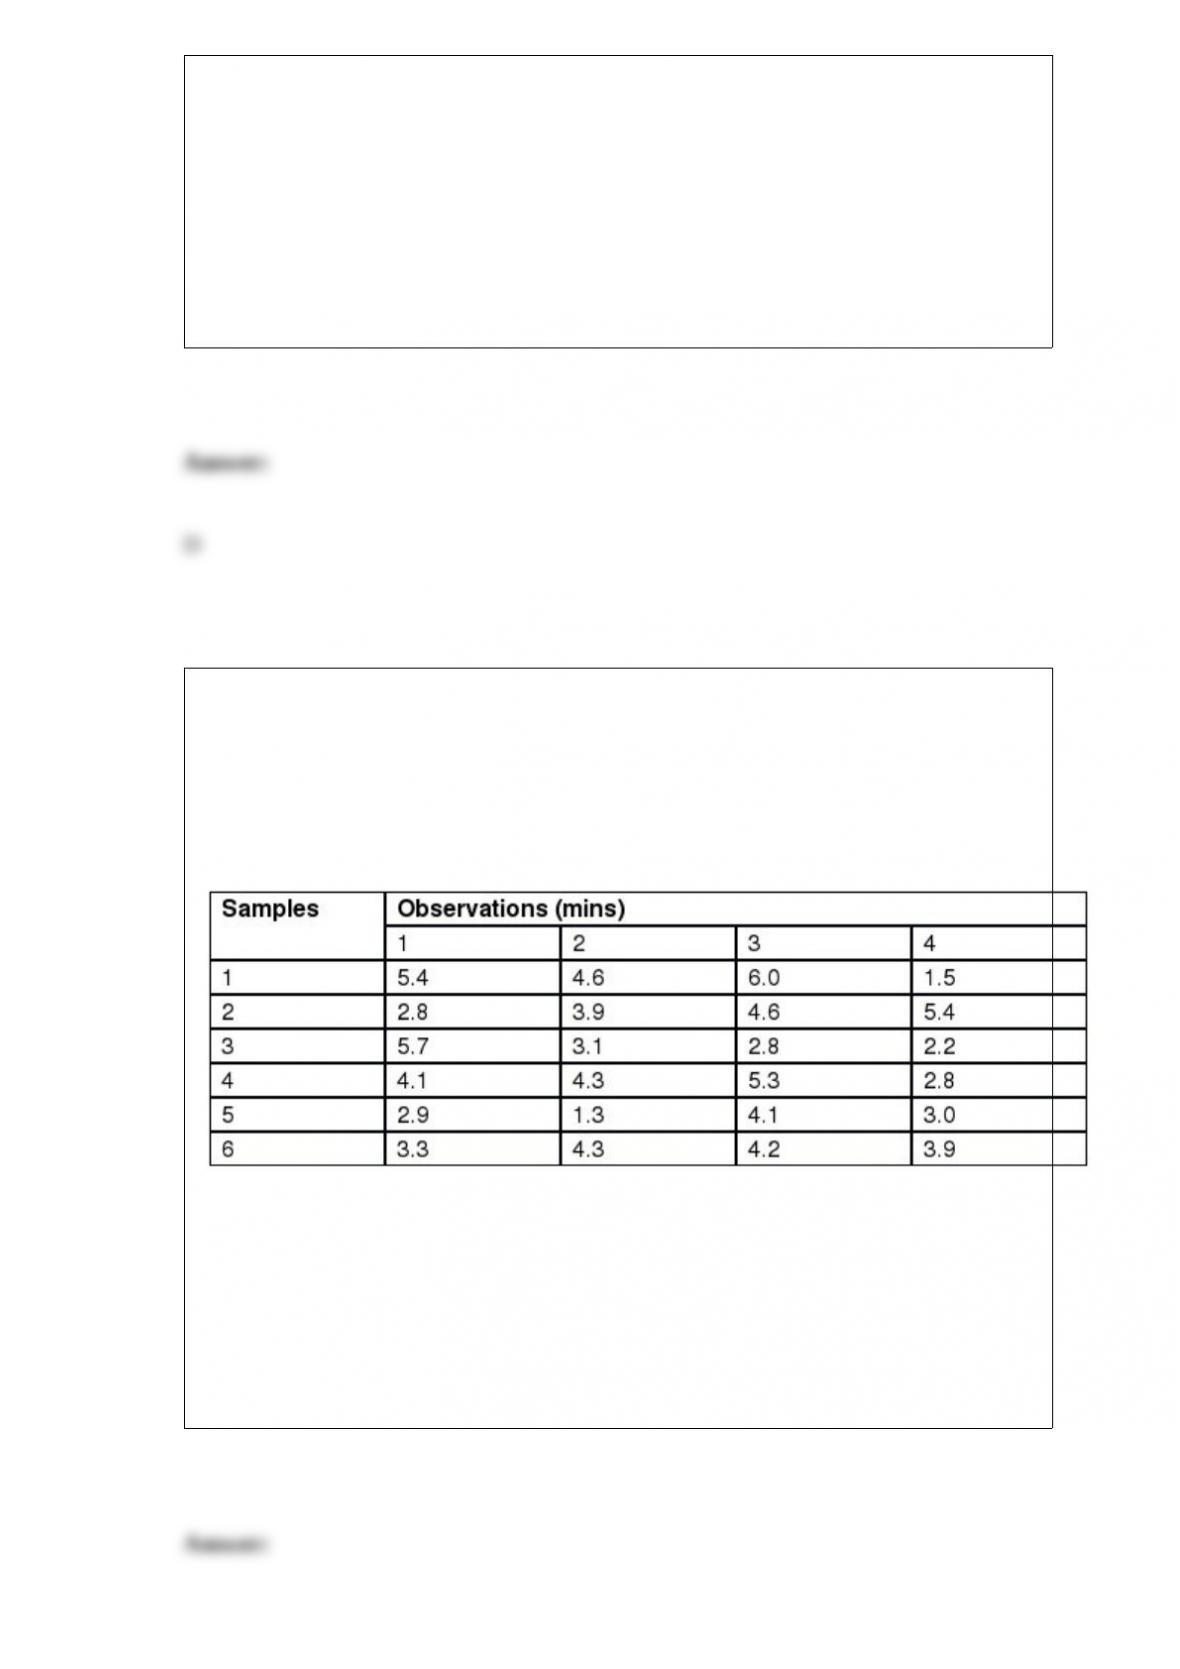
Dumplings ‘“To-Go (DTG) provides take-out dumplings and noodle dishes to
customers at its chain of drive-through restaurants. The target for a customer’s waiting
time is 3.0 minutes +/- 1 minute. Each month, one of the managers observes the
drive-through process and collects a sample of 4 waiting times a day over a 6 day
period. The data from one restaurant appears below. If DTG were to construct an X-bar
chart from this data, the centerline would be
a. 2.87
b. 3.70
c. 3.81
d. 4.28
Which of the following is not a characteristic of a service?
a. Intangible
b. Variable output
c. Difficult to emulate
d. Perishable
A service counter employs two servers. On average a server requires 8 minutes to
process a customer and service times follow an exponential distribution. Customers
arrive at the counter at the rate of 12 per hour according to a Poisson distribution. The
average amount of time, in minutes, spent in the system (i.e., waiting and being served)
is approximately
a. 0.237 minutes
b. 14.22 minutes
c. 22.20 minutes
d. 33.30 minutes