
In an event X, the probability of rolling a sum of 8 on two dice is 5/36 while the
probability of
rolling an 11 is 2/36. In another event Y, the probability of rolling a 2 is 1/36, the
probability of
rolling a 9 is 4/36, and the probability of rolling a 4 is 3/36.
Consider an event Z that includes all outcomes of rolling two dice whose sum is odd.
What is the probability that either event Y or Z occurs?
A) 26/36
B) 22/36
C) 10/36
D) 18/36
When data are classified by the type of measurement scale, which is the strongest form
of measurement?
A) nominal
B) interval
C) ordinal
D) ratio

Which of the following is true of random partitioning?
A) It cannot be used for creating training data sets.
B) It can contain any non-negative value from the observations.
C) It can include negative-value observations in its data.
D) It selects its data based on observations that have similar properties.
Which of the following conditions is the optimal solution to the newsvendor problem,
where Q is the quantity to be purchased, and D is demand?
A) Q > D
B) Q = D
C) D > Q
D) Q / D = 0
The ________ indicates how much the value of the objective function will change as
the right-hand side of a constraint is increased by 1.
A) objective coefficient
B) shadow price
C) binding constraint
D) reduced cost
One of the measures of location is calculated as 88. Which of the following measures of
location corresponds to this value?
A) mean
B) mode
C) median
D) midrange
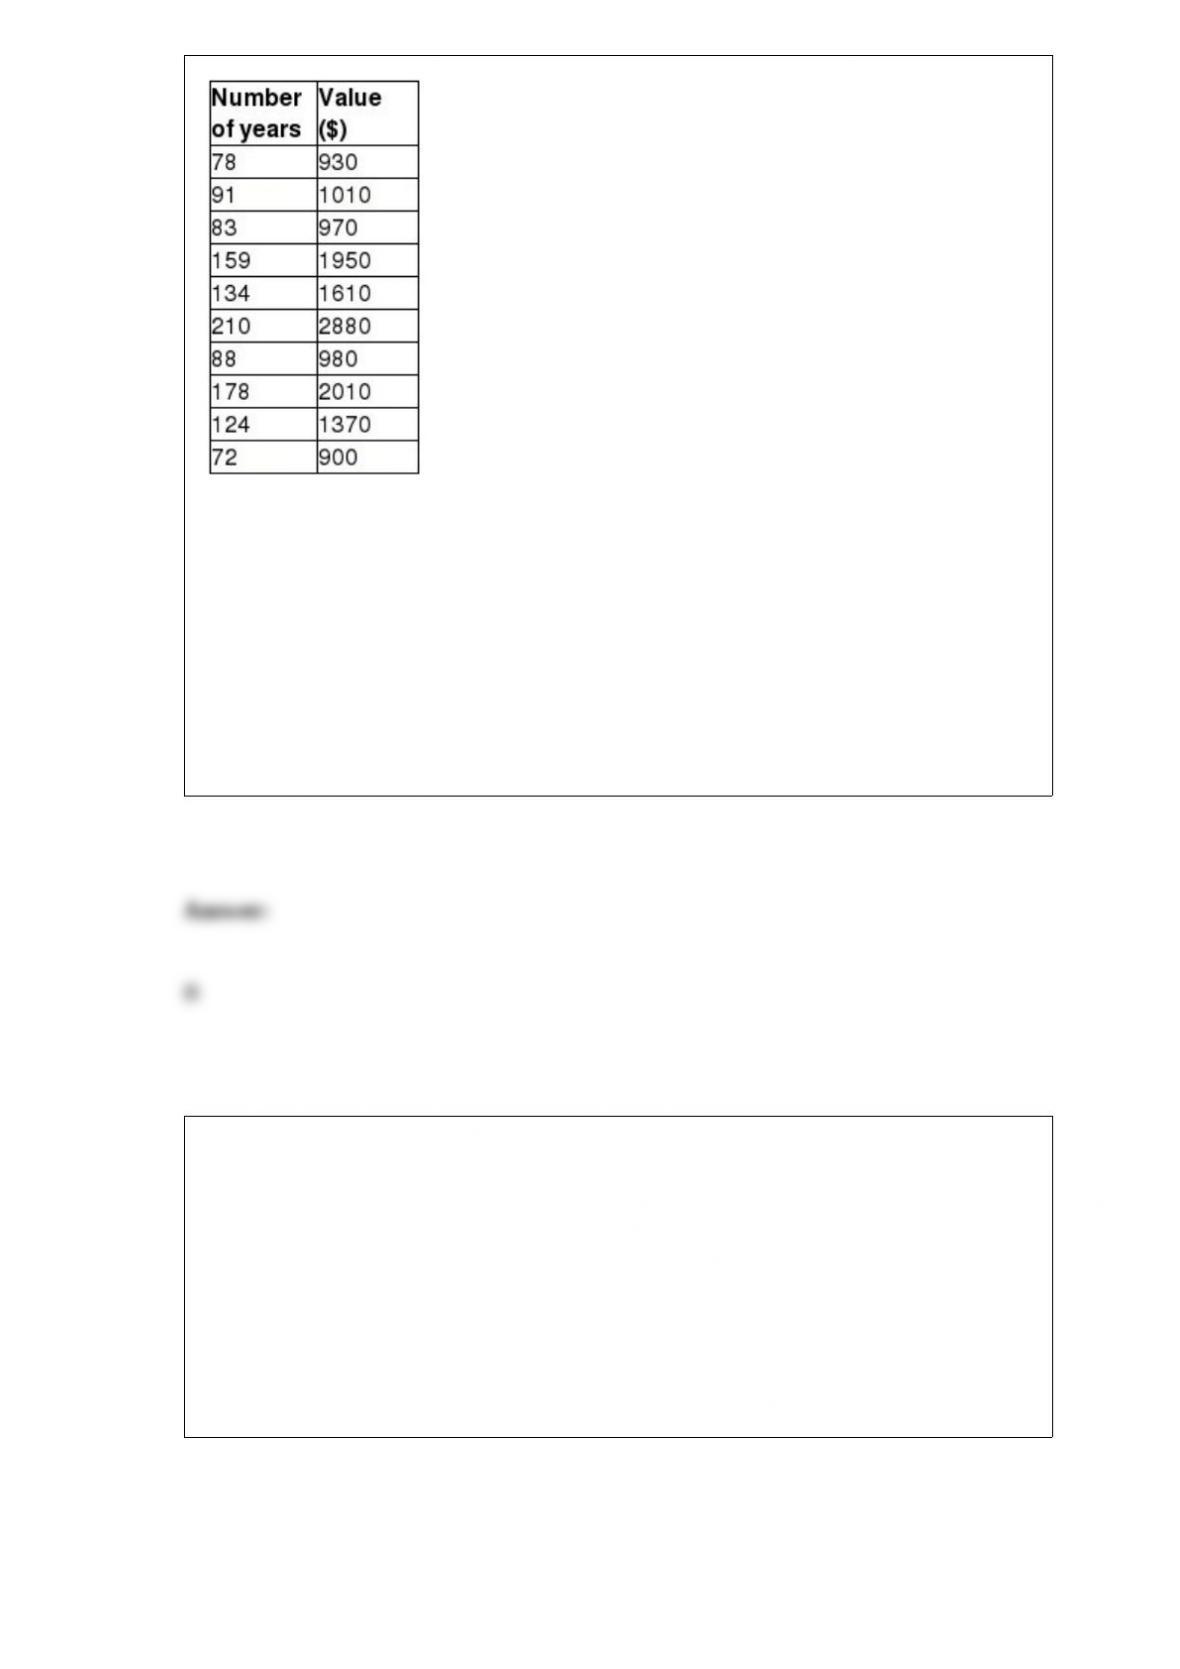
The following table exhibits the age of antique furniture and the corresponding prices.
Use the table to answer the following question(s). (Hint: Use scatter diagram and the
Excel Trendline tool where necessary).
What is the relationship between the age of the furniture and their values?
A) Nonlinear
B) Linear
C) Curvilinear
D) No relationship
Pickson Luthiers Corporation is studying where to locate a phone charging point on the
factory floor. The locations of five production cells are expressed as X– and
Y-coordinates on a rectangular grid of the factory layout. The daily demand for the
charging point (measured as the number of trips to the charging point) at each
production cell is also known. Because of the nature of the equipment layout in the
factory and for safety reasons, workers must travel along marked horizontal and vertical
aisles to access the charger. Thus, the distance from a cell to the charger is measured as
rectilinear distance.
The table below provides the relevant information.
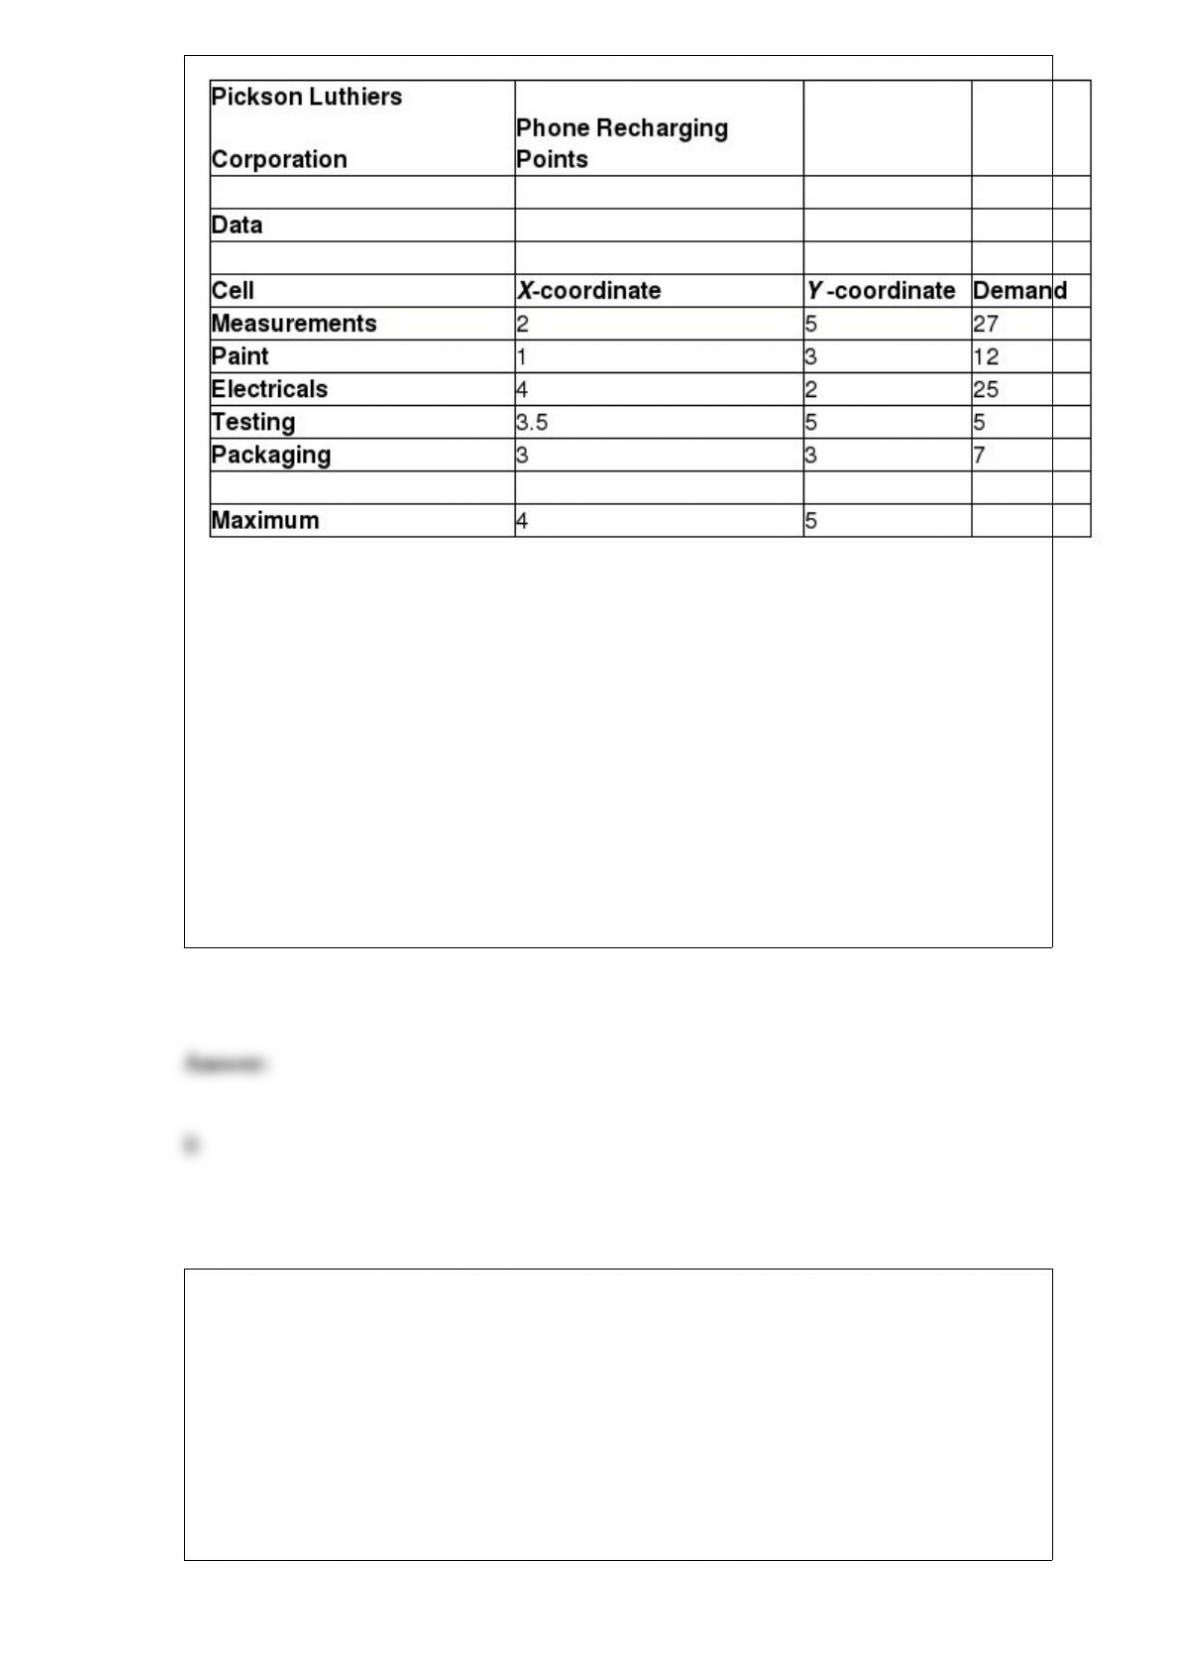
The optimal location should minimize the total weighted distance between the charging
point and all production cells, where the weights are the daily number of trips to the
phone charging point.According to the model, which of the following is the weighted
distance between the phone charger and Testing cell?
A) 7.00
B) 17.50
C) 22.50
D) 27.50
The confidence coefficient is denoted by:
A) α
B) 1 – β
C) β
D) 1 – α
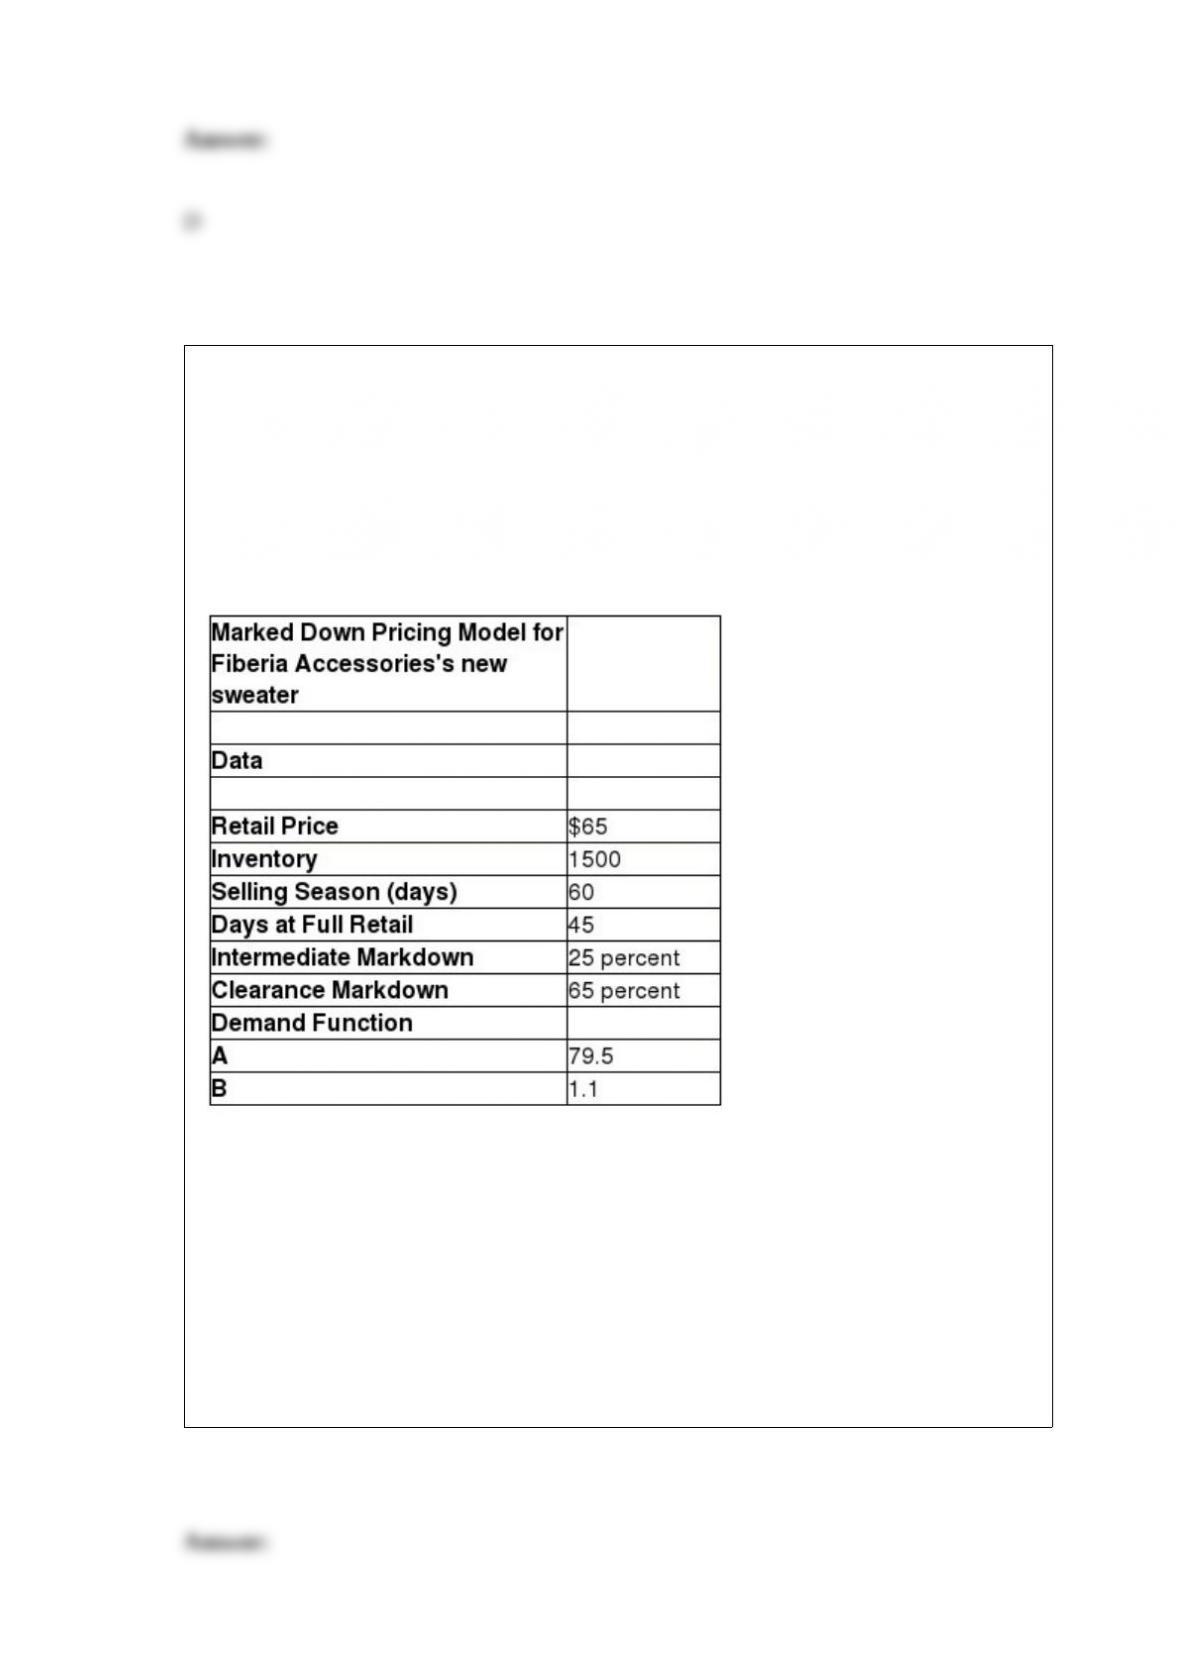
Fiberia Accessories, a clothing retailer, is planning to introduce a new line of sweaters
as part of the winter collection for $65 with an inventory of 1500. The main selling
season is 60 days between November and December. The store then sells the remaining
units in a clearance sale at 65 percent discount. Out of the 60 main retail days, Fiberia
sells the sweaters at full retail price for only 45 days, while giving a discount of 25
percent for the remaining 15 days. The demand functions a, and b are given as 79.5 and
1.1 respectively.
Calculate the total revenue for the new line of sweaters.
A) $59,426.25
B) $48,871.88
C) $23,400
D) $43,231.09

For a lower-tail test, the p-value in the output from an Excel tool:
A) is correct if the test-statistic is negative.
B) is the difference from 1.0 if the test-statistic is negative.
C) is correct if the test-statistic is zero.
D) is correct if the test-statistic is positive.
Calculate the coefficient of variation from the following
z-score = 1.32; standard deviation = 0.173; mean = 4.7; total variation = 0.6
A) 27.16
B) 156.66
C) 0.04
D) -0.5
Which of the following represents the proportion of the total number of observations
that fall at or below the upper limit of each group?

A) Percentile
B) Pareto chart
C) Frequency distribution
D) Cumulative relative frequency
Which of the following is true about Excel outputs Multiple R?
A) It is often referred to as the coefficient of determination.
B) A value of 0 indicates positive correlation.
C) A negative slope of the regression line denotes a positive Multiple R.
D) It is another name for the sample correlation coefficient, r.
Which of the following is a Type I error?
A) the null hypothesis is actually true, and the hypothesis test correctly fails to reject it
B) the null hypothesis is actually false, but the test incorrectly fails to reject it
C) the null hypothesis is actually false, and the test correctly rejects it
D) the null hypothesis is actually true, but the hypothesis test incorrectly rejects it
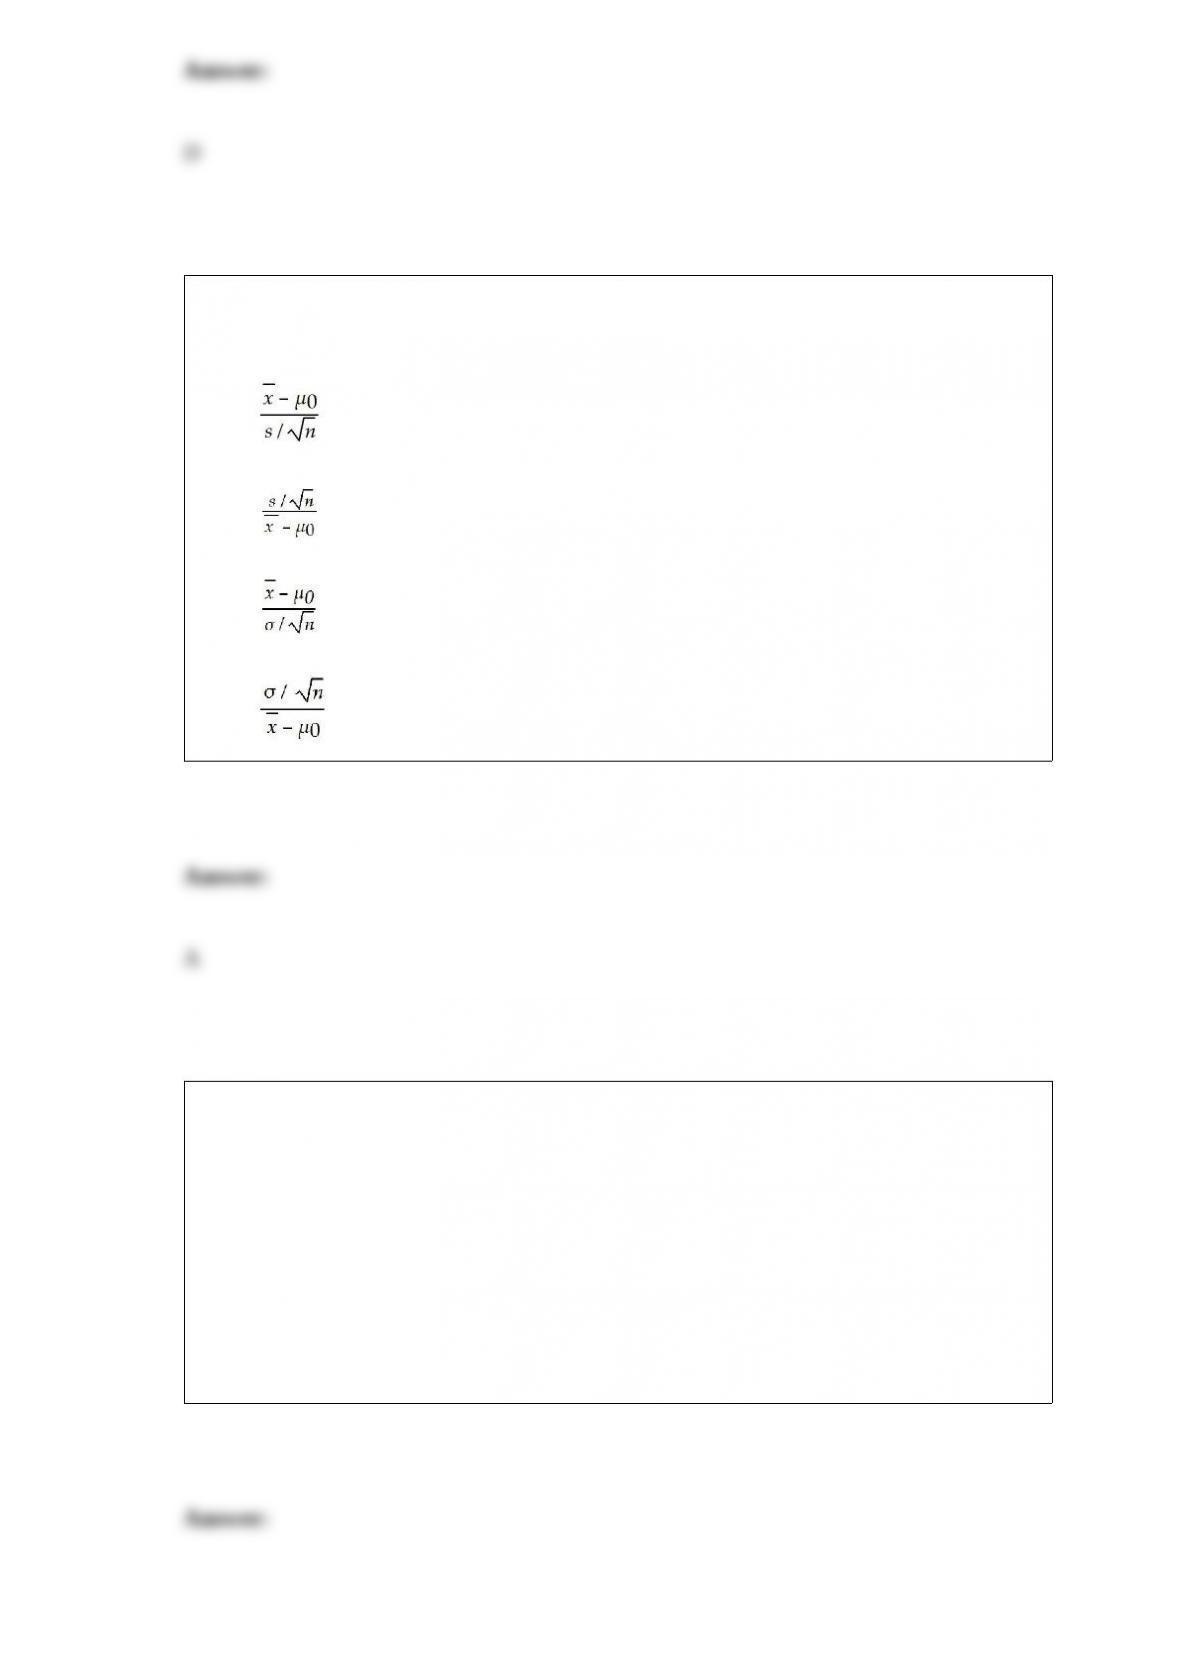
Which of the following is the test statistic for a one-sample test for mean when the
population standard deviation is unknown?
A) t =
B) z =
C) z =
D) t =
In the equation Cp = (upper specification – lower specification)/total variation, what
does Cp denote?
A) capacity variation index
B) capability pattern
C) process capability index
D) capability push
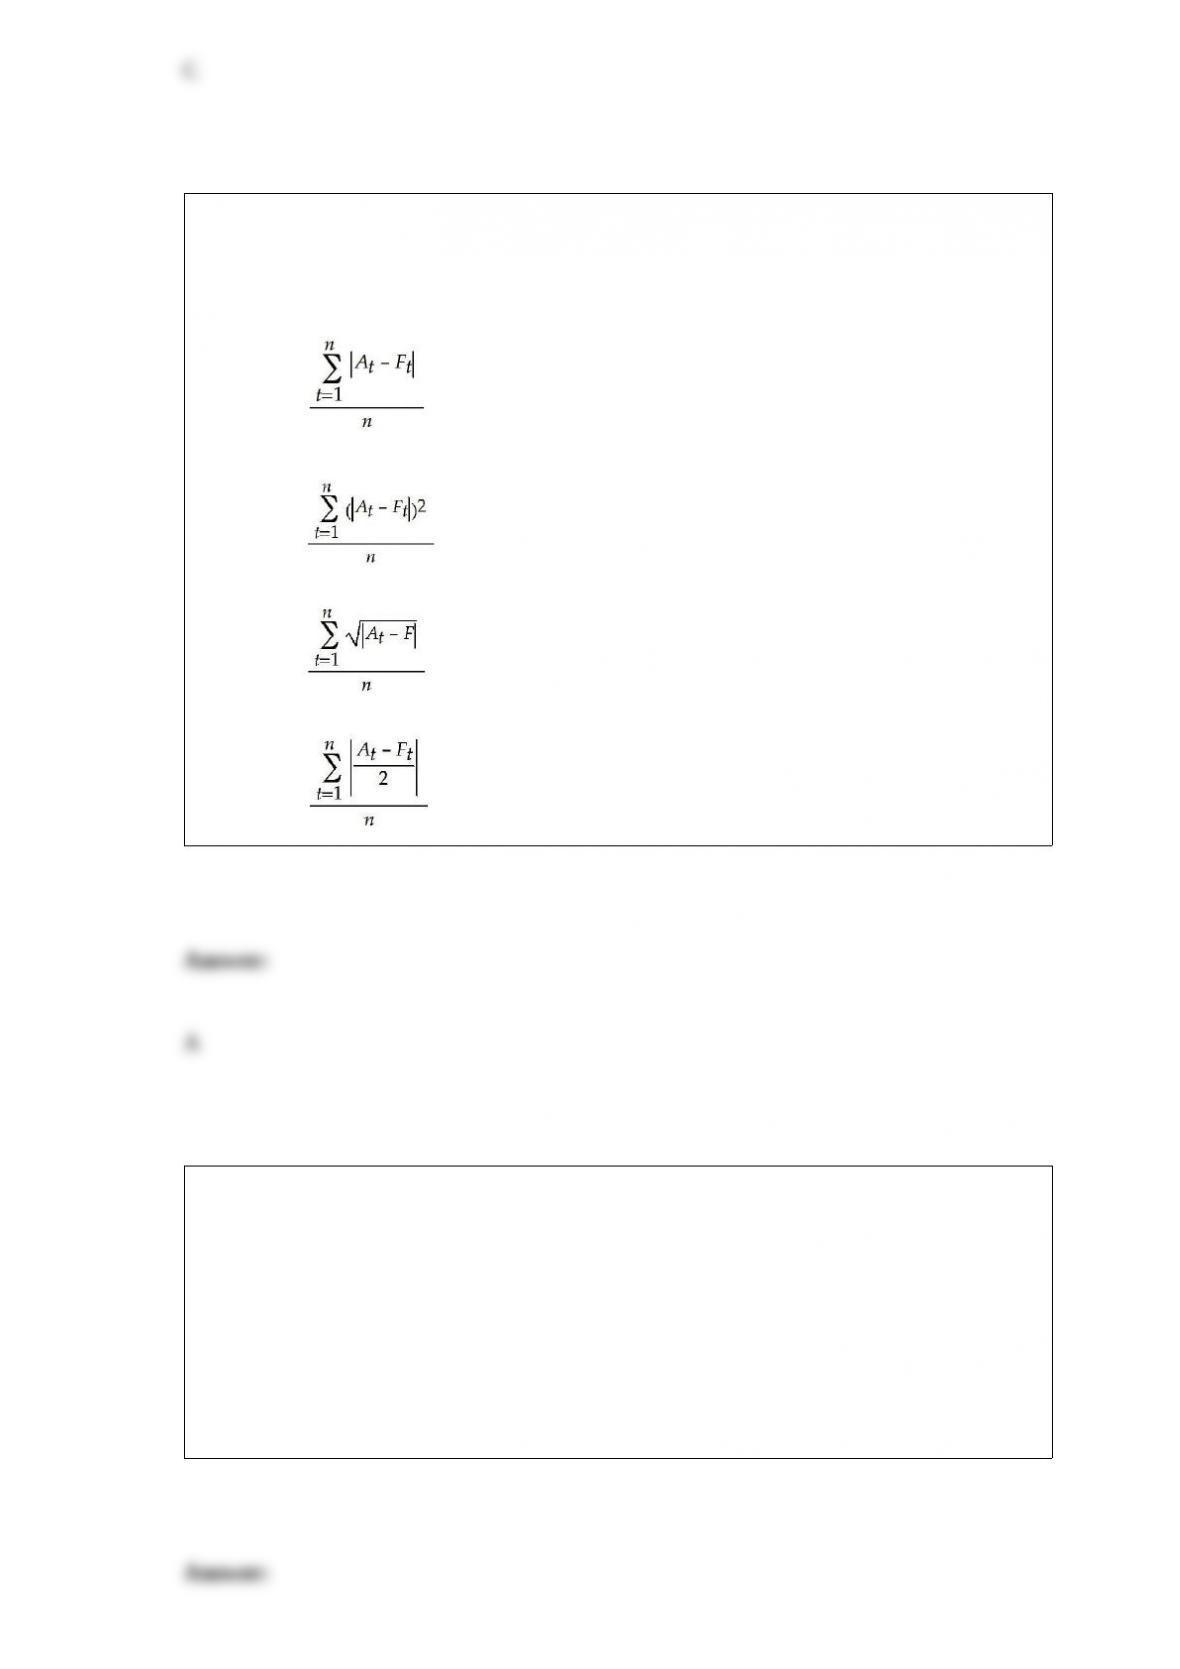
If the actual value of a time series at time t and the forecast value for time t is denoted
by At and Ft respectively, then the formula for the mean absolute deviation over a range
of forecasted values is ________.
A) MAD =
B) MAD =
C) MAD =
D) MAD =
The difference between the first and third quartiles is referred to as the ________.
A) standard deviation
B) variance
C) interquartile range
D) midrange
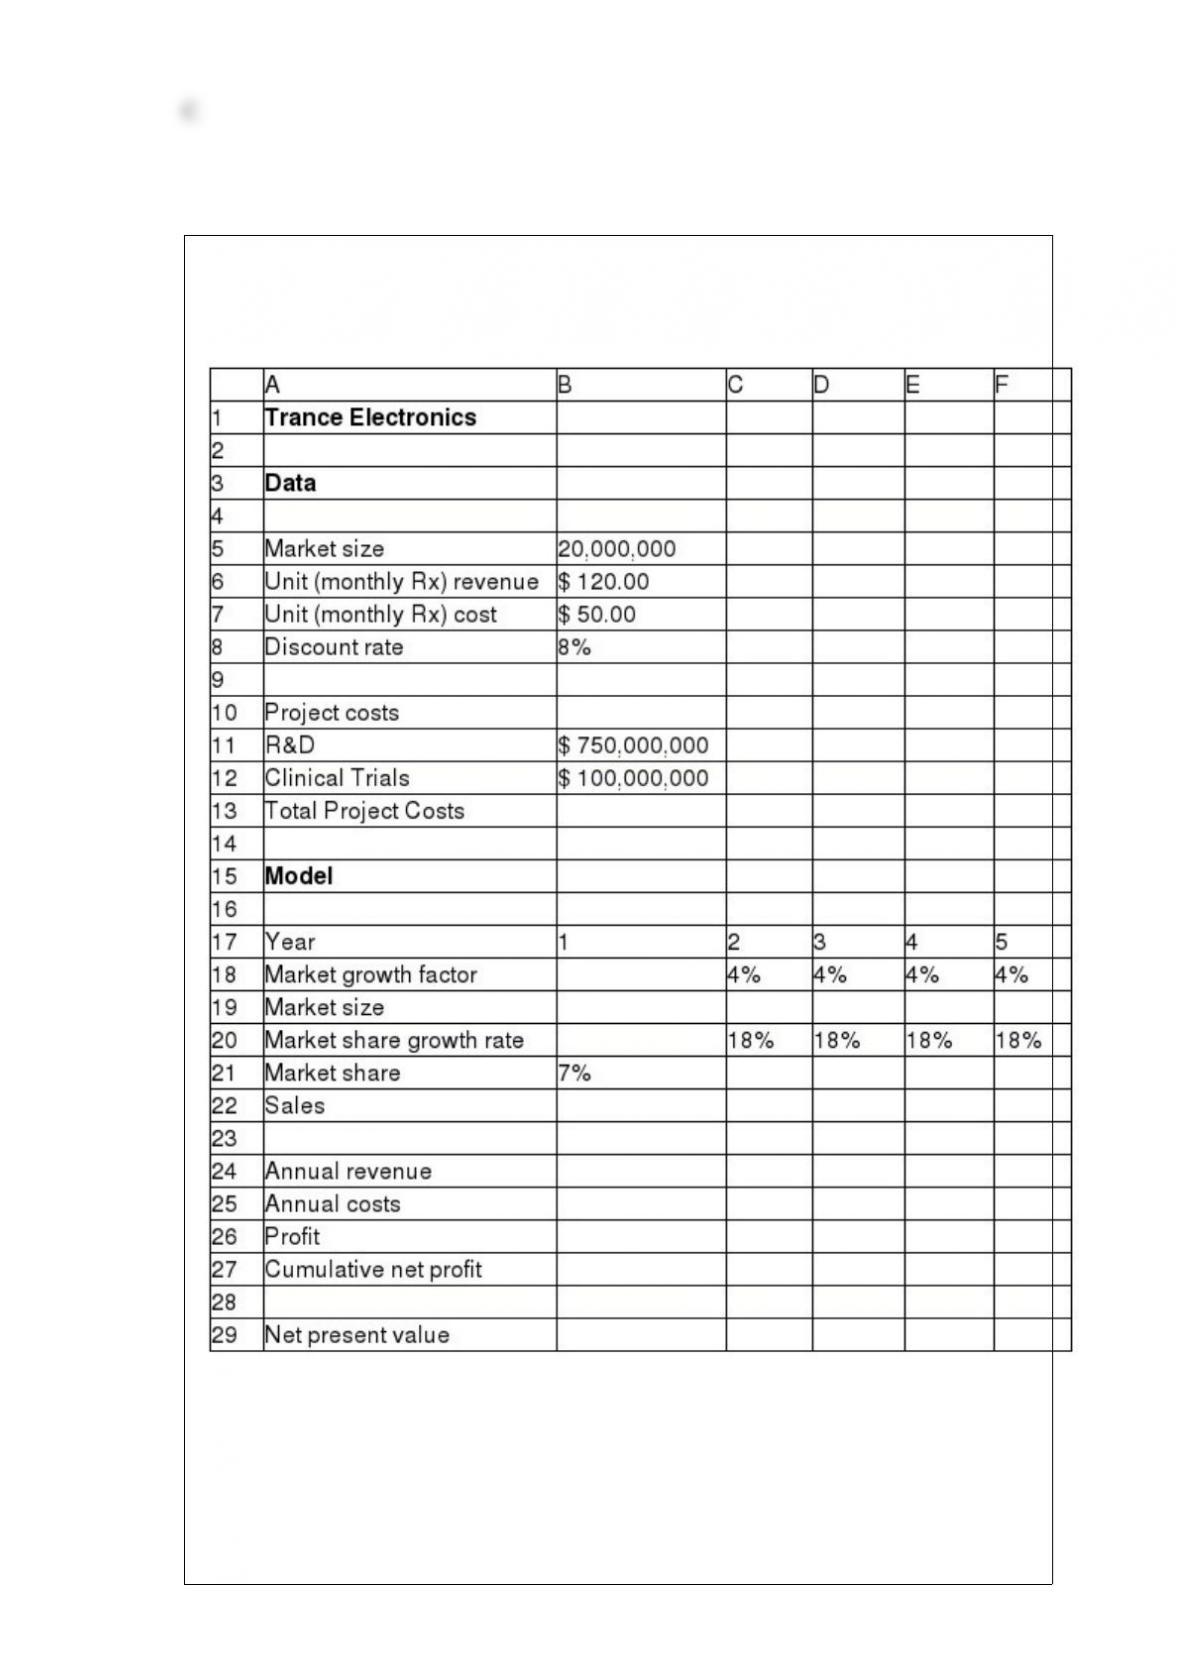
Below is a spreadsheet for Trance Electronics.
Suppose that the project manager of Trance Electronics has identified the following
uncertain variables in the model and the distributions and parameters that describe
them, as follows: Market size: normal with mean of 20,000,000 units and standard
deviation of 4,000,000 units. R&D costs: uniform between $600,000,000 and
$800,000,000.
Clinical trial costs: lognormal with mean of $150,000,000 and standard deviation

$30,000,000. Annual market growth factor: triangular with minimum = 2%,
maximum = 6%, and most likely = 3%.
Annual market share growth rate: triangular with minimum = 15%, maximum =
25%, and most likely = 20%.
The number of trials per simulation is equal to 10,000 at a Sim. Random Seed of 2. Run
the simulation and answer the following questions using the Risk Solver Platform.
What is the standard deviation obtained from the simulation results of the net present
value? [Hint: Choose the approximate value.]
A) $204,868,924
B) $162,135,408
C) $182,992,245
D) $138,134,040
The demand for coffee beans over a period of three months has been represented in the
form of an L-shaped curve. Which form of model was used here?
A) mathematical model
B) visual model
C) kinesthetic (tactile) model
D) verbal model

When will a company use a predictive decision model?
A) when it wishes to determine the best product pricing to maximize revenue
B) when it wishes to know how best to use advertising strategies to influence sales
C) when it wishes to know sales patterns to plan inventory levels
D) when it wishes to ensure that a specified level of customer service is achieved
In statistical terminology, the variable of interest is called a _____.
A) critical value
B) p-value
C) factor
D) test-statistic
What are the different interpretations for correlation coefficient values?
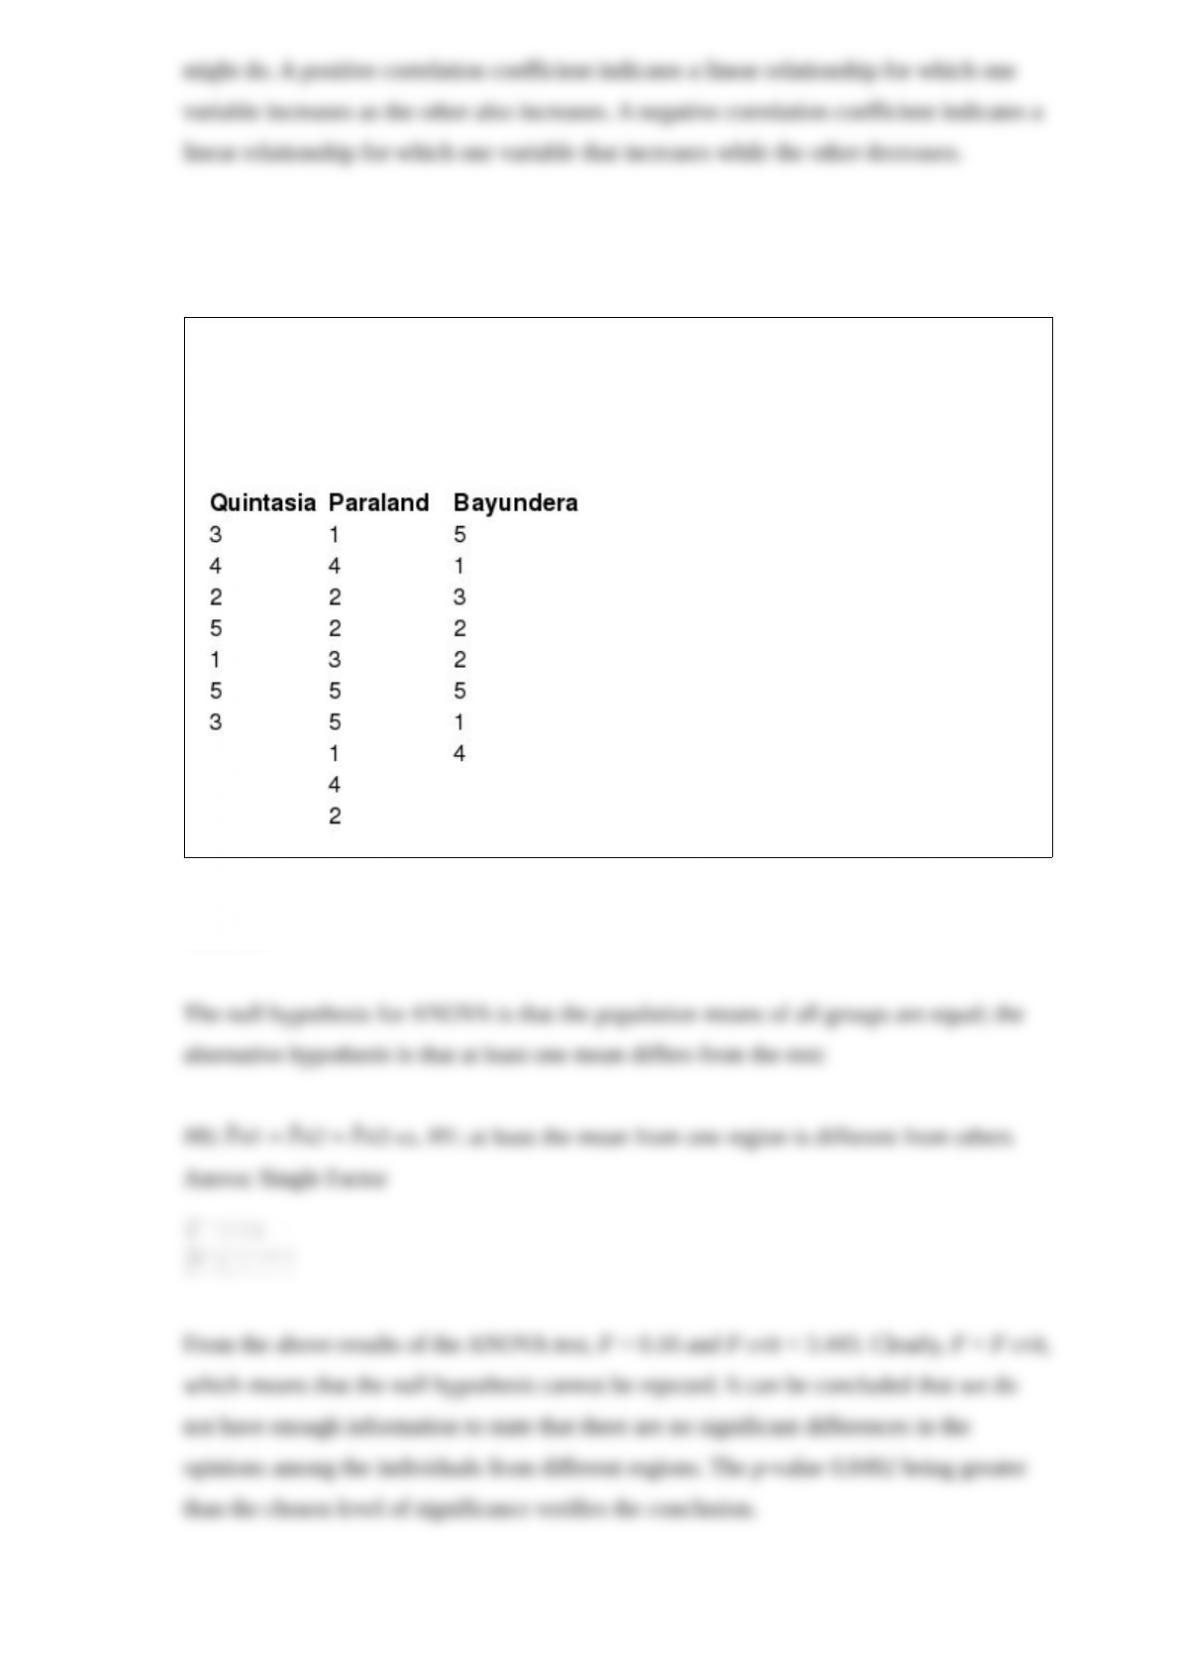
During a study, individuals were asked to rate a product on a scale of 1-5. From the
following data, help the researcher determine whether any significant differences exist
in opinions among individuals from different regions. (Note: Assume a significance
level of 0.05 wherever necessary.)
What are the four possible outcomes that can be obtained by solving a linear
optimization model?
State the three empirical rules in standard deviation.
What is a random number? How is it generated in Excel?
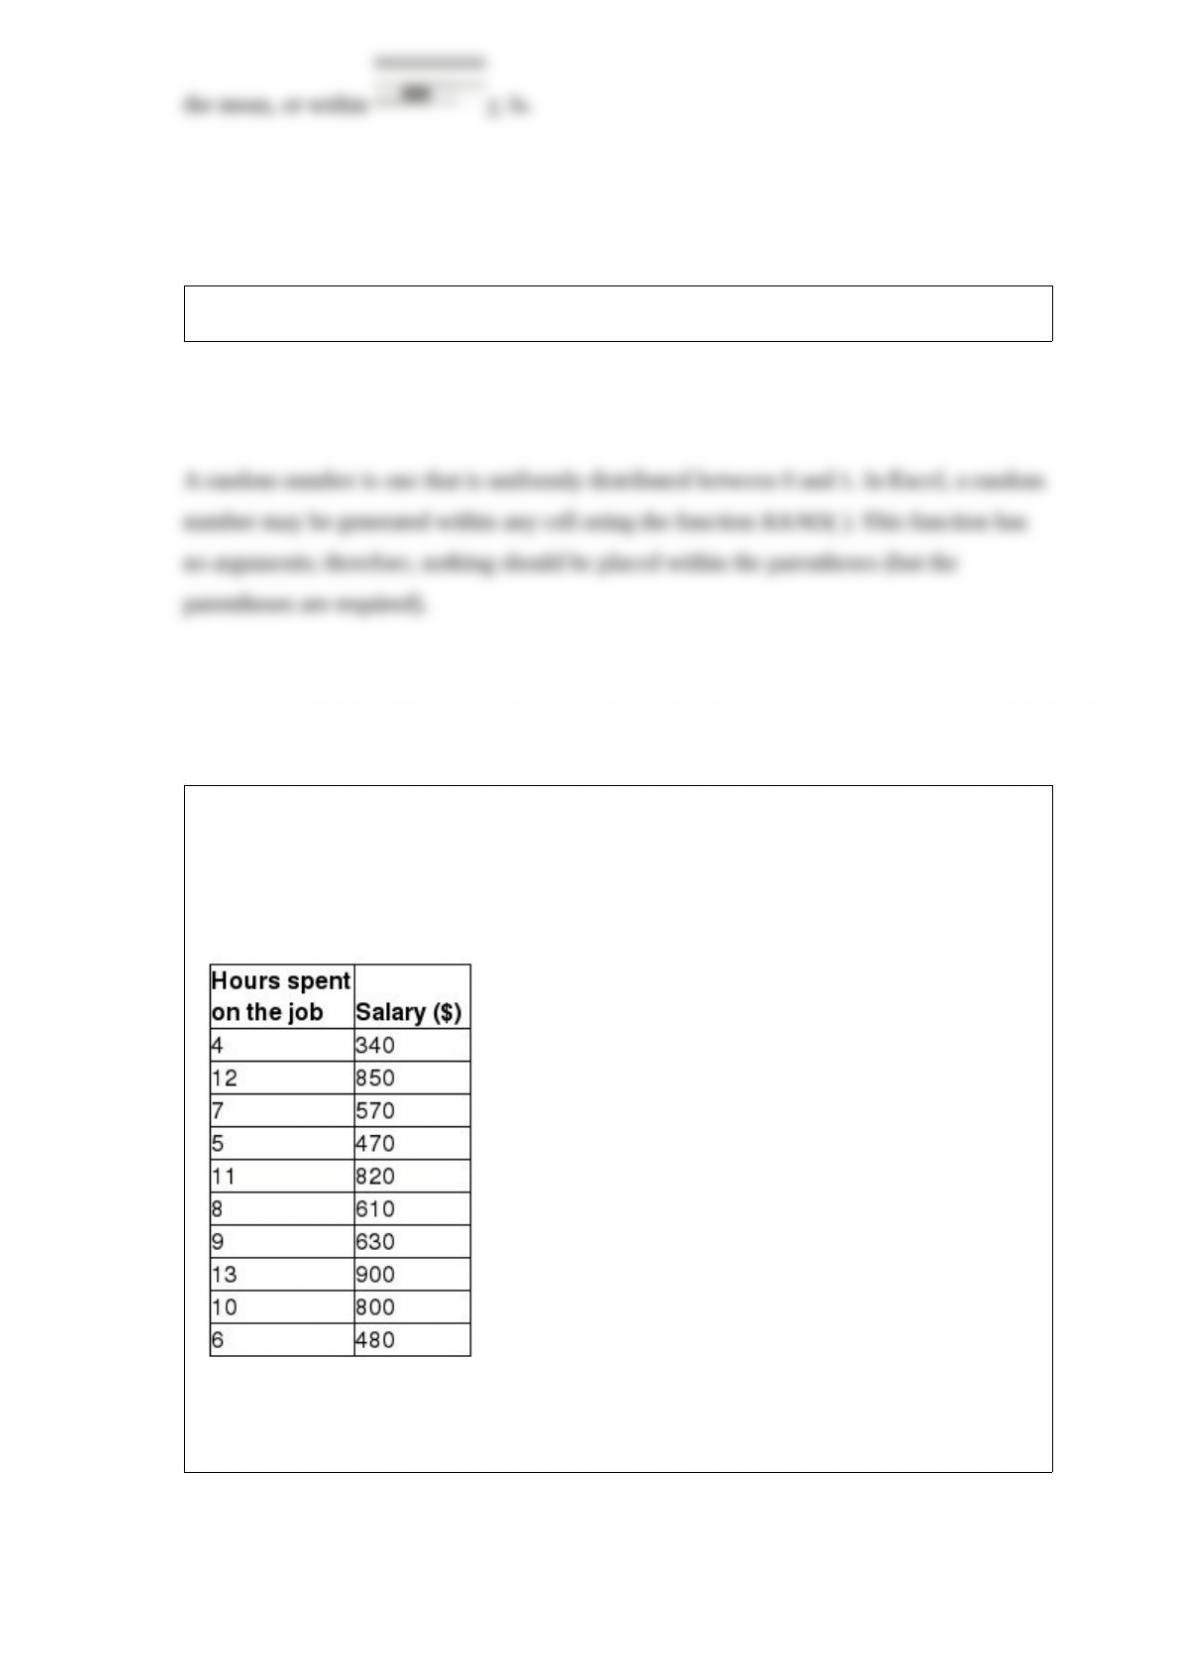
Following is an extract from a firm’s database detailing the number of hours spent on
the job by employees and their corresponding pay. (Note: Assume a level of
significance of 0.05 wherever necessary.)
Construct a scatter diagram and use the Excel Trendline tool to find the best-fitting
simple linear regression model.
= 1
I) = 120
Quantity sold will be the minimum value between demand and quantity purchased
which is 110 units here and surplus quantity is 10.
Therefore, net profit = 6 110 + 3.6 10 – 1 120 = $576.
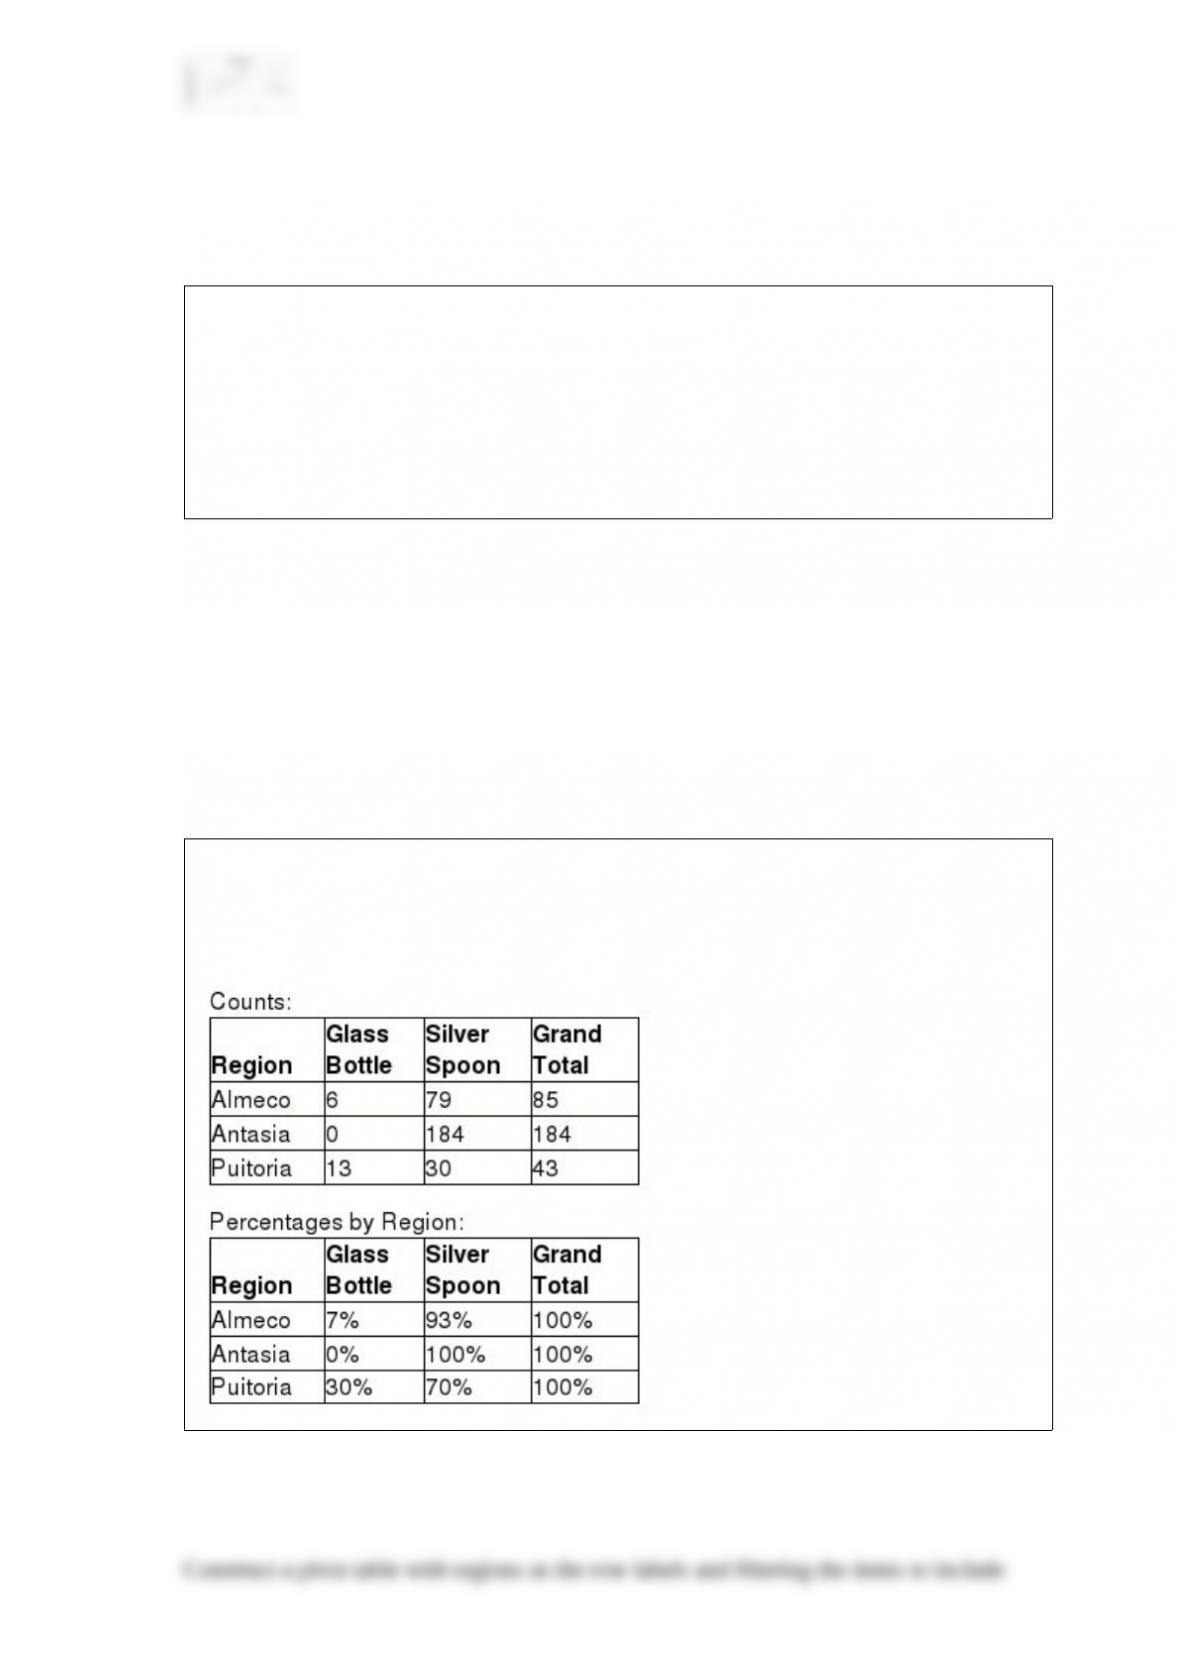
Describe and construct a cross-tabulation showing the region-wise percentage
breakdown of purchase of glass bottles and silver spoons and visually represent the data
in a 3-D column chart.