
Chapter 15 – Time Series Analysis and Forecasting
True / False
1. Time series methods base forecasts only on past values of the variables.
a.
True
b.
False
True
1
Introduction
2. Quantitative forecasting methods can be used when past information about the variable being forecast is unavailable.
a.
True
b.
False
False
1
Introduction
3. Trend in a time series must be linear.
a.
True
b.
False
False
1
Trend pattern
4. All quarterly time series contain seasonality.
a.
True
b.
False
False
1
Seasonal pattern
5. A four-period moving average forecast for period 10 would be found by averaging the values from periods 10, 9, 8, and
7.
a.
True
b.
False
False
1
Moving averages
6. If the random variability in a time series is great, a high α value should be used to exponentially smooth out the
fluctuations.
a.
True
b.
False
False
1
Exponential smoothing
Chapter 15 – Time Series Analysis and Forecasting
7. With fewer periods in a moving average, it will take longer to adjust to a new level of data values.
a.
True
b.
False
False
1
8. Qualitative forecasting techniques should be applied in situations where time series data exists, but where conditions
are expected to change.
a.
True
b.
False
True
1
9. A time series model with a seasonal pattern will always involve quarterly data.
a.
True
b.
False
False
1
10. Any recurring sequence of points above and below the trend line lasting less than one year can be attributed to the
cyclical component of the time series.
a.
True
b.
False
False
1
11. Smoothing methods are more appropriate for a stable time series than when significant trend or seasonal patterns are
present.
a.
True
b.
False
True
1
12. The exponential smoothing forecast for any period is a weighted average of all the previous actual values for the time
series.
a.
True
b.
False
True
1
Chapter 15 – Time Series Analysis and Forecasting
13. The mean squared error is influenced much more by large forecast errors than is the mean absolute error.
a.
True
b.
False
True
1
14. If a time series has a significant trend pattern, then one should not use a moving average to forecast.
a.
True
b.
False
True
1
15. If the random variability in a time series is great and exponential smoothing is being used to forecast, then a high
alpha (α) value should be used.
a.
True
b.
False
False
1
16. An alpha (α) value of .2 will cause an exponential smoothing forecast to react more quickly to a sudden drop in
demand than will an α equal to .4.
a.
True
b.
False
False
1
17. Exponential smoothing with α = .2 and a moving average with n = 5 put the same weight on the actual value for the
current period.
a.
True
b.
False
True
1
18. Time series data can exhibit seasonal patterns of less than one month in duration.
a.
True
b.
False
True
1
19. When using a moving average of order k to forecast, a small value for k is preferred if only the most recent values of

Chapter 15 – Time Series Analysis and Forecasting
the time series are considered relevant.
a.
True
b.
False
True
1
Moving averages
20. In situations where you need to compare forecasting methods for different time periods, relative measures such as
mean absolute error (MAE) are preferred.
a.
True
b.
False
False
1
Forecast accuracy
Multiple Choice
21. All of the following are true about time series methods except
a.
They discover a pattern in historical data and project it into the future.
b.
They involve the use of expert judgment to develop forecasts.
c.
They assume that the pattern of the past will continue into the future.
d.
Their forecasts are based solely on past values of the variable or past forecast errors.
b
1
Time series patterns
22. Gradual shifting of a time series to relatively higher or lower values over a long period of time is called
a.
periodicity.
b.
cycles.
c.
seasonality.
d.
trend.
d
1
Trend component
23. Seasonal patterns
a.
cannot be predicted.
b.
are regular repeated patterns.
c.
are multiyear runs of observations above or below the trend line.
d.
reflect a shift in the time series over time.
b
1
24. The focus of smoothing methods is to smooth out
Chapter 15 – Time Series Analysis and Forecasting
a.
the random fluctuations.
b.
wide seasonal variations.
c.
significant trend effects.
d.
long range forecasts.
a
1
Moving averages and exponential smoothing
25. Forecast errors
a.
are the difference in successive values of a time series
b.
are the differences between actual and forecast values
c.
should all be nonnegative
d.
should be summed to judge the goodness of a forecasting model
b
1
Forecast accuracy
26. To select a value for α for exponential smoothing
a.
use a small α when the series varies substantially.
b.
use a large α when the series has little random variability.
c.
use a value between 0 and 1
d.
All of the alternatives are true.
d
1
Exponential smoothing
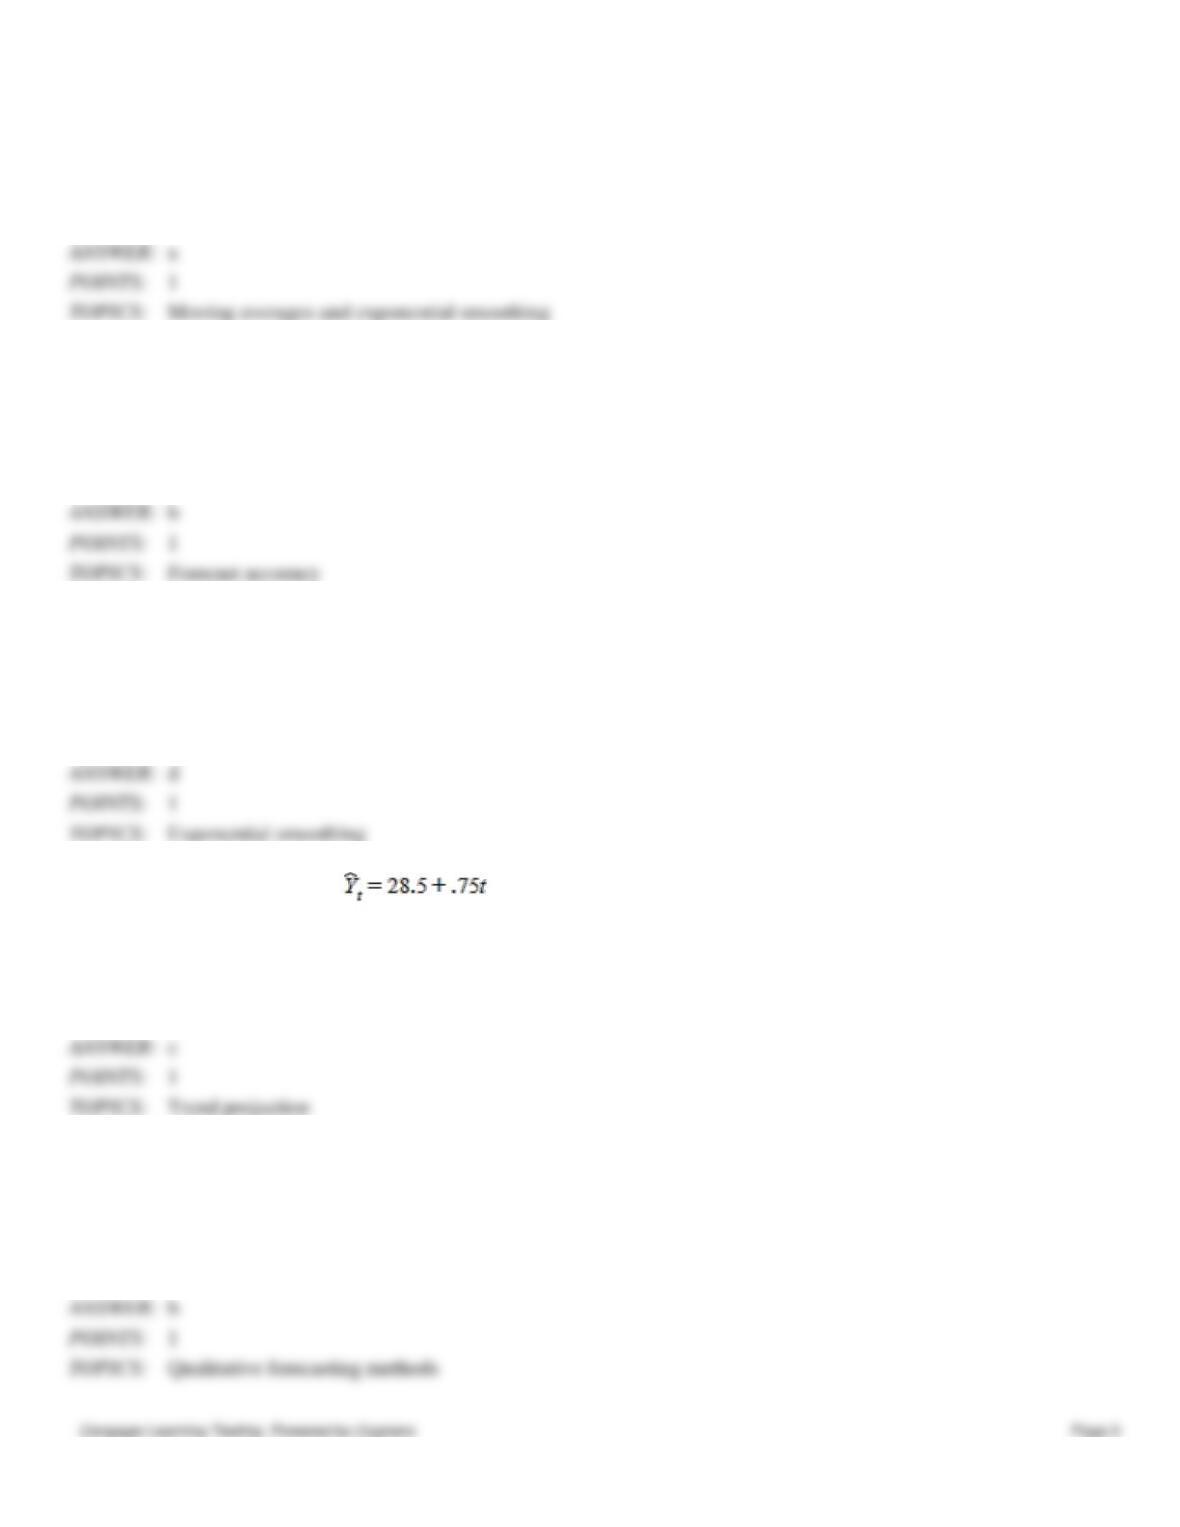
27. Linear trend is calculated as . The trend projection for period 15 is
a.
11.25
b.
28.50
c.
39.75
d.
44.25
c
1
Trend projection
28. All of the following are true about qualitative forecasting methods except
a.
They generally involve the use of expert judgment to develop forecasts.
b.
They assume the pattern of the past will continue into the future.
c.
They are appropriate when past data on the variable being forecast are not applicable.
d.
They are appropriate when past data on the variable being forecast are not available.
b
1
Qualitative forecasting methods
Chapter 15 – Time Series Analysis and Forecasting
29. The trend pattern is easy to identify by using
a.
a moving average
b.
exponential smoothing
c.
regression analysis
d.
a weighted moving average
c
1
Trend pattern
30. The forecasting method that is appropriate when the time series has no significant trend, cyclical, or seasonal pattern is
a.
moving average
b.
mean squared error
c.
mean average error
d.
qualitative forecasting
a
1
Moving averages
31. If data for a time series analysis is collected on an annual basis only, which pattern does not need to be considered?
a.
trend
b.
seasonal
c.
cyclical
d.
horizontal
1
Seasonal pattern
32. One measure of the accuracy of a forecasting model is the
a.
smoothing constant
b.
linear trend
c.
mean absolute error
d.
seasonal index
c
1
Forecast accuracy
33. Using a naive forecasting method, the forecast for next week’s sales volume equals
a.
the most recent week’s sales volume
b.
the most recent week’s forecast
c.
the average of the last four weeks’ sales volumes
d.
next week’s production volume
a
1
Forecast accuracy
Chapter 15 – Time Series Analysis and Forecasting
34. Which of the following forecasting methods puts the least weight on the most recent time series value?
a.
exponential smoothing with α = .3
b.
exponential smoothing with α = .2
c.
moving average using the most recent 4 periods
d.
moving average using the most recent 3 periods
b
1
Moving averages and exponential smoothing
35. Using exponential smoothing, the demand forecast for time period 10 equals the demand forecast for time period 9
plus
a.
α times (the demand forecast for time period 8)
b.
α times (the error in the demand forecast for time period 9)
c.
α times (the observed demand in time period 9)
d.
α times (the demand forecast for time period 9)
b
1
Exponential smoothing
36. Which of the following exponential smoothing constant values puts the same weight on the most recent time series
value as does a 5-period moving average?
a.
α = .2
b.
α = .25
c.
α = .75
d.
α = .8
1
Moving averages and exponential smoothing
37. All of the following are true about a cyclical pattern except
a.
It is often due to multiyear business cycles.
b.
It is often combined with long-term trend patterns and called trend-cycle patterns.
c.
It usually is easier to forecast than a seasonal pattern due to less variability.
d.
It is an alternating sequence of data points above and below the trend line.
1
Cyclical pattern
38. All of the following are true about a stationary time series except
a.
Its statistical properties are independent of time.
b.
A plot of the series will always exhibit a horizontal pattern.
c.
The process generating the data has a constant mean
d.
There is no variability in the time series over time.
d
1
Chapter 15 – Time Series Analysis and Forecasting
39. In situations where you need to compare forecasting methods for different time periods, the most appropriate accuracy
measure is
a.
MSE
b.
MAPE
c.
MAE
d.
ME
ANSWER:
b
POINTS:
1
TOPICS:
Forecast accuracy
40. Whenever a categorical variable such as season has k levels, the number of dummy variables required
a.
k − 1
b.
k
c.
k + 1
d.
2k
ANSWER:
a
POINTS:
1
TOPICS:
Seasonality
Subjective Short Answer
41. The number of cans of soft drinks sold in a machine each week is recorded below. Develop forecasts using a three-
period moving average.
338, 219, 278, 265, 314, 323, 299, 259, 287, 302
Time Period
Actual Value
Forecast
Forecast Error
1
2
3
4
265
278.33
5
314
254.00
6
323
285.67
7
299
300.67
8
259
312.00
9
287
293.67
10
302
281.67
THE FORECAST FOR PERIOD 11 282.67
POINTS:
1
TOPICS:
Moving averages
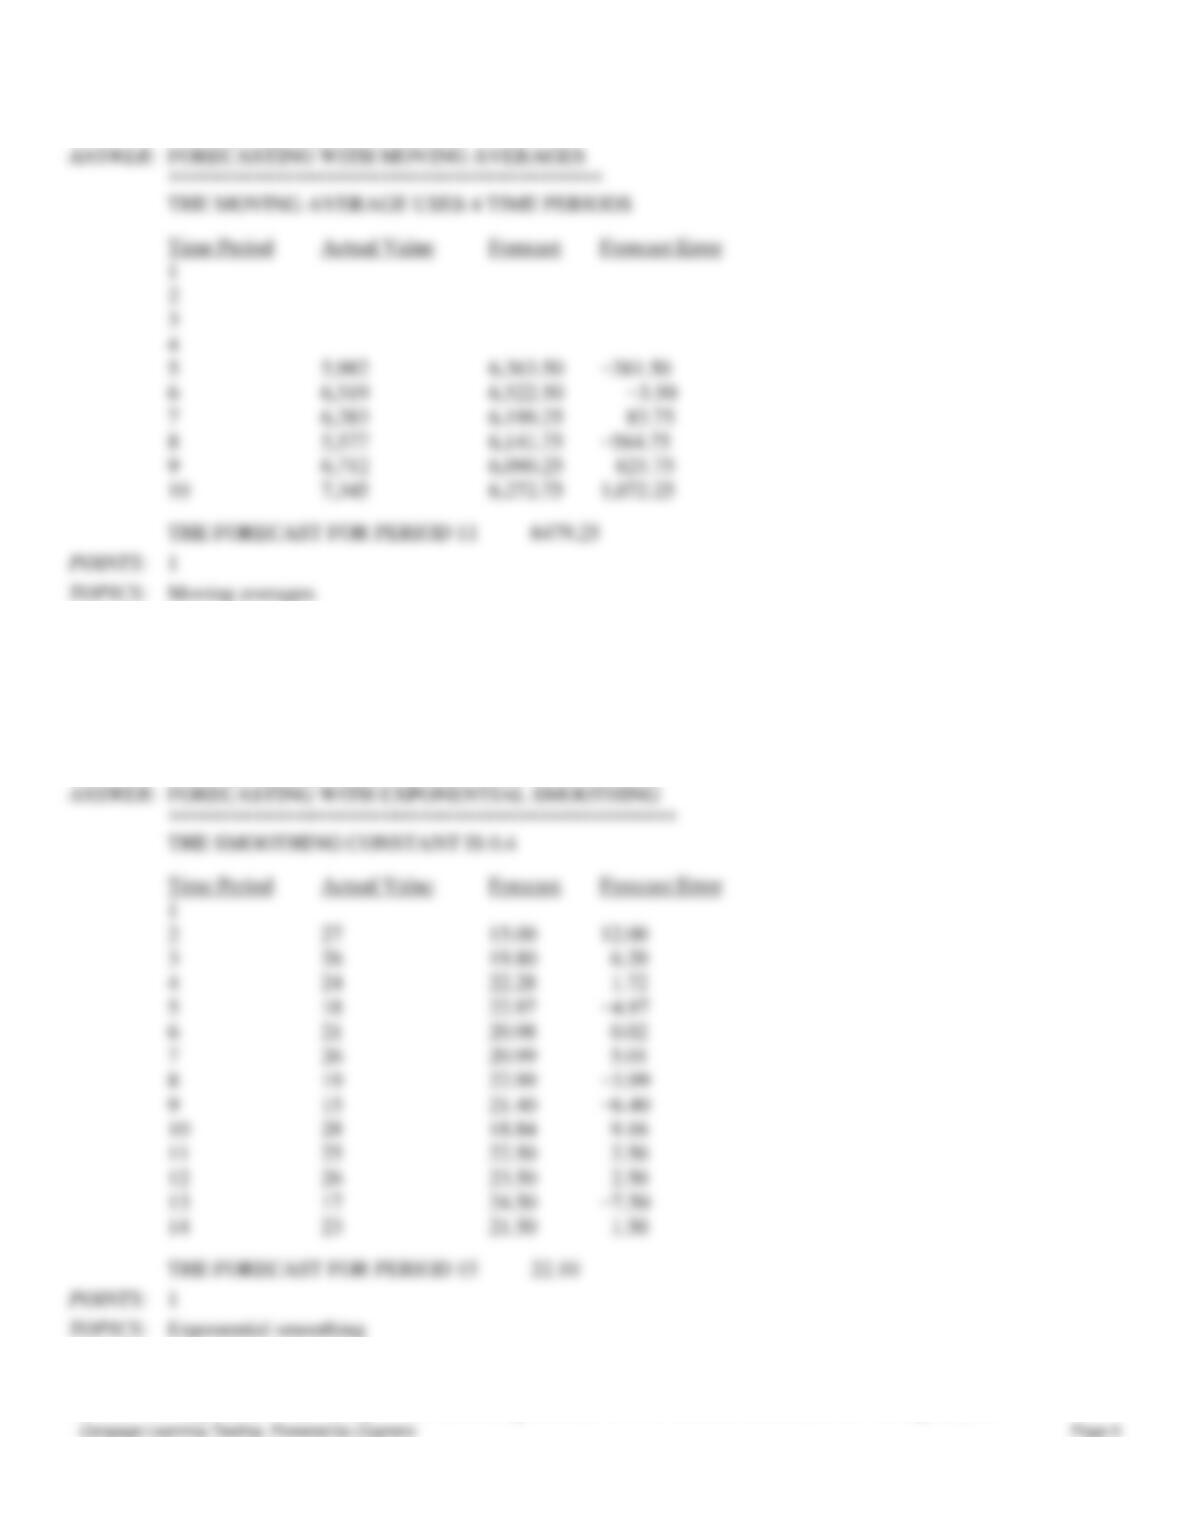
42. Use a four-period moving average to forecast attendance at baseball games. Historical records show
TOPICS:
Time series patterns: horizontal pattern
Chapter 15 – Time Series Analysis and Forecasting
5346, 7812, 6513, 5783, 5982, 6519, 6283, 5577, 6712, 7345
Time Period
Actual Value
Forecast Error
THE FORECAST FOR PERIOD 11 6479.25
Moving averages
43. A hospital records the number of floral deliveries its patients receive each day. For a two-week period, the records
show
15, 27, 26, 24, 18, 21, 26, 19, 15, 28, 25, 26, 17, 23
Use exponential smoothing with a smoothing constant of .4 to forecast the number of deliveries.
Time Period
Actual Value
Forecast Error
THE FORECAST FOR PERIOD 15 22.10
Exponential smoothing
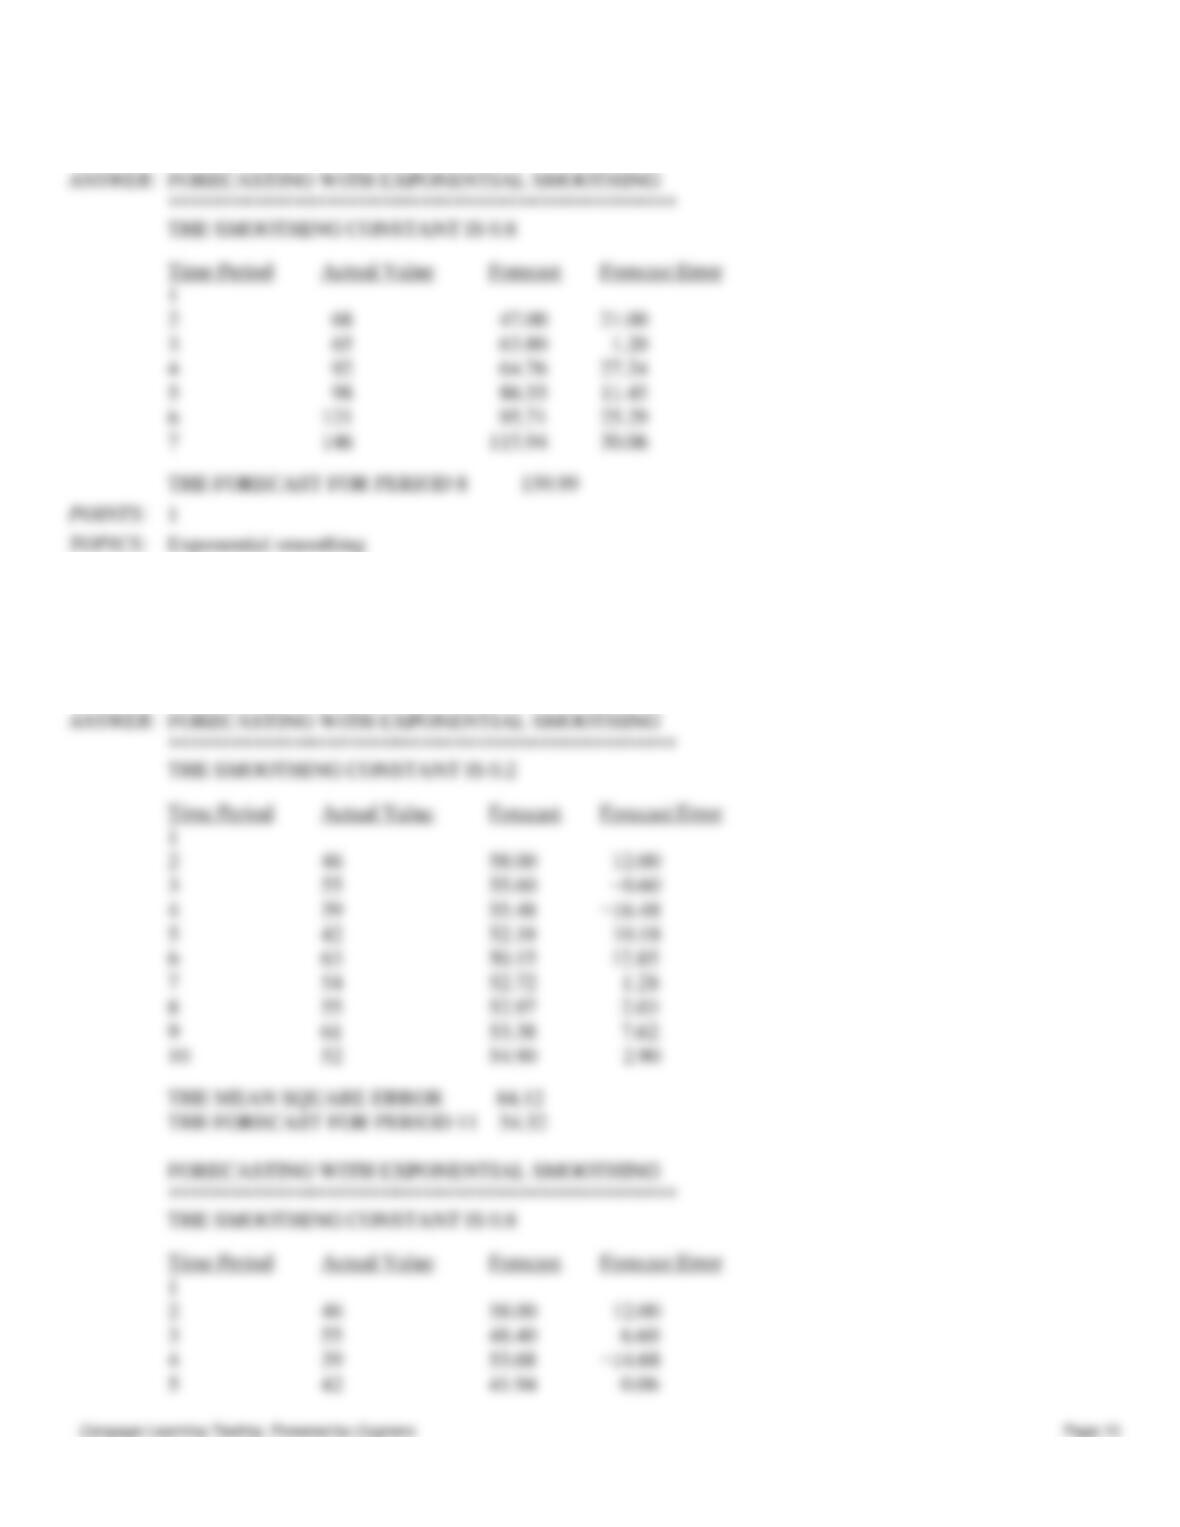
44. The number of girls who attend a summer basketball camp has been recorded for the seven years the camp has been
offered. Use exponential smoothing with a smoothing constant of .8 to forecast attendance for the eighth year.
Chapter 15 – Time Series Analysis and Forecasting
47, 68, 65, 92, 98, 121, 146
45. The number of pizzas ordered on Friday evenings between 5:30 and 6:30 at a pizza delivery location for the last 10
weeks is shown below. Use exponential smoothing with smoothing constants of .2 and .8 to forecast a value for week 11.
Compare your forecasts using MSE. Which smoothing constant would you prefer?
58, 46, 55, 39, 42, 63, 54, 55, 61, 52
Chapter 15 – Time Series Analysis and Forecasting
46. A trend line for the weekly attendance at a restaurant’s Sunday brunch is given by
How many guests would you expect in week 20?
47. The number of new contributors to a public radio station’s annual fund drive over the last ten years is
63, 58, 61, 72, 98, 103, 121, 147, 163, 198
Develop a trend equation for this information, and use it to predict next year’s number of new contributors.
Chapter 15 – Time Series Analysis and Forecasting
48. The average SAT verbal score for students from one high school over the last ten exams is
508, 490, 502, 505, 493, 506, 492, 490, 503, 501
Do the scores support an increasing or a decreasing trend?
49. The number of properties newly listed with a real estate agency in each quarter over the last four years is given below.
Assume the time series has seasonality without trend.
Year
Quarter
1
2
3
4
1
73
81
76
77
2
89
87
91
88
3
123
115
108
120
4
92
95
87
97
a. Develop the optimization model that finds the estimated regression equation that minimize the sum of squared error.
b. Solve for the estimated regression equation.
c. Forecast the four quarters of Year 5.
Chapter 15 – Time Series Analysis and Forecasting
50. Quarterly billing for water usage is shown below.
Year
Quarter
1
2
3
4
Winter
64
66
68
73
Spring
103
103
104
120
Summer
152
160
162
176
Fall
73
72
78
88
a.
Solve for the forecast equation that minimizes the sum of squared error.
b.
Forecast the summer of year 5 and spring of year 6.
b.
Summer, Year 5 = 175.375; Spring, Year 6 = 125.525
1
Seasonality with trend
51. A customer comment phone line is staffed from 8:00 a.m. to 4:30 p.m. five days a week. Records are available that
show the number of calls received every day for the last five weeks.
Week
Day
Number
Week
Day
Number
1
M
28
4
M
27
T
12
T
13
W
16
W
16
TH
15
TH
18
F
23
F
24
2
M
25
5
M
26
T
10
T
11
W
14
W
18
TH
14
TH
17
F
26
F
25
3
M
32
T
15
W
15
TH
13
F
21
a.
Develop the optimization model that finds the estimated regression equation that minimize
the sum of squared error.
b.
Solve for the estimated regression equation.
c.
Forecast the five days of week 6.
Chapter 15 – Time Series Analysis and Forecasting
52. Monthly sales at a coffee shop have been analyzed. The seasonal index values are
Month
Index
Jan
1.38
Feb
1.42
Mar
1.35
Apr
1.03
May
.99
June
.62
July
.51
Aug
.58
Sept
.82
Oct
.82
Nov
.92
Dec
1.56
and the trend line is 74123 + 26.9(t). Assume there is no cyclical component and forecast sales for year 8 (months 97 –
108).
SI
Month
1.38
97
76994.2
106252.0
1.42
98
77023.8
109373.8
1.35
99
77053.4
104022.1
1.03
77083.0
79395.5
0.99
77112.6
76341.5
0.62
77142.2
47828.2
0.51
77171.8
39357.6
0.58
77201.4
44776.8
0.82
77231.0
63329.4
0.82
77260.6
63353.7
0.92
77290.2
71107.0
1.56
77319.8
120618.9
53. A 24-hour coffee/donut shop makes donuts every eight hours. The manager must forecast donut demand so that the
bakers have the fresh ingredients they need. Listed below is the actual number of glazed donuts (in dozens) sold in each of
the preceding 13 eight-hour shifts.
Date
Shift
Demand(dozens)
Chapter 15 – Time Series Analysis and Forecasting
June 3
Day
59
Evening
47
Night
40
June 4
Day
64
Evening
43
Night
39
June 5
Day
62
Evening
46
Night
42
June 6
Day
60
Evening
45
Night
40
June 7
Day
58
a. Develop the optimization model that finds the estimated regression equation that minimize the sum of squared error.
b. Solve for the estimated regression equation.
c. Forecast the demand for glazed donuts for the Day, Evening, and Night shifts of June 8.
Day = 60.60, Evening = 45.25, Night = 40.25
Seasonal pattern
54. The number of plumbing repair jobs performed by Auger’s Plumbing Service in each of the last nine months are listed
below.
Month
Jobs
Month
Jobs
Month
Jobs
March
353
June
374
September
399
April
387
July
396
October
412
May
342
August
409
November
408
a.
Assuming a linear trend function, forecast the number of repair jobs Auger’s will perform in
December using the least squares method.
b.
What is your forecast for December using a three-period weighted moving average with
weights of .6, .3, and .1? How does it compare with your forecast from part (a)?
Chapter 15 – Time Series Analysis and Forecasting
55. Quarterly revenues (in $1,000,000’s) for a national restaurant chain for a five-year period were as follows:
Quarter
Year 1
Year 2
Year 3
Year 4
Year 5
1
33
42
54
70
85
2
36
40
53
67
82
3
35
42
54
70
87
4
38
47
62
77
99
a.
Solve for the forecast equation that minimizes the sum of squared error.
b.
Forecast the four quarters of year 6.
b.
1
Seasonal with trend
56. Business at Terry’s Tie Shop can be viewed as falling into three distinct seasons: (1) Christmas (November-
December); (2) Father’s Day (late May – mid-June); and (3) all other times. Average weekly sales (in $’s) during each of
these three seasons during the past four years has been as follows:
Season
Year 1
Year 2
Year 3
Year 4
1
1856
1995
2241
2280
2
2012
2168
2306
2408
3
985
1072
1105
1120
Determine a forecast for the average weekly sales in years 5 and 6 for each of the three seasons.
Forecasts Year 6: Seas.1 = 2475.9, Seas.2 = 2606.4, Seas.3 = 1453.4
1
Seasonality with trend
57. Sales (in thousands) of the new Thorton Model 506 convection oven over the eight-week period since its introduction
have been as follows:
Week
Sales
1
18.6
2
21.4
3
25.2
4
22.4
5
24.6
6
19.2
7
21.7
8
23.8
a.
Which exponential smoothing model provides better forecasts, one using α = .6 or α = .2?
Compare them using mean squared error.
b.
Using the two forecast models in part (a), what are the forecasts for week 9?
1
Trend component
Chapter 15 – Time Series Analysis and Forecasting
58.
Coyote Cable has been experiencing an increase in cable service subscribers over the last few years due to increased
advertising and an influx of new residents to the region. The numbers of subscribers (in 1000’s) for the last 16 months are
as follows:
Month
Sales
Month
Sales
Month
Sales
1
12.8
7
20.6
12
23.8
2
14.6
8
18.5
13
25.1
3
15.2
9
19.9
14
24.7
4
16.1
10
23.6
15
26.5
5
15.8
11
24.2
16
28.9
6
17.2
Forecast the number of subscribers for months 17, 18, 19, and 20.
59.
Weekly sales of the Weber food processor for the past ten weeks have been:
Week
Sales
Week
Sales
1
980
6
990
2
1040
7
1030
3
1120
8
1260
4
1050
9
1240
5
960
10
1100
a. Determine, on the basis of minimizing the mean square error, whether a three-period or four-period simple moving
average model gives a better forecast for this problem.
b. For each model, forecast sales for week 11.
60.
Below you are given information on John’s Hair Salon profit for the past 7 years.
Year
Profit (In Thousands)
Chapter 15 – Time Series Analysis and Forecasting
1
15.0
2
16.2
3
17.1
4
18.1
5
18.8
6
19.2
7
20.5
a. Use regression analysis to obtain an expression for the linear trend projection.
b. Forecast John’s Hair Salon profit for the next 5 years.
Essay
61. Explain what conditions make quantitative forecasting methods appropriate.
Introduction
62. What is a stable time series, and what forecasting methods are appropriate for one?
63. How can error measures be used to determine the number of periods to use in a moving average? What are you
assuming about the future when you make this choice?
64. Discuss the effects of using a small smoothing constant value and when it is most appropriate to use. Then, do the
same for a large smoothing constant value.
65. Explain and contrast three measures of forecast accuracy.
66. Describe a time series plot and discuss its purpose and when in the forecasting process it should be constructed.

Chapter 15 – Time Series Analysis and Forecasting