Chapter 13 – Decision Analysis
TOPICS:
Sensitivity analysis
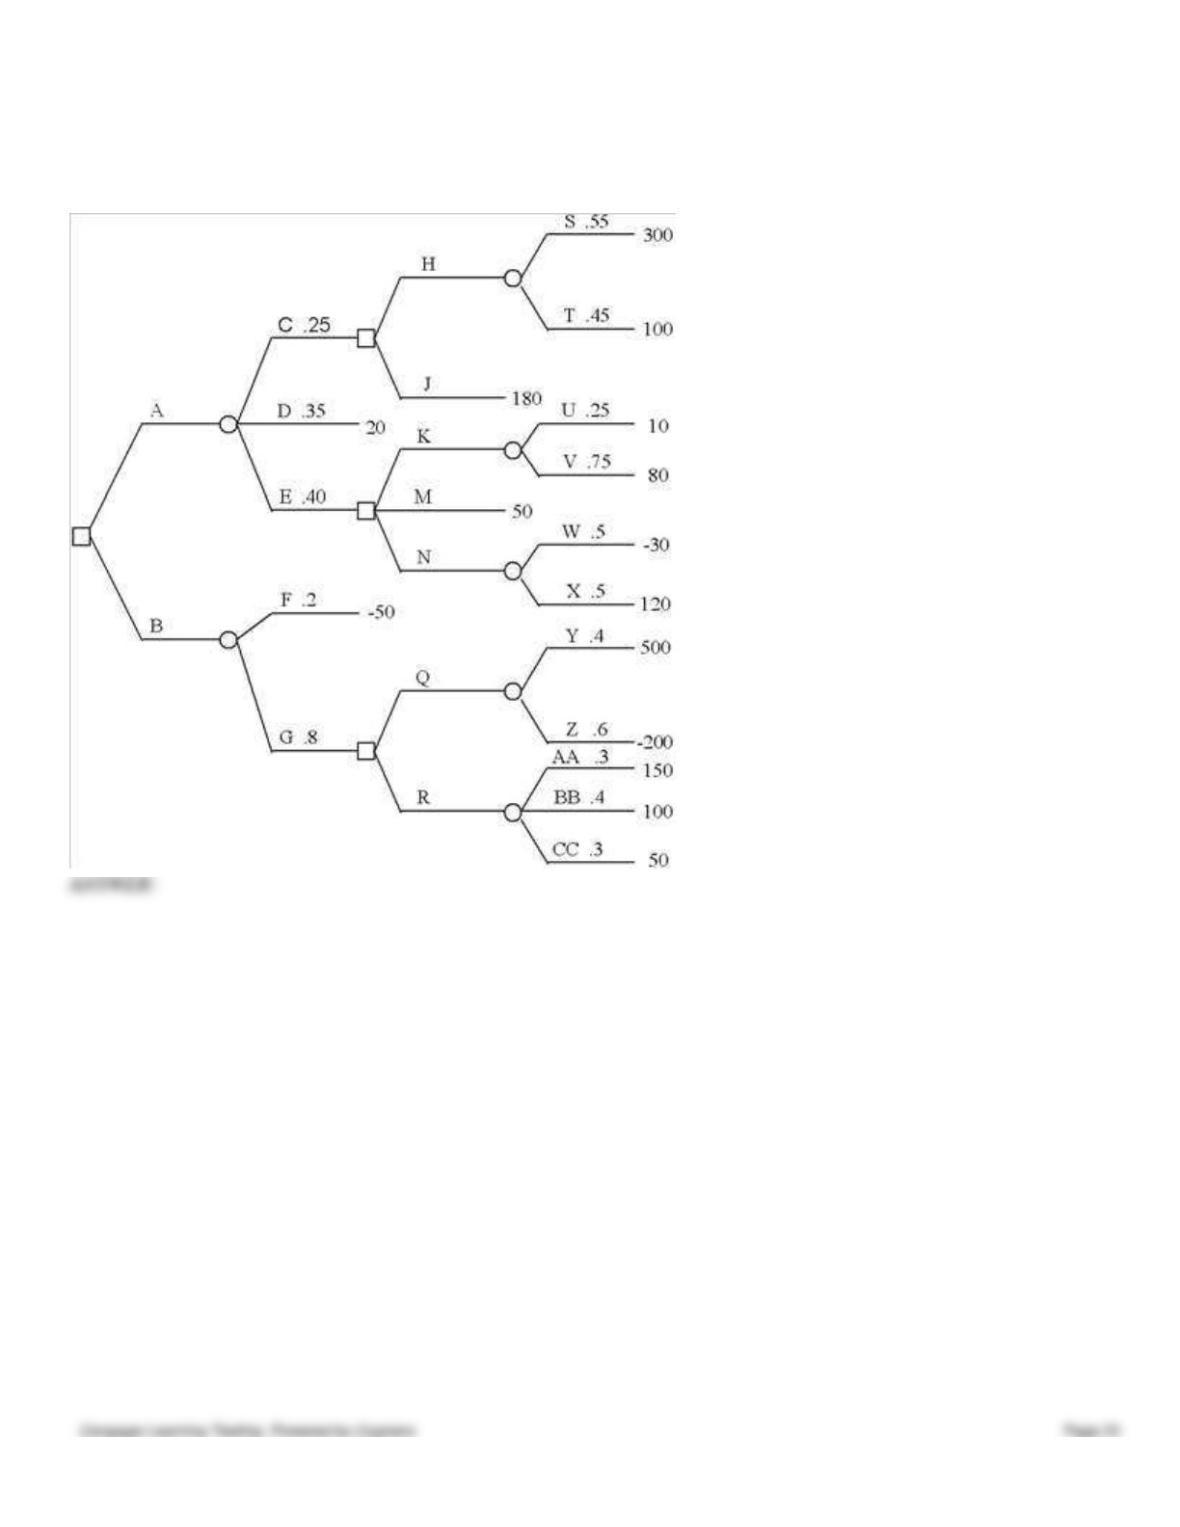
80. Fold back the decision tree and state what strategy should be followed.
ANSWER:
Chapter 13 – Decision Analysis
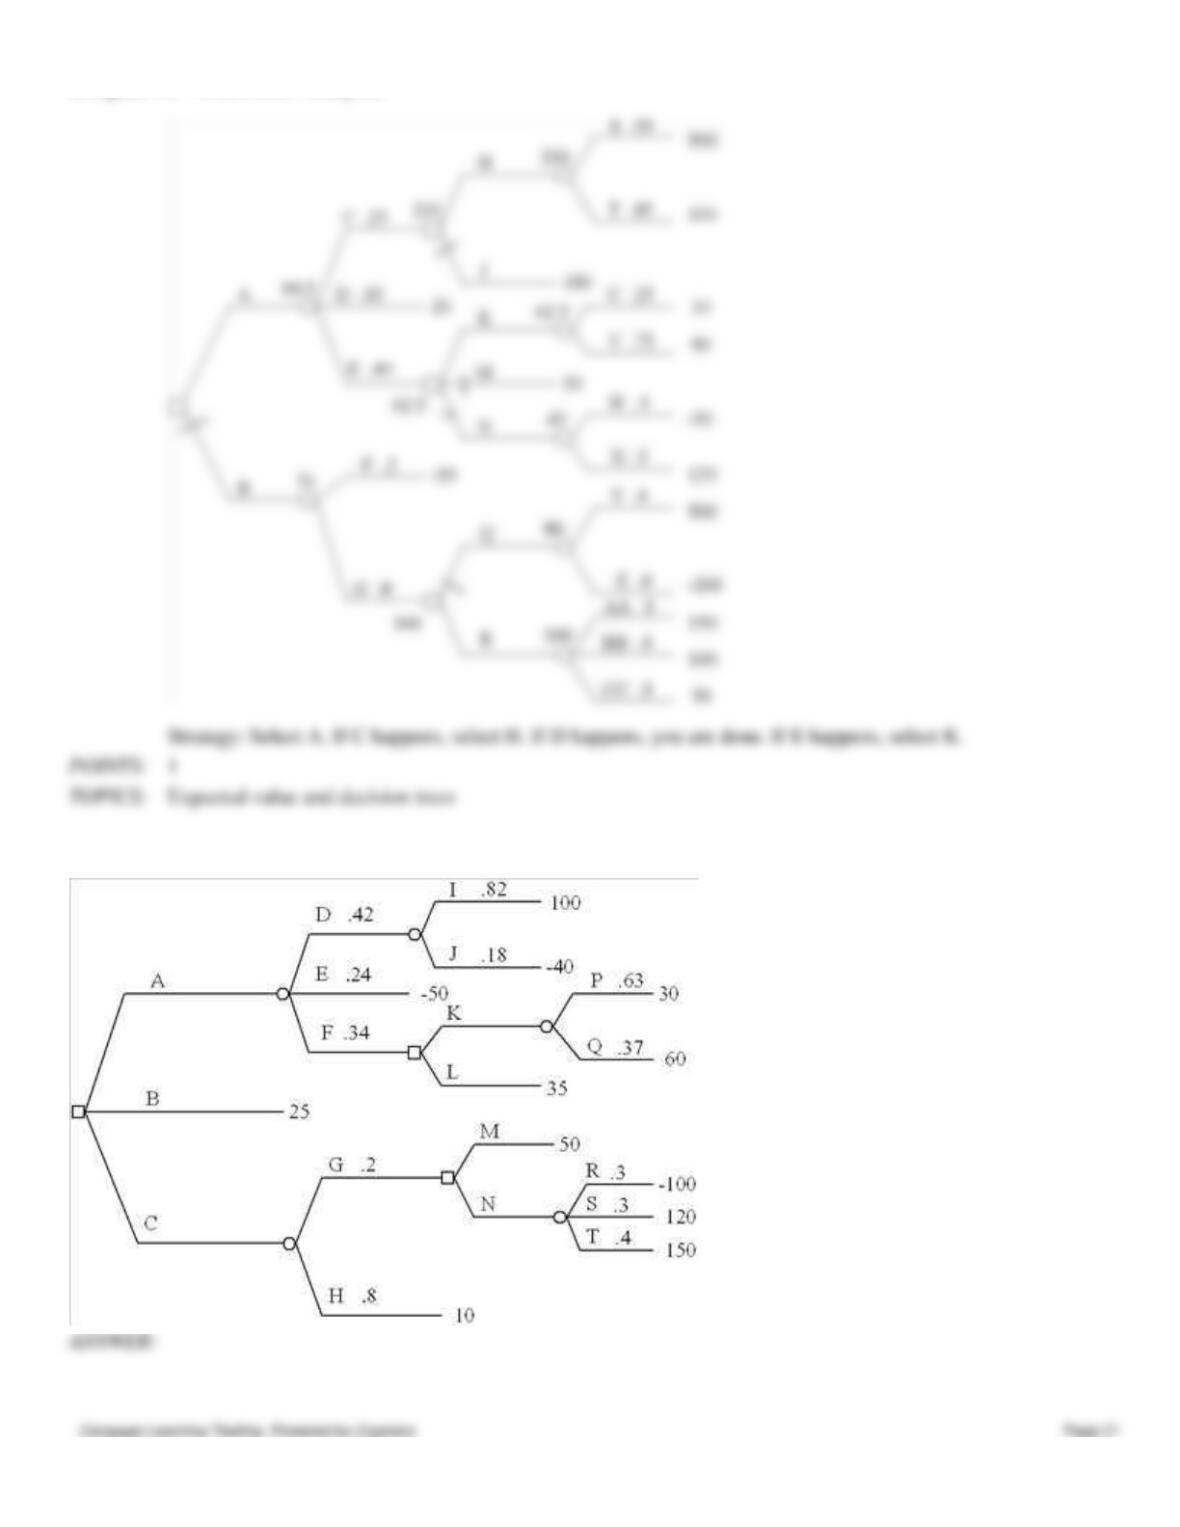
81. Fold back this decision tree. Clearly state the decision strategy you determine.
Chapter 13 – Decision Analysis
82. If sample information is obtained, the result of the sample information will be either positive or negative. No matter
which result occurs, the choice to select option A or option B exists. And no matter which option is chosen, the eventual
outcome will be good or poor. Complete the table.
Sample
Result
States of
Nature
Prior
Probabilities
Conditional
Probabilities
Joint
Probabilities
Posterior
Probabilities
Positive
good
.7
P(positive | good) = .8
poor
.3
P(positive | poor) = .1
Negative
good
.7
P(negative | good) =
poor
.3
P(negative | poor) =
Result
Nature
Probabilities
Probabilities
Probabilities
Probabilities
Positive
good
.7
P(positive | good) = .8
.56
.9492
poor
.3
P(positive | poor) = .1
.03
.0508
Negative
good
.7
P(negative | good) = .2
.14
.3415
poor
.3
P(negative | poor) = .9
.27
.6585
Posterior probabilities
83. Use graphical sensitivity analysis to determine the range of values of the probability of state of nature s1 over which
each of the decision alternatives has its largest expected value.
State of Nature
Decision
s1
s2
d1
8
10
d2
4
16
d3
10
0
Expected value and decision trees
Chapter 13 – Decision Analysis
84. Dollar Department Stores has received an offer from Harris Diamonds to purchase Dollar’s store on Grove Street for
$120,000. Dollar has determined probability estimates of the store’s future profitability, based on economic outcomes, as:
P($80,000) = .2, P($100,000) = .3, P($120,000) = .1, and P($140,000) = .4.
a.
Should Dollar sell the store on Grove Street?
b.
What is the EVPI?
c.
Dollar can have an economic forecast performed, costing $10,000, that produces indicators
I1 and I2, for which P(I1 | 80,000) = .1; P(I1 | 100,000) = .2; P(I1 | 120,000) = .6; P(I1 |
140,000) = .3. Should Dollar purchase the forecast?
a.
b.
EVPI = $8,000
c.
No; survey cost exceeds EVPI.
Posterior probabilities
85. Characterize each of the non-probabilistic approaches to decision making (i.e. – minimin, minimax, maximin, and
maximax) in terms of it relating to a minimization or maximization problem and whether it is a pessimistic or optimistic
approach.
Answer not provided.
Decision making without probabilities
86.
A paint company has three sources for buying bright red pigment for their paints: Vietnam, Taiwan, or Thailand.
Unfortunately, the pigment is made from a bush whose annual growth is heavily dependent upon the amount of rainfall
during the growing season. The tables below show probabilities and prices for wet, dry and normal growing seasons:
Probabilities
Wet Dry Normal
Vietnam .5 .2 .3
Taiwan .6 .3 .1
Thailand .4 .4 .2
Price/Pound ($)
Wet Dry Normal
Vietnam .95 1.10 1.00
Graphical sensitivity analysis
Chapter 13 – Decision Analysis
Taiwan .85 1.20 .98
Thailand .90 1.15 1.05
What country should the company select and what is the expected value (price) associated with it?
87.
A regional fast‑food restaurant is considering an expansion program. The major factor influencing the success of such a
program is the future level of interest rates. It is estimated that there is a 20 percent chance that interest rates will increase
by 2 percentage points, a 50 percent chance that they will remain the same, and a 30 percent chance that they will decrease
by 2 percentage points. The alternatives they are considering and possible payoffs are shown in the table below. Which
alternative is best, based on expected value?
Rates up Rates Rates down
2 percent unchanged 2 percent
Build 50 restaurants ‑$200,000 $50,000 $150,000
Build 25 restaurants ‑$115,000 $26,000 $80,000
Do nothing ‑$70,000 0 $5,000
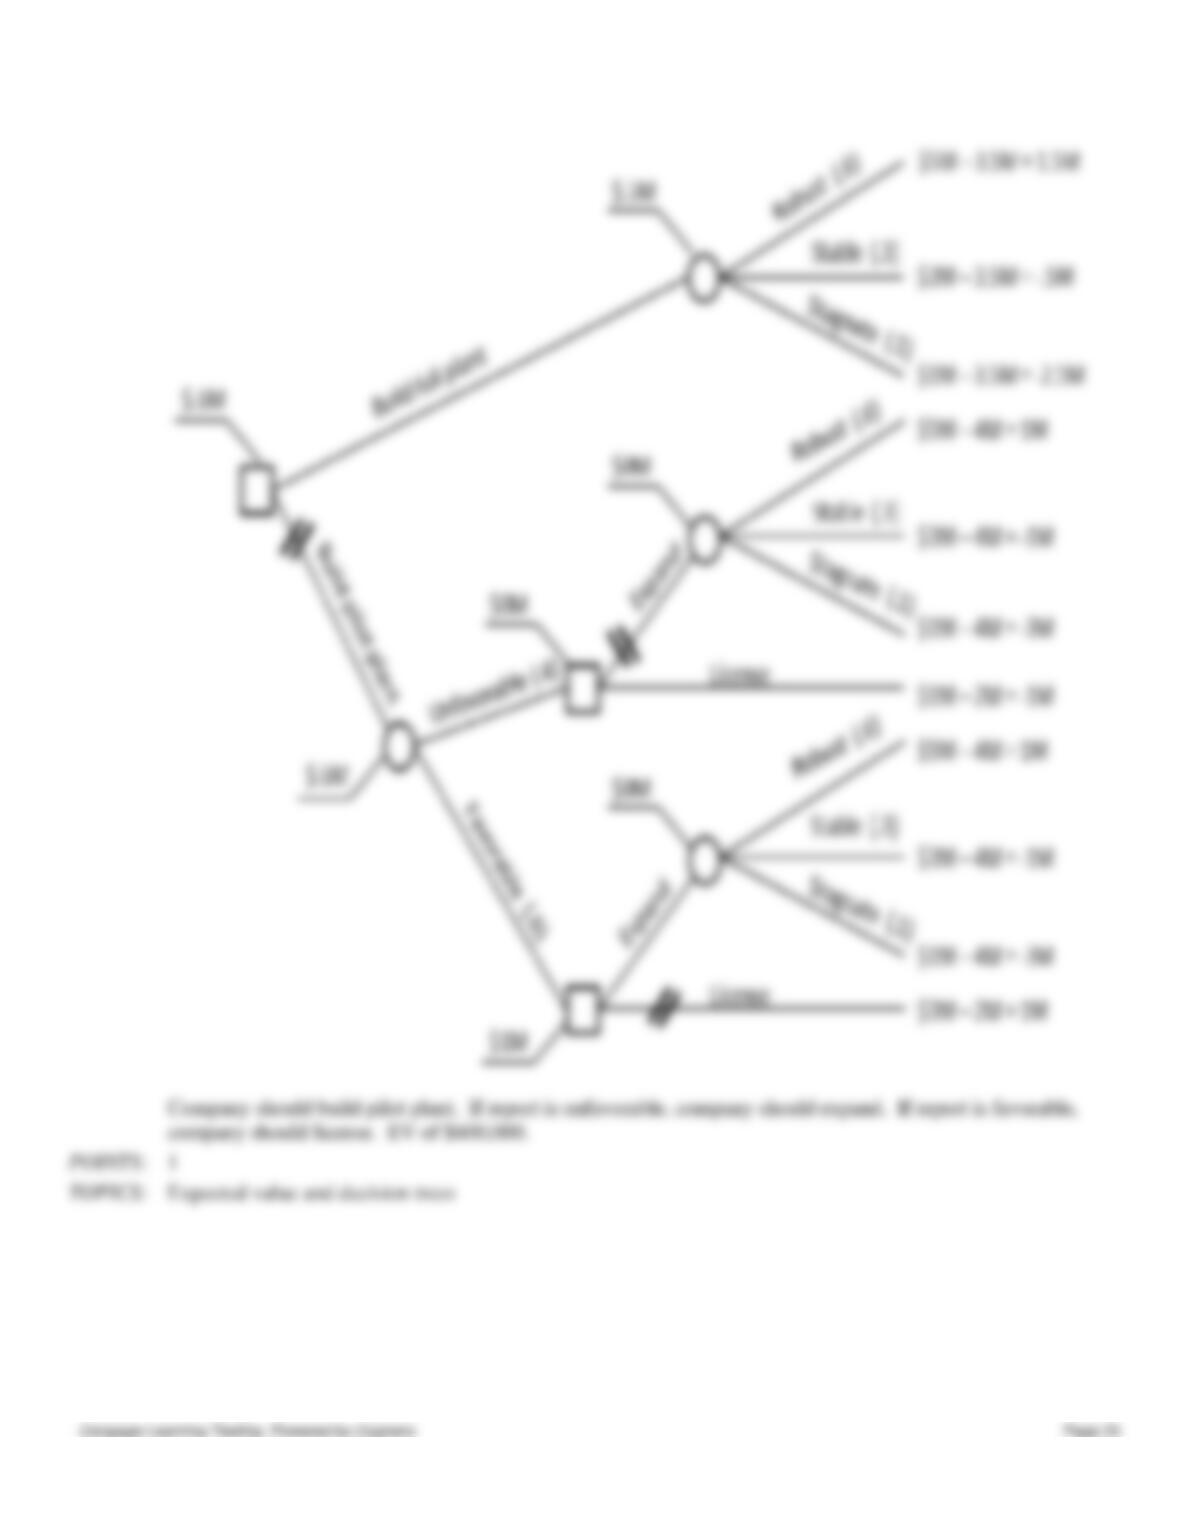
88. A chemical company is trying to decide whether to build a pilot plant now for a new chemical process or to build the
full plant now. If they build a pilot plant now, they could expand it later to a full plant or license the plant to another
company. It would cost them $2 million to build the pilot plant and another $2 million later to expand it. If they build the
full plant now it would cost $3.5 million to construct.
The returns they expect to get from the full production plant depend upon the market. They estimate there is a 60% chance
the market will be robust, a 30% chance it will remain stable, and a 10% chance it will become stagnate. The returns are
estimated to be $5 million if it is robust, $3 million if it is stable, and $1 million if it is stagnate.
Before they expand the pilot plant, they plan to conduct a comprehensive study. Based on past experience, they expect the
study to report a 60% chance of favorable outcome for expansion and a 40% unfavorable chance. In either case they will
have to decide whether to expand to a full plant or license the pilot plant. If the report is favorable and they license it, they
expect to get $3 million. However, if the report is unfavorable and they license it, they will only get $1 million.
Develop a decision tree for this problem and determine the optimal decision strategy.
Chapter 13 – Decision Analysis
89.
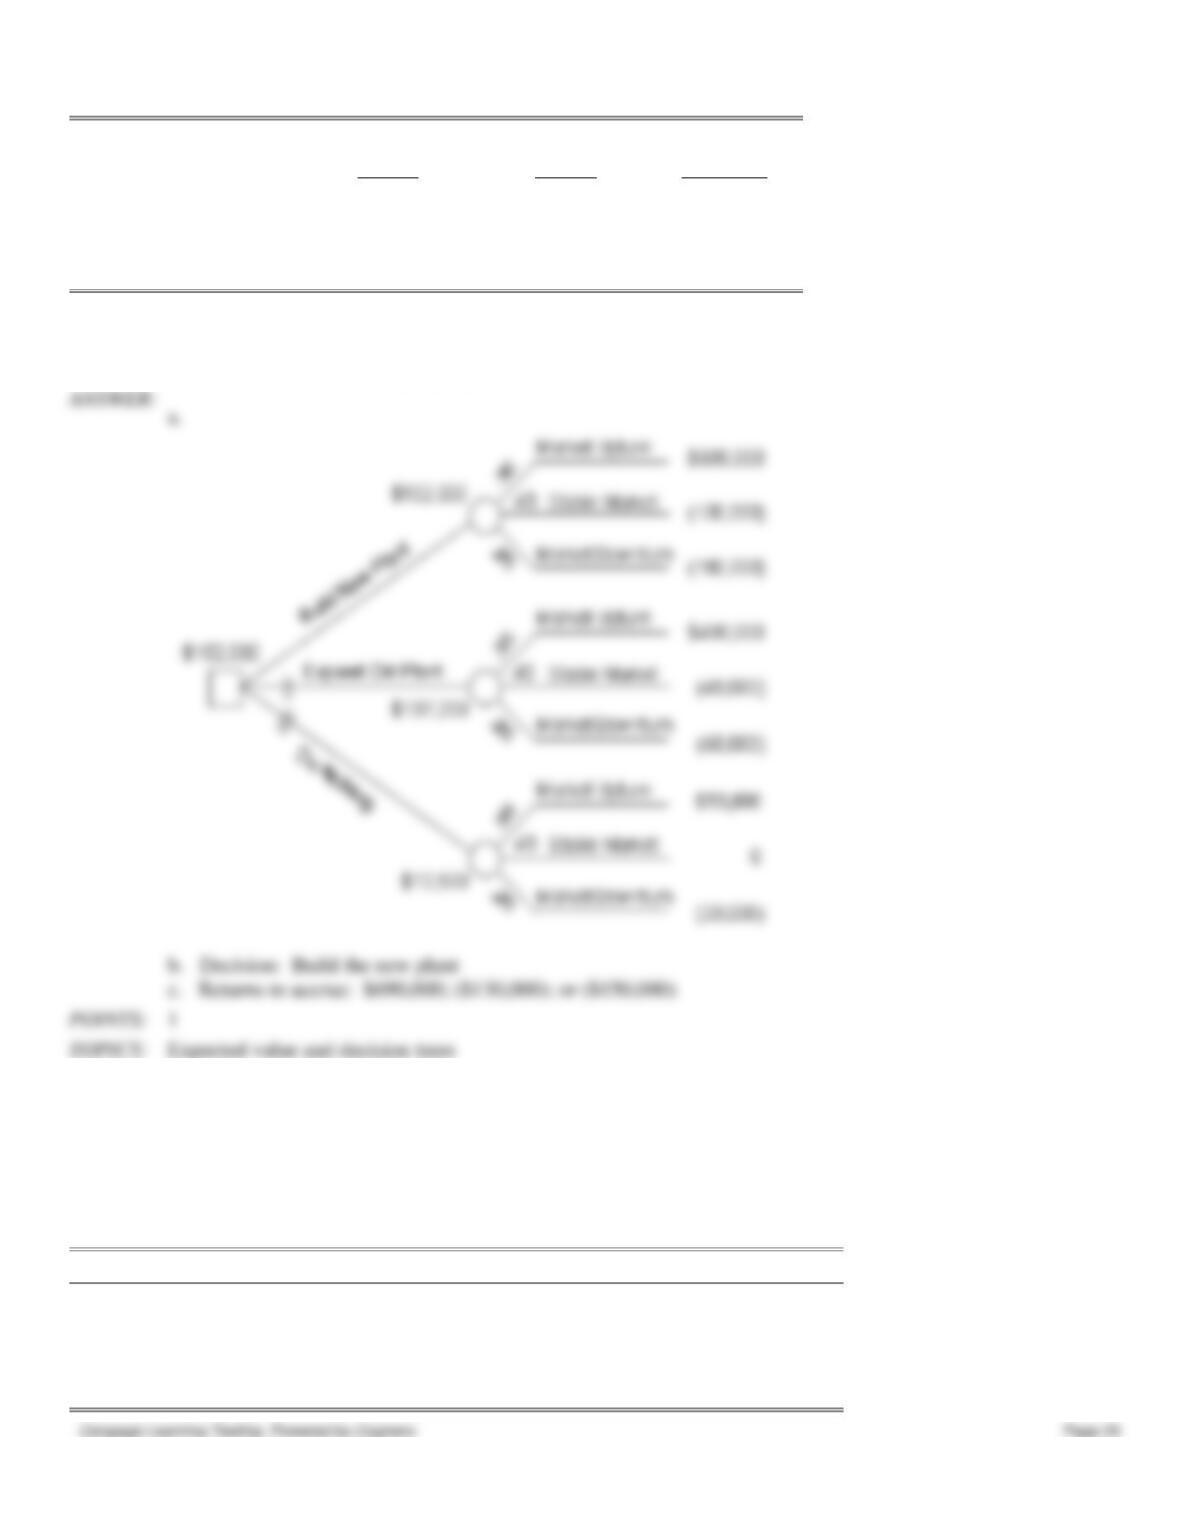
A manufacturing company is considering expanding its production capacity to meet a growing demand for its product line
of air fresheners. The alternatives are to build a new plant, expand the old plant, or do nothing. The marketing
department estimates a 35 percent probability of a market upturn, a 40 percent probability of a stable market, and a 25
percent probability of a market downturn. Georgia Swain, the firm’s capital appropriations analyst, estimates the
following annual returns for these alternatives:
Chapter 13 – Decision Analysis
Market
Upturn
Stable
Market
Market
Downturn
Build new plant
$690,000
$(130,000)
$(150,000)
Expand old plant
490,000
(45,000)
(65,000)
Do nothing
50,000
0
(20,000)
a. Use a decision tree analysis to analyze these decision alternatives.
b. What should the company do?
c. What returns will accrue to the company if your recommendation is followed?
90.
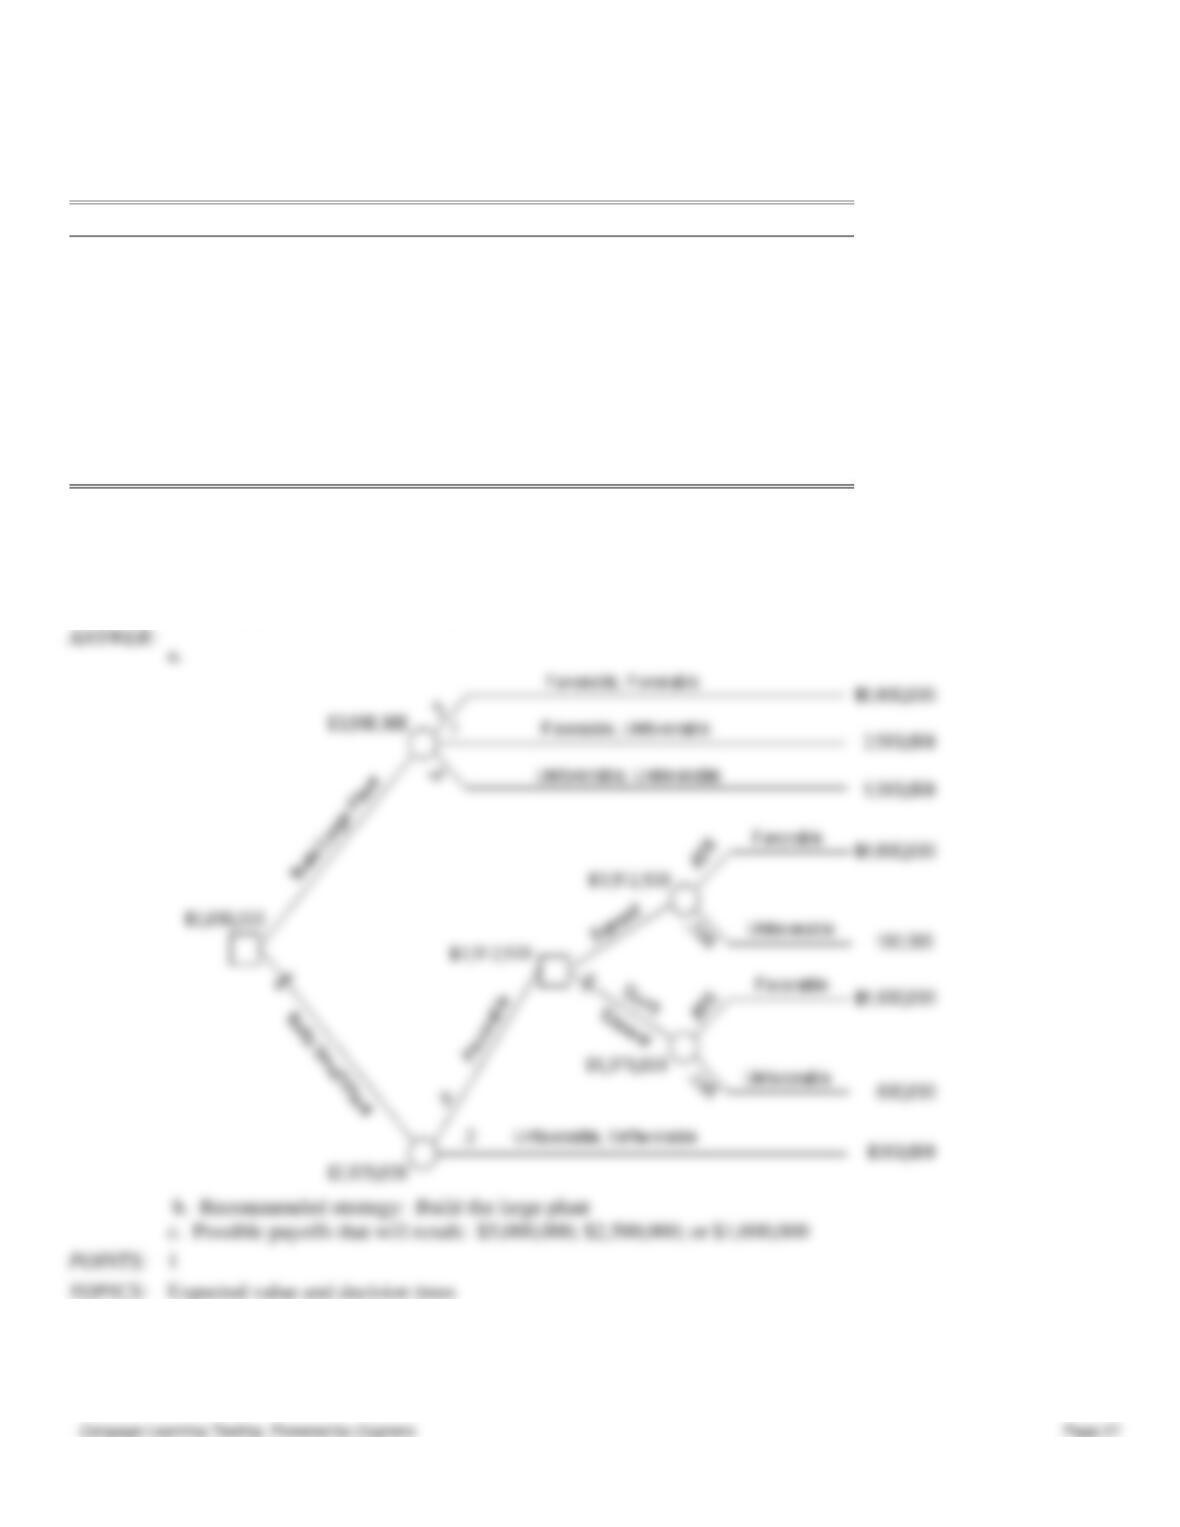
The Sunshine Manufacturing Company has developed a unique new product and must now decide between two facility
plans. The first alternative is to build a large new facility immediately. The second alternative is to build a small plant
initially and to consider expanding it to a larger facility three years later if the market has proven favorable.
Marketing has provided the following probability estimates for a ten-year plan:
First 3-Year Demand
Next 7-Year Demand
Probability
Unfavorable
Unfavorable
.2
Unfavorable
Favorable
.0
Favorable
Favorable
.7
Favorable
Unfavorable
.1
Chapter 13 – Decision Analysis
If the small plant is expanded, the probability of demands over the remaining seven years is 7/8 for favorable and 1/8 for
unfavorable. The accounting department has provided the payoff for each outcome:
Demand
Facility Plan
Payoff
Favorable, favorable
1
$5,000,000
Favorable, unfavorable
1
2,500,000
Unfavorable, unfavorable
1
1,000,000
Favorable, favorable
2—expanded
4,000,000
Favorable, unfavorable
2—expanded
100,000
Favorable, favorable
2—not expanded
1,500,000
Favorable, unfavorable
2—not expanded
500,000
Unfavorable, unfavorable
2—not expanded
300,000
With these estimates, analyze Sunshine’s facility decision and:
a. Perform a complete decision tree analysis.
b. Recommend a strategy to Sunshine.
c. Determine what payoffs will result from your recommendation.
Expected value and decision trees
91.
A Pacific Northwest lumber company is considering the expansion of one of its mills. The question is whether to do it
now, or wait for one year and re-consider. If they expand now, the major factors of importance are the state of the
Chapter 13 – Decision Analysis
economy and the level of interest rates. The combination of these two factors results in five possible situations. If they do
not expand now, only the state of the economy is important and three conditions characterize the possibilities. The
following table summarizes the situation:
Probabilities
Revenues
Expand
very favorable
.2
$80,000
favorable
.2
$60,000
neutral
.1
$20,000
unfavorable
.3
-$20,000
very unfavorable
.2
-$30,000
Don’t expand
expansion
.2
$50,000
steady
.5
$30,000
contraction
.3
$10,000
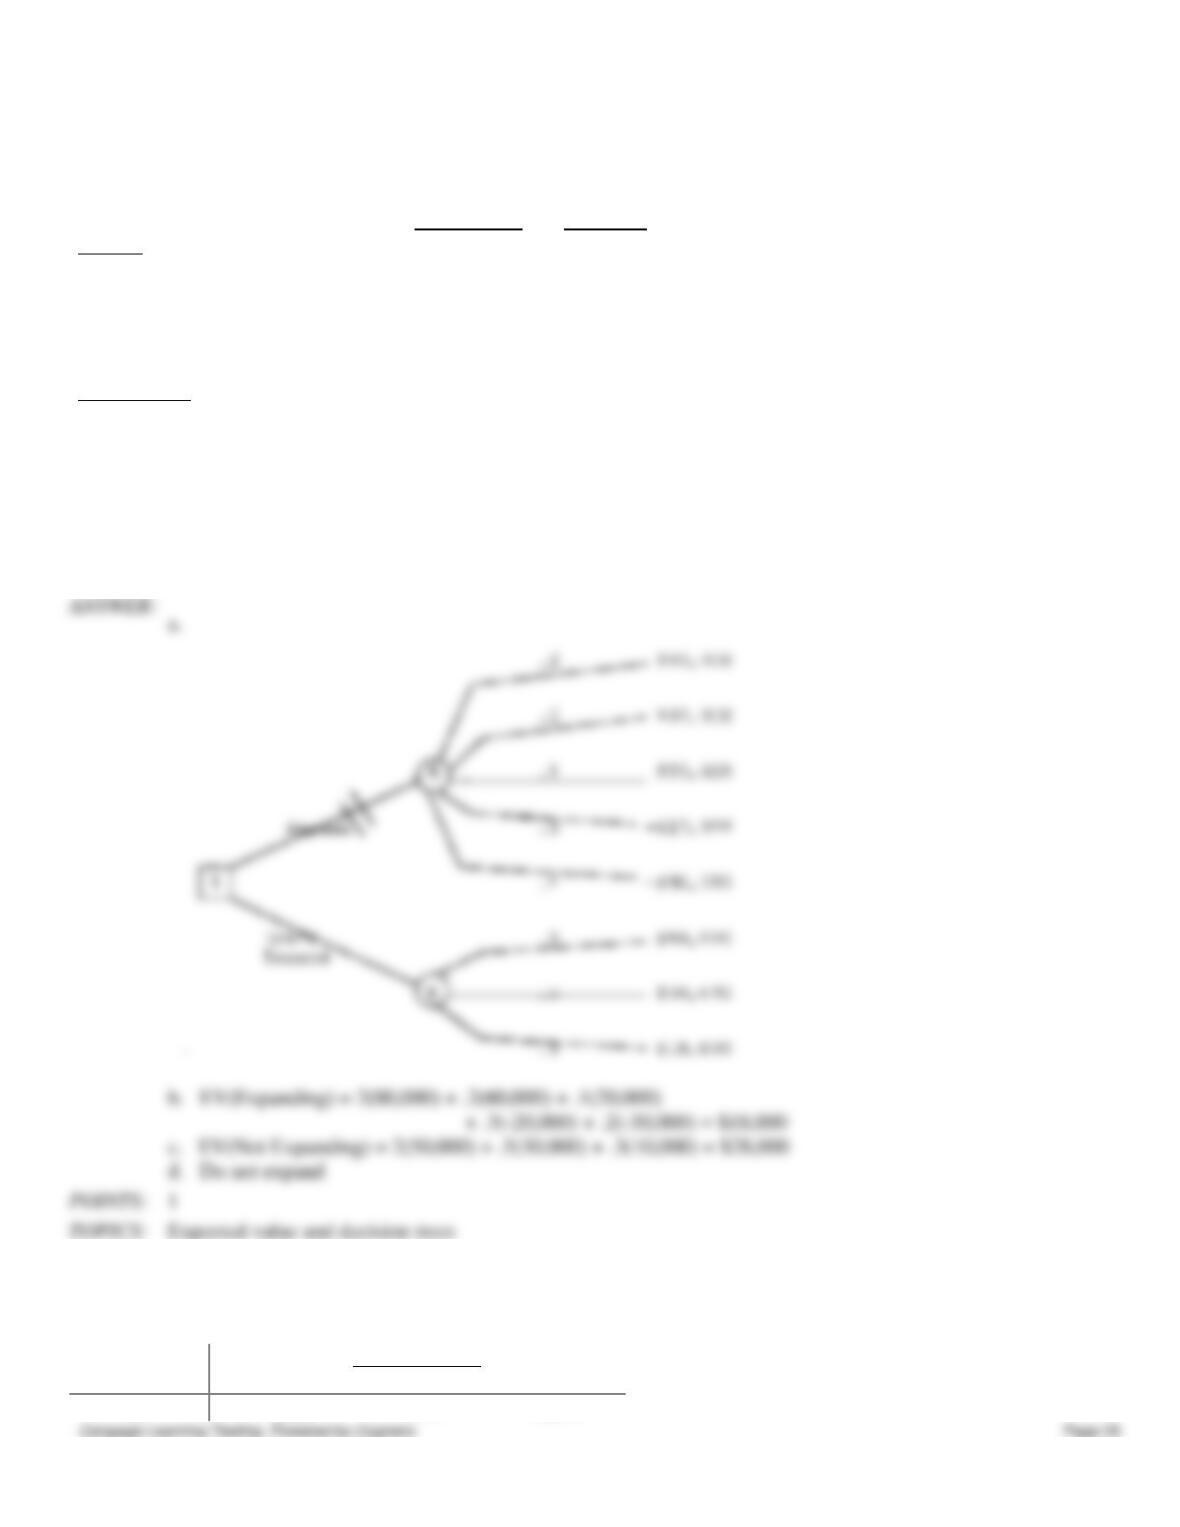
a. Draw the decision tree for this problem.
b. What is the expected value for expanding?
c. What is the expected value for not expanding?
d. Based on expected value, what should the company’s decision(s) be?
92.
For the payoff table below, the decision maker will use P(s1) = .15, P(s2) = .5, and P(s3) = .35.
State of Nature
Decision
s1
s2
s3
d1
−5000
1000
10,000
Chapter 13 – Decision Analysis
d2
−15,000
−2000
40,000
a.
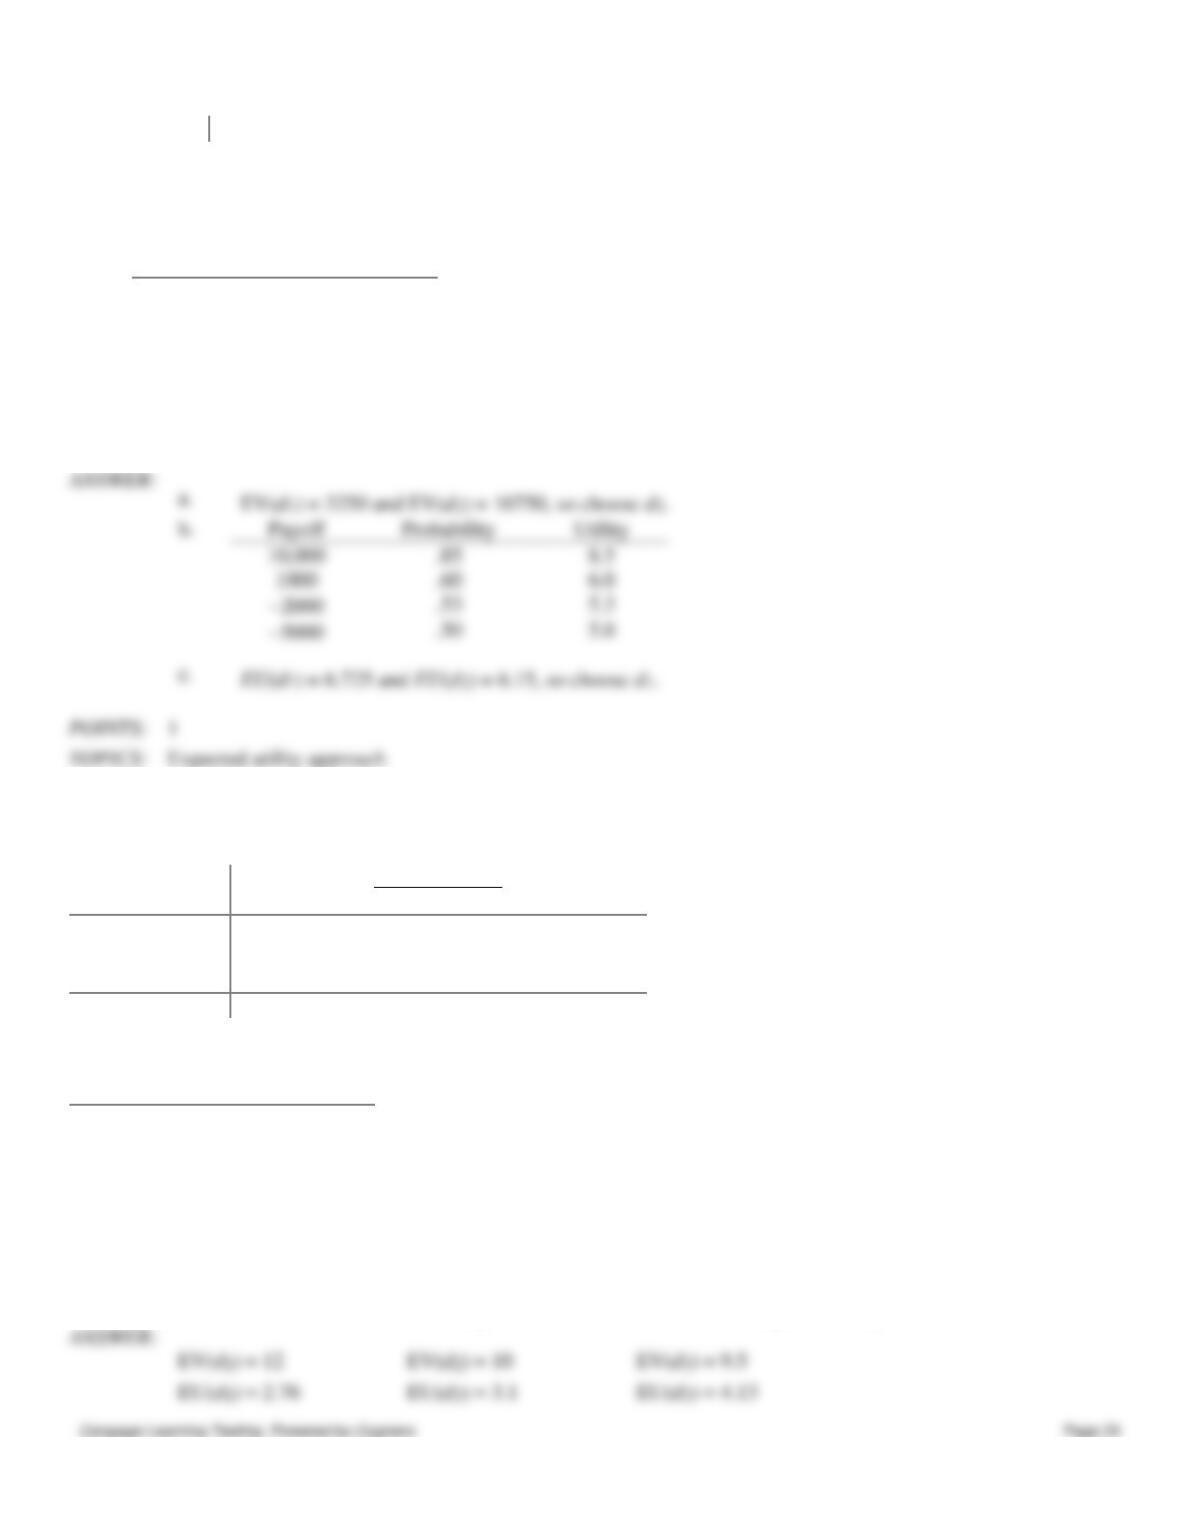
What alternative would be chosen according to expected value?
b.
For a lottery having a payoff of 40,000 with probability p and −15,000 with probability (1 − p),
the decision maker expressed the following indifference probabilities.
Payoff
Probability
10,000
.85
1000
.60
−2000
.53
−5000
.50
Let U(40,000) = 10 and U(−15,000) = 0 and find the utility value for each payoff.
c.
What alternative would be chosen according to expected utility?
Payoff
Probability
Utility
10,000
.85
1000
.60
−2000
.53
−5000
.50
93.
A decision maker who is considered to be a risk taker is faced with this set of probabilities and payoffs
State of Nature
Decision
s1
s2
s3
d1
5
10
20
d2
−25
0
50
d3
−50
−10
80
Probability
.30
.35
.35
For the lottery p(80) + (1 − p)(−50), this decision maker has assessed the following indifference probabilities
Payoff
Probability
50
.60
20
.35
10
.25
5
.22
0
.20
−10
.18
−25
.10
Rank the decision alternatives on the basis of expected value and on the basis of expected utility.
Chapter 13 – Decision Analysis
94. Three decision makers have assessed utilities for the problem whose payoff table appears below.
State of Nature
Decision
s1
s2
s3
d1
500
100
−400
d2
200
150
100
d3
−100
200
300
Probability
.2
.6
.2
Indifference Probability for Person
Payoff
A
B
C
300
.95
.68
.45
200
.94
.64
.32
150
.91
.62
.28
100
.89
.60
.22
−100
.75
.45
.10
a.
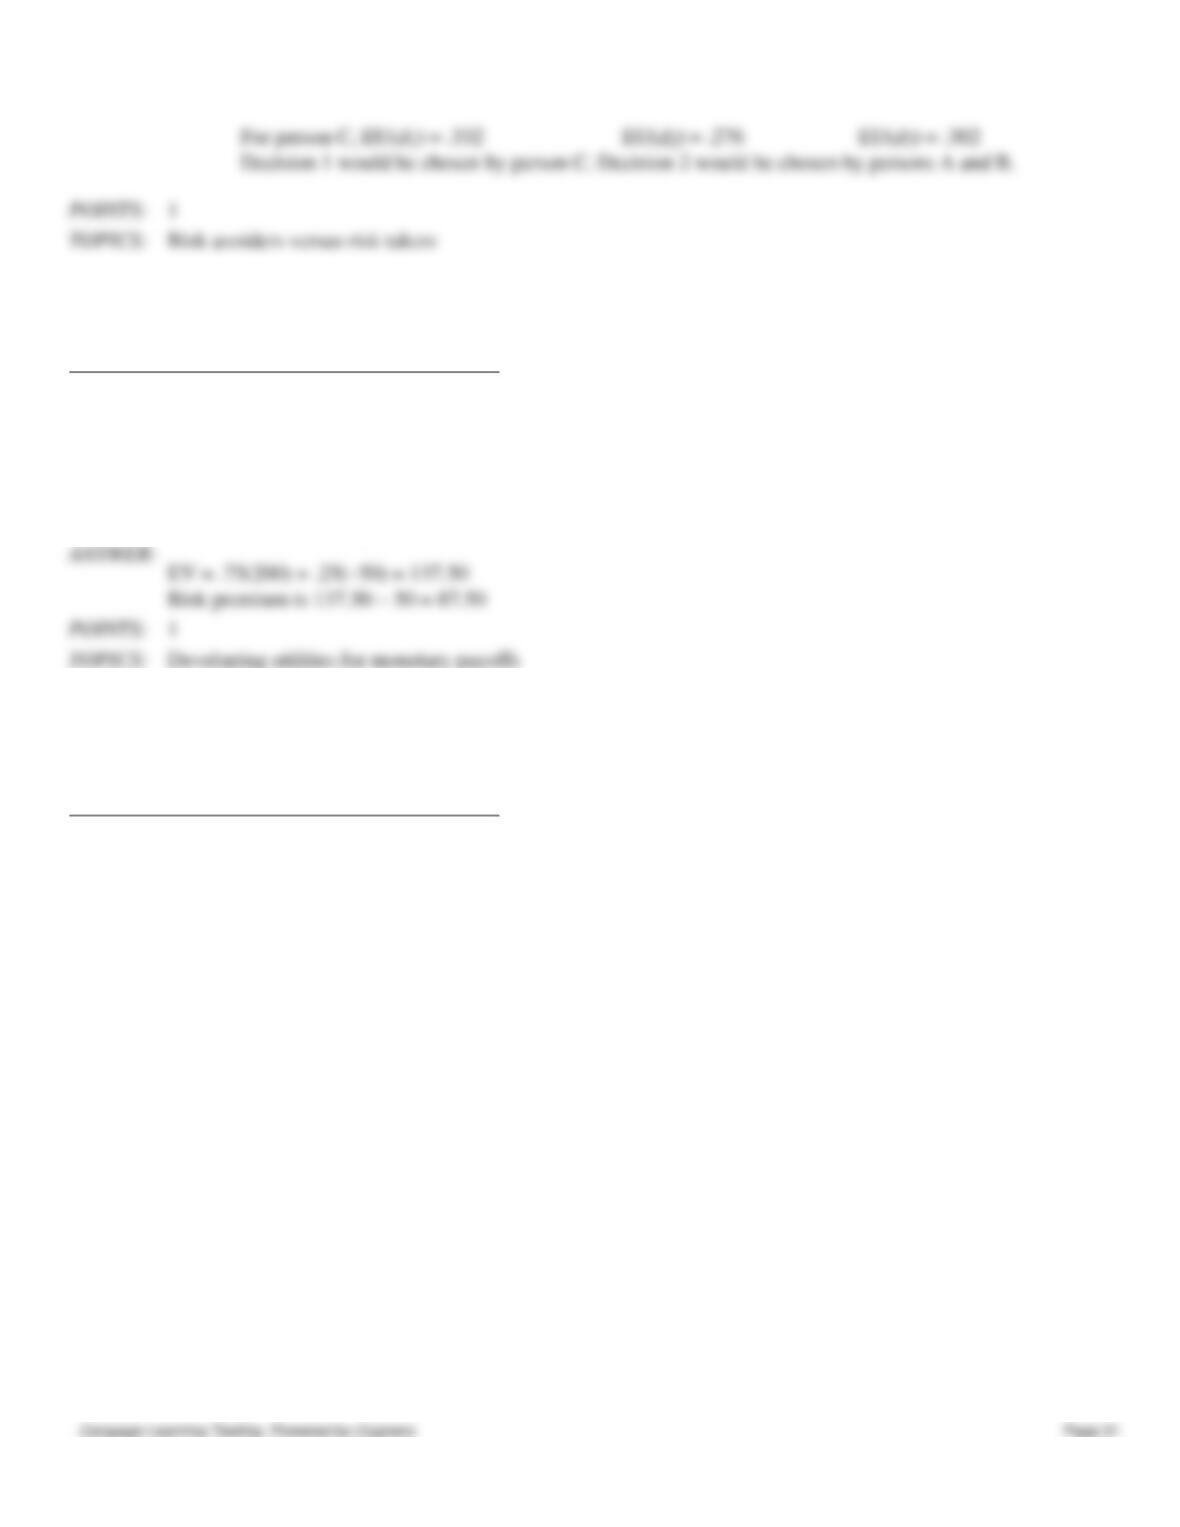
Plot the utility function for each decision maker.
b.
Characterize each decision maker’s attitude toward risk.
c.
Which decision will each person prefer?
a.
b.
Person A is a risk avoider, Person B is fairly risk neutral, and Person C is a risk avoider.
Chapter 13 – Decision Analysis
95.
A decision maker has the following utility function
Payoff
Indifference Probability
200
1.00
150
.95
50
.75
0
.60
−50
0
What is the risk premium for the payoff of 50?
96.
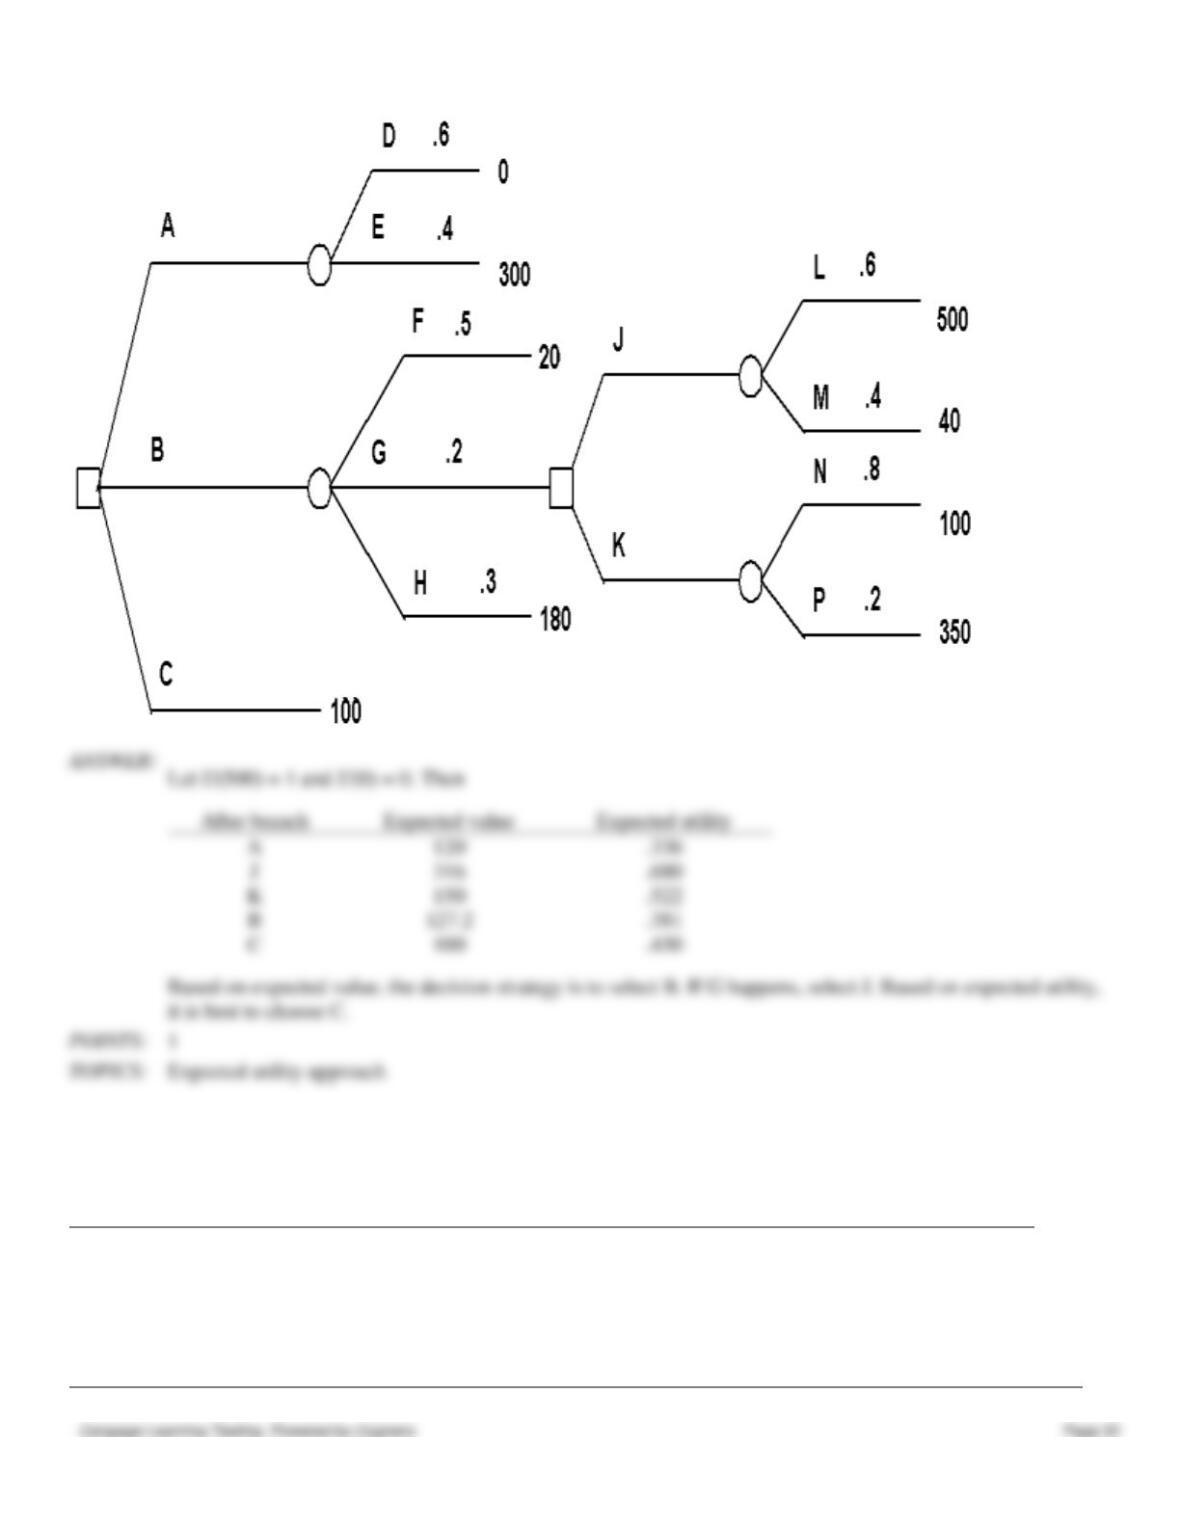
Determine decision strategies based on expected value and on expected utility for this decision tree. Use the utility
function
Payoff
Indifference Probability
500
1.00
350
.89
300
.84
180
.60
100
.43
40
.20
20
.13
0
0
Chapter 13 – Decision Analysis
97.
Burger Prince Restaurant is considering the purchase of a $100,000 fire insurance policy. The fire statistics indicate that in
a given year the probability of property damage in a fire is as follows:
Fire Damage
$100,000
$75,000
$50,000
$25,000
$10,000
$0
Probability
.006
.002
.004
.003
.005
.980
a.
If Burger Prince was risk neutral, how much would they be willing to pay for fire insurance?
b.
If Burger Prince has the utility values given below, approximately how much would they be
willing to pay for fire insurance?
Loss
$100,000
$75,000
$50,000
$25,000
$10,000
$5,000
$0
Utility
0
30
60
85
95
99
100
Chapter 13 – Decision Analysis
a.
$1,075
b.
$5,000
98.
Super Cola is considering the introduction of a new 8 oz. root beer. The probability that the root beer will be a success is
believed to equal .6. The payoff table is as follows:
Success (s1)
Failure (s2)
Produce
$250,000
−$300,000
Do Not Produce
−$50,000
−$20,000
Company management has determined the following utility values:
Amount
$250,000
−$20,000
−$50,000
−$300,000
Utility
100
60
55
0
a.
Is the company a risk taker, risk averse, or risk neutral?
b.
What is Super Cola’s optimal decision?
a.
Risk averse
Produce root beer as long as p 60/105 = .571
99.
Chez Paul is contemplating either opening another restaurant or expanding its existing location. The payoff table for these
two decisions is:
State of Nature
Decision
s1
s2
s3
New Restaurant
−$80,000
$20,000
$160,000
Expand
−$40,000
$20,000
$100,000
Paul has calculated the indifference probability for the lottery having a payoff of $160,000 with probability p and
−$80,000 with probability (1−p) as follows:
Amount
Indifference Probability (p)
−$40,000
.4
$20,000
.7
$100,000
.9
a.
Is Paul a risk avoider, a risk taker, or risk neutral?
b.
Suppose Paul has defined the utility of −$80,000 to be 0 and the utility of $160,000 to be 80.
What would be the utility values for −$40,000, $20,000, and $100,000 based on the
indifference probabilities?
c.
Suppose P(s1) = .4, P(s2) = .3, and P(s3) = .3. Which decision should Paul make? Compare
with the decision using the expected value approach.
Chapter 13 – Decision Analysis
A risk avoider
100.
The Dollar Department Store chain has the opportunity of acquiring either 3, 5, or 10 leases from the bankrupt Granite
Variety Store chain. Dollar estimates the profit potential of the leases depends on the state of the economy over the next
five years. There are four possible states of the economy as modeled by Dollar Department Stores and its president
estimates P(s1) = .4, P(s2) = .3, P(s3) = .1, and P(s4) = .2. The utility has also been estimated. Given the payoffs (in
$1,000,000’s) and utility values below, which decision should Dollar make?
Payoff Table
State Of The Economy
Over The Next 5 Years
Decision
s1
s2
s3
s4
d1 — buy 10 leases
10
5
0
−20
d2 — buy 5 leases
5
0
−1
−10
d3 — buy 3 leases
2
1
0
−1
d4 — do not buy
0
0
0
0
Utility Table
Payoff (in $1,000,000’s)
+10
+5
+2
0
−1
−10
−20
Utility
+10
+5
+2
0
−1
−20
−50
101.
Consider the following problem with four states of nature, three decision alternatives, and the following payoff table (in
$’s):
The indifference probabilities for three individuals are:
Payoff
Person 1
Person 2
Person 3
$ 2600
1.00
1.00
1.00
$ 400
.40
.45
.55
$ 200
.35
.40
.50
$ 0
.30
.35
.45
-$ 200
.25
.30
.40
-$1400
0
0
0
a. Classify each person as a risk avoider, risk taker, or risk neutral.

Chapter 13 – Decision Analysis
b. For the payoff of $400, what is the premium the risk avoider will pay to avoid risk? What is the premium the risk
taker will pay to have the opportunity of the high payoff?
c. Suppose each state is equally likely. What are the optimal decisions for each of these three people?
s1
s2
s3
s4
d1
200
2600
–1400
200
d2
0
200
– 200
200
d3
–200
400
0
200
102.
Metropolitan Cablevision has the choice of using one of three DVR systems. Profits are believed to be a function of
customer acceptance. The payoff to Metropolitan for the three systems is:
System
Acceptance Level
I
II
III
High
$150,000
$200,000
$200,000
Medium
$ 80,000
$ 20,000
$ 80,000
Low
$ 20,000
-$ 50,000
-$100,000
The probabilities of customer acceptance for each system are:
System
Acceptance Level
I
II
III
High
.4
.3
.3
Medium
.3
.4
.5
Low
.3
.3
.2
The first vice president believes that the indifference probabilities for Metropolitan should be:
Amount
Probability
$150,000
.90
$ 80,000
.70
$ 20,000
.50
-$ 50,000
.25
The second vice president believes Metropolitan should assign the following utility values:
Amount
Utility
$200,000
125
$150,000
95
$ 80,000
55
$ 20,000
30
-$ 50,000
10
-$100,000
0
a. Which vice president is a risk taker? Which one is risk averse?
b. Which system will each vice president recommend?
c. What system would a risk neutral vice president recommend?
Chapter 13 – Decision Analysis
Essay
103. When and why should a utility approach be followed?
104. Give two examples of situations where you have decided on a course of action that did not have the highest expected
monetary value.
105. Explain how utility could be used in a decision where performance is not measured by monetary value.
106. Explain the relationship between expected utility, probability, payoff, and utility.
107. Draw the utility curves for three types of decision makers, label carefully, and explain the concepts of increasing and
decreasing marginal returns for money.
108. Explain why the decision maker might feel uncomfortable with the expected value approach, and decide to use a
non-probabilistic approach even when probabilities are available.
109. Why perform sensitivity analysis? Of what use is sensitivity analysis where good probability estimates are difficult to
obtain?
Chapter 13 – Decision Analysis
110. How can a good decision maker “improve” luck?
111. Use a diagram to compare EVwPI, EVwoPI, EVPI, EVwSI, EVwoSI, and EVSI.
112. Show how you would design a spreadsheet to calculate revised probabilities for two states of nature and two
indicators.