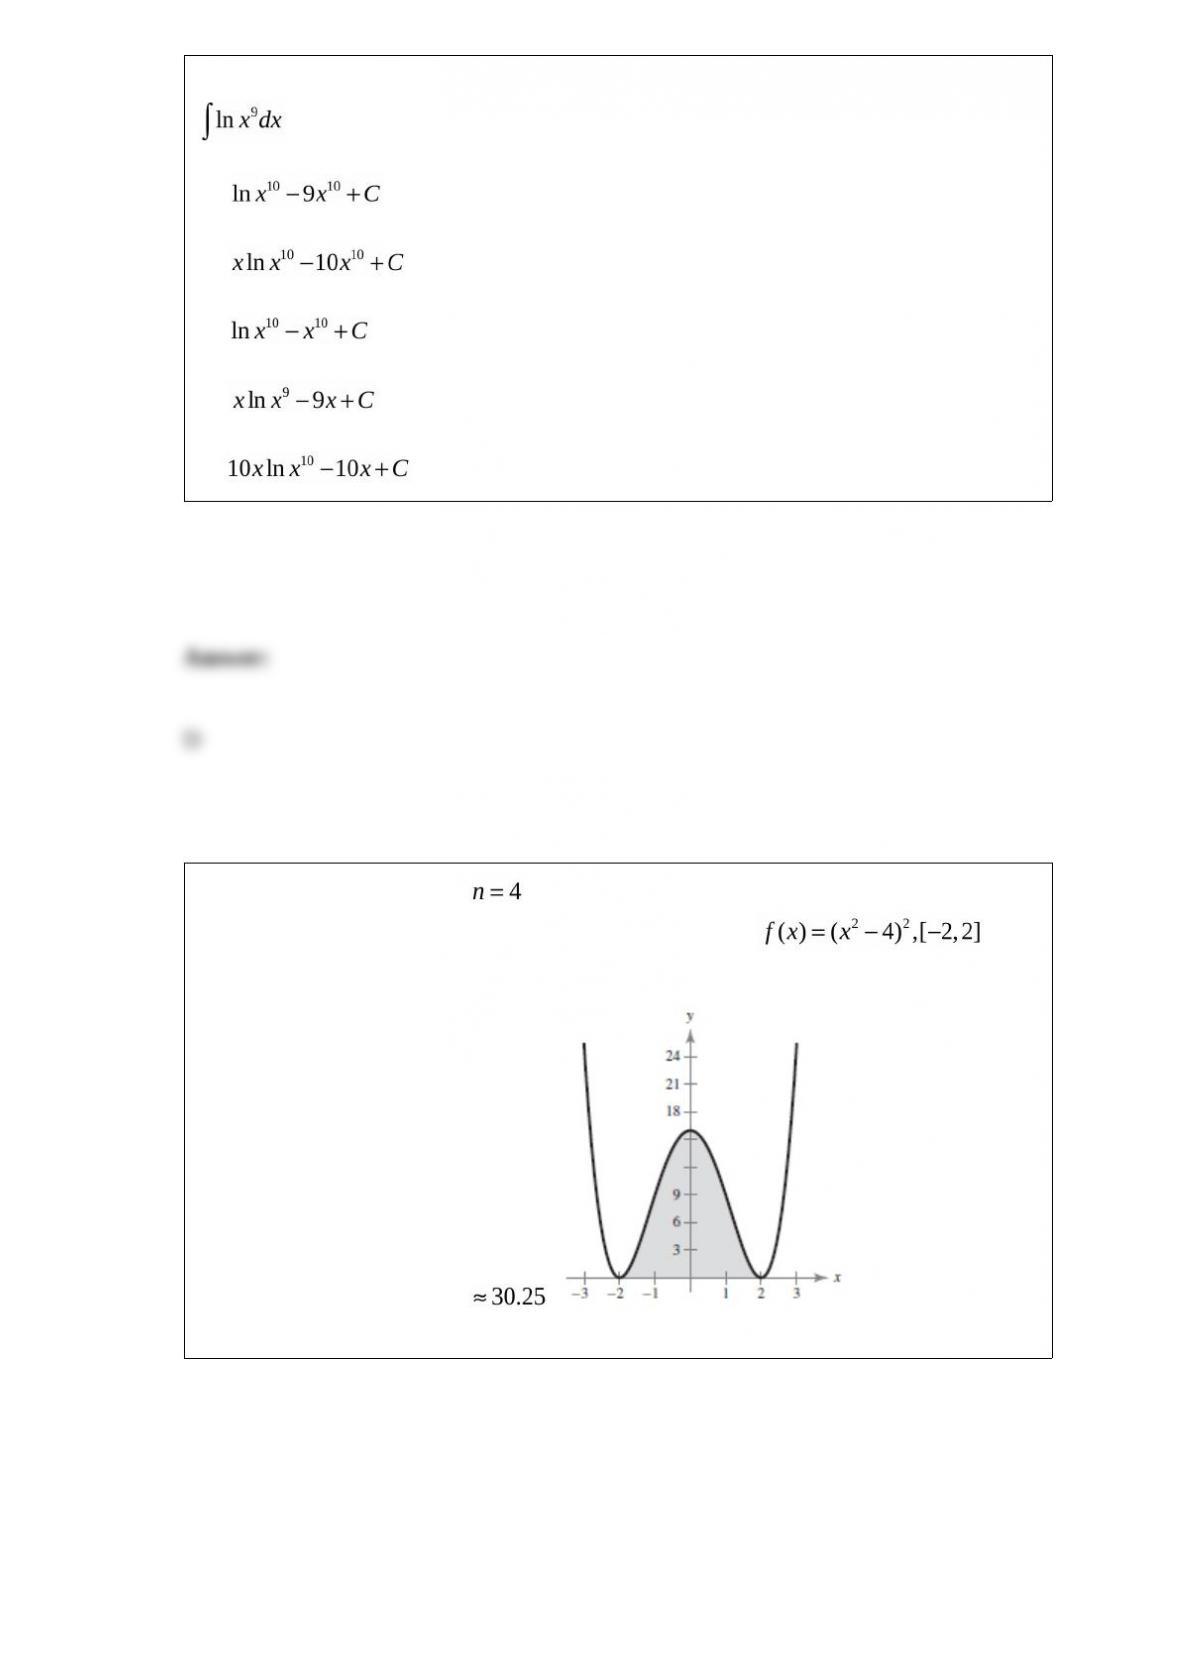
Use integration by parts to find the integral below.
A)
B)
C)
D)
E)
Use the Midpoint Rule with to approximate the area of the region bounded by the
graph of and the -axis over the interval. Sketch the region.
A) The approximate area is:
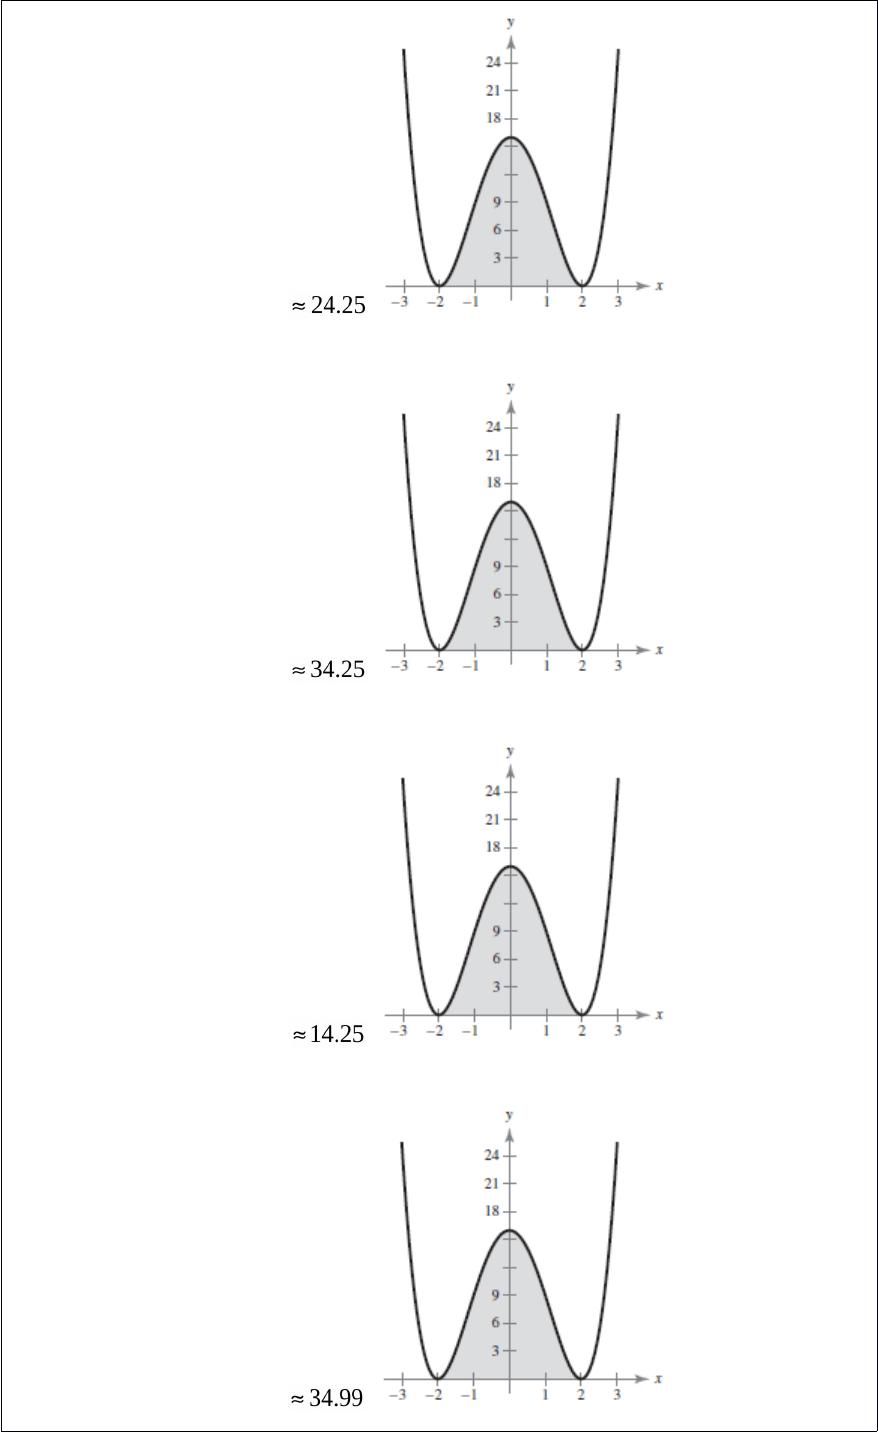
B) The approximate area is:
C) The approximate area is:
D) The approximate area is:
E) The approximate area is:
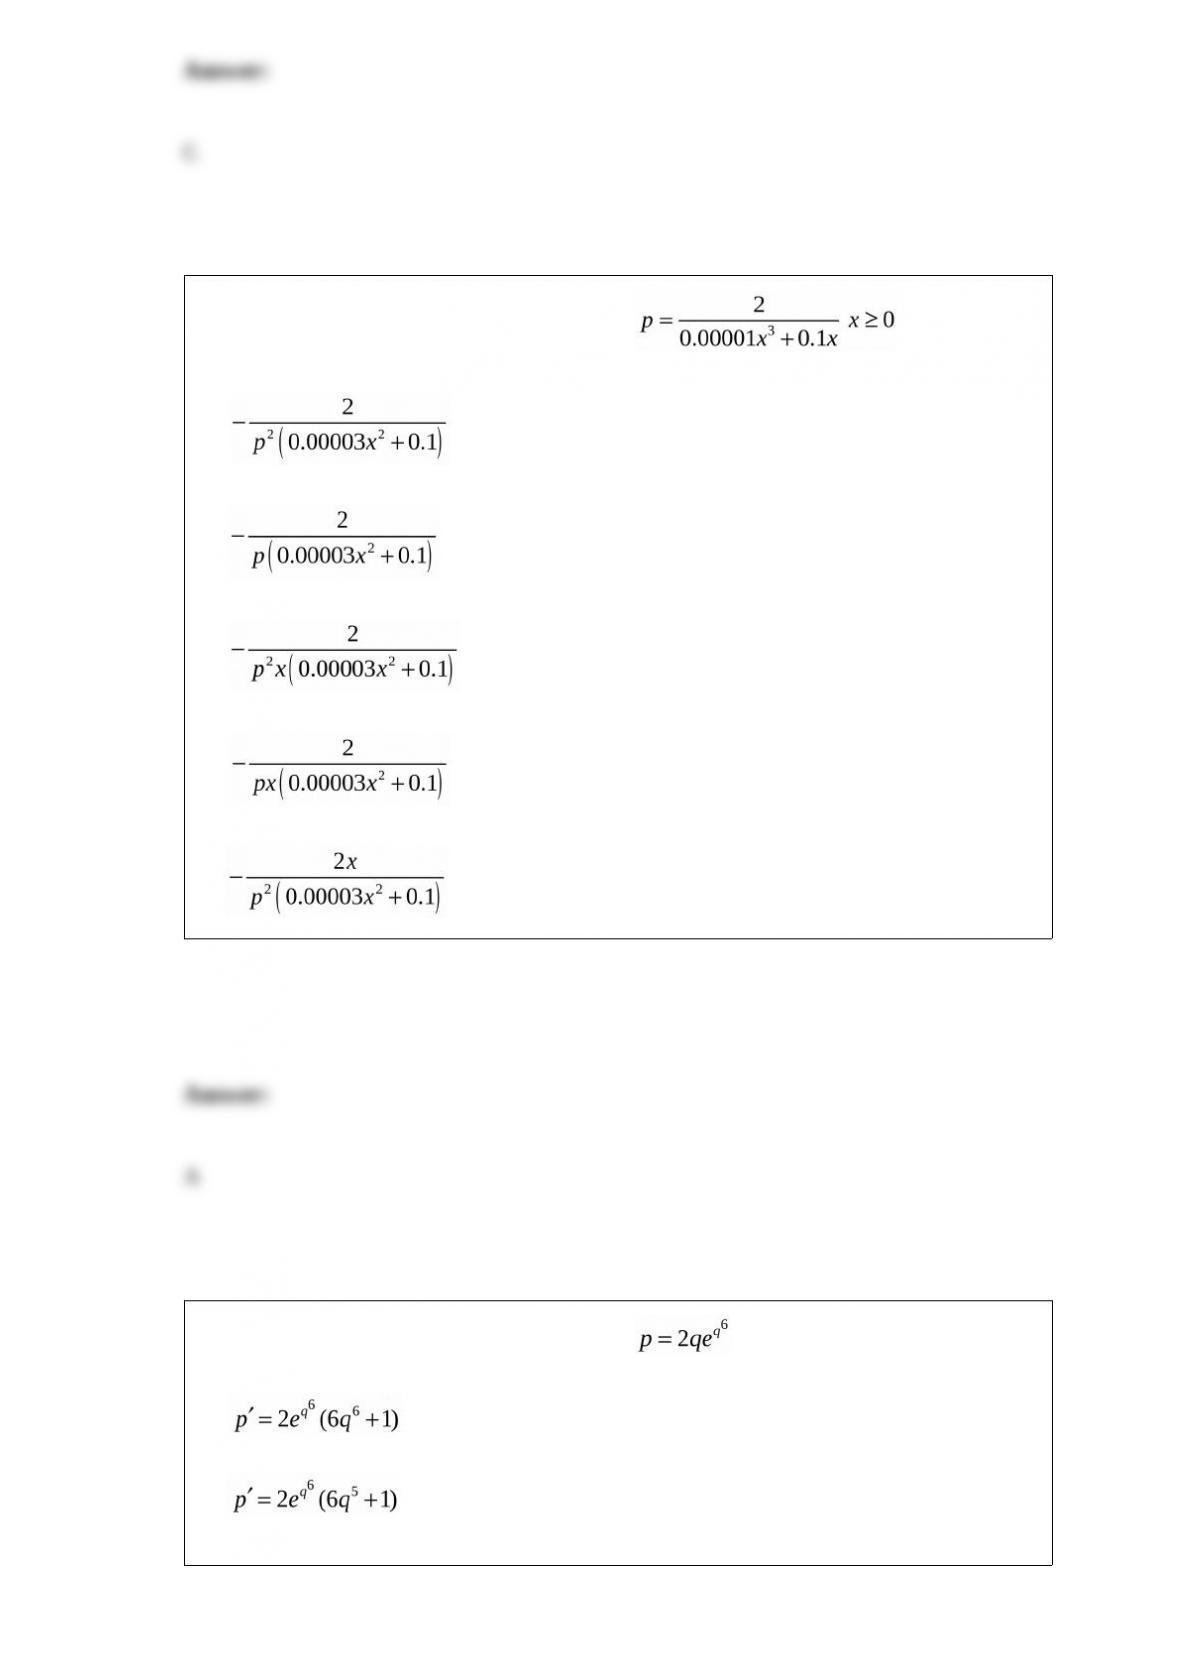
Find the rate of change of x with respect to p.
A)
B)
C)
D)
E)
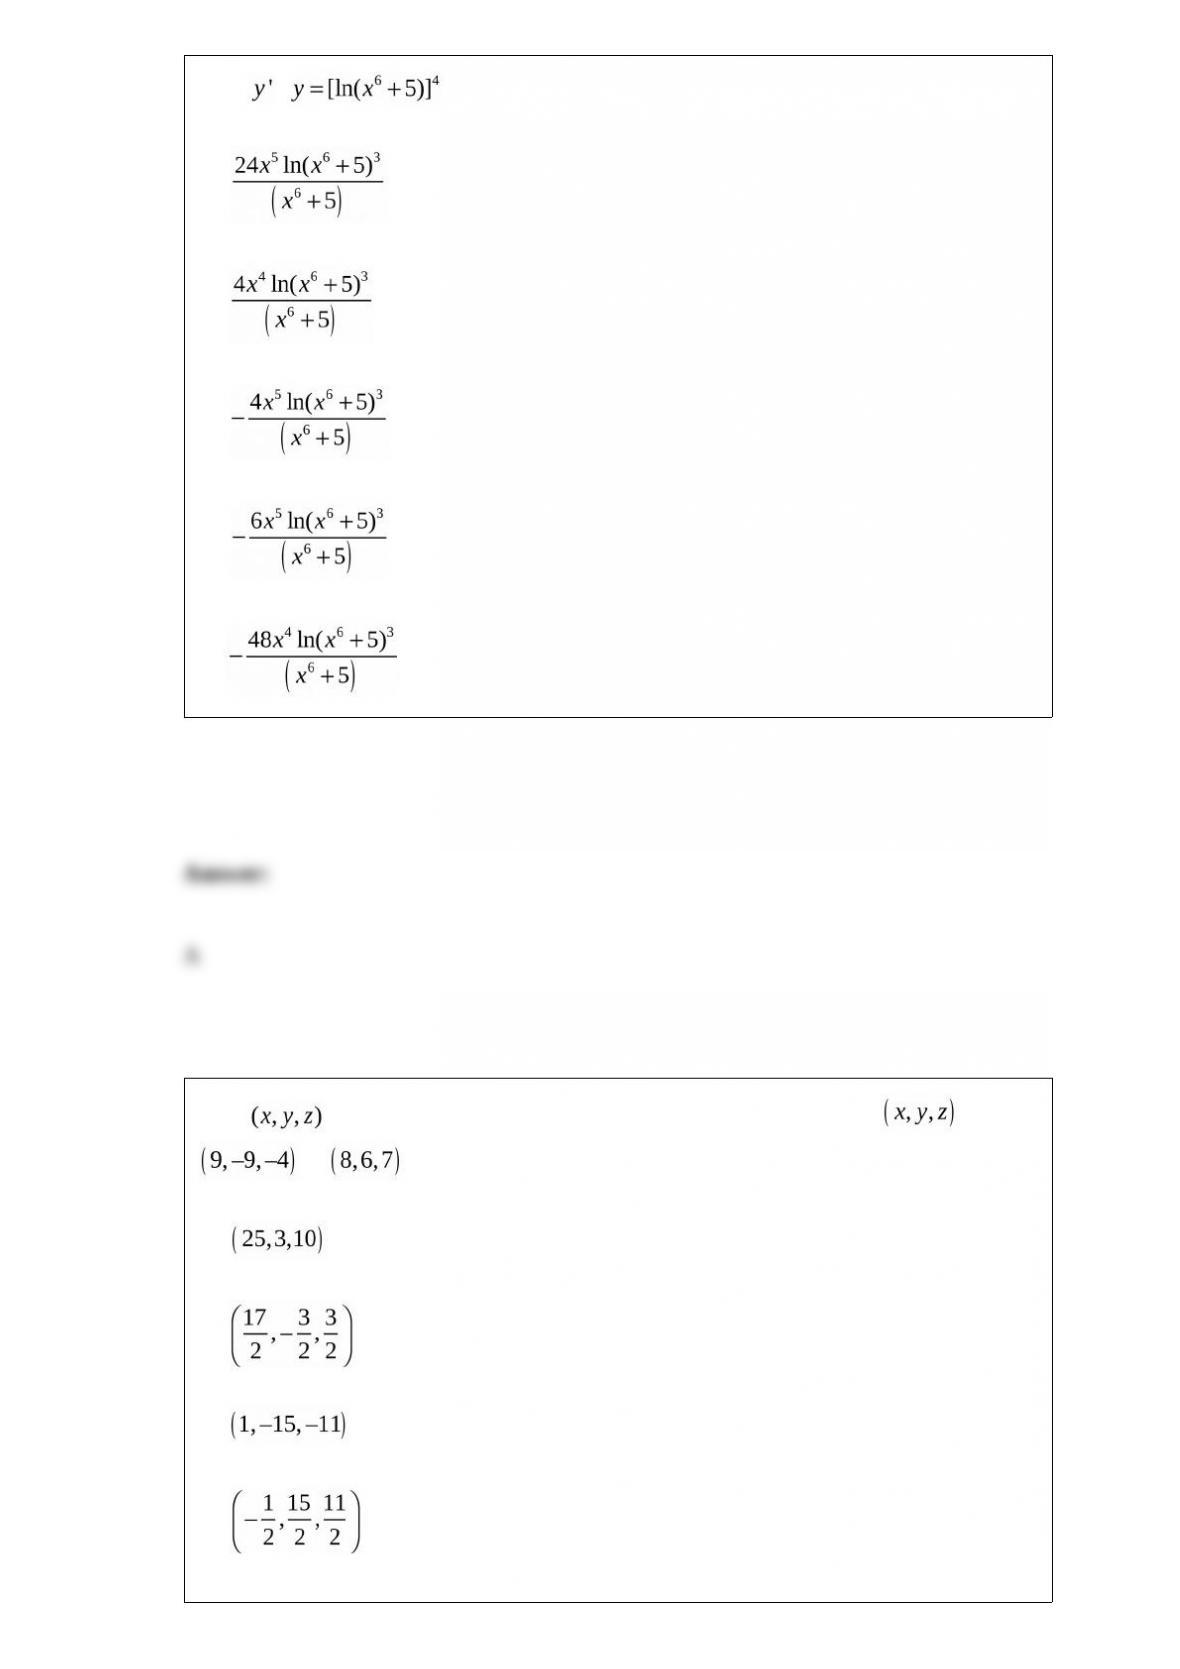
Find the derivative of the following function.
A)
B)
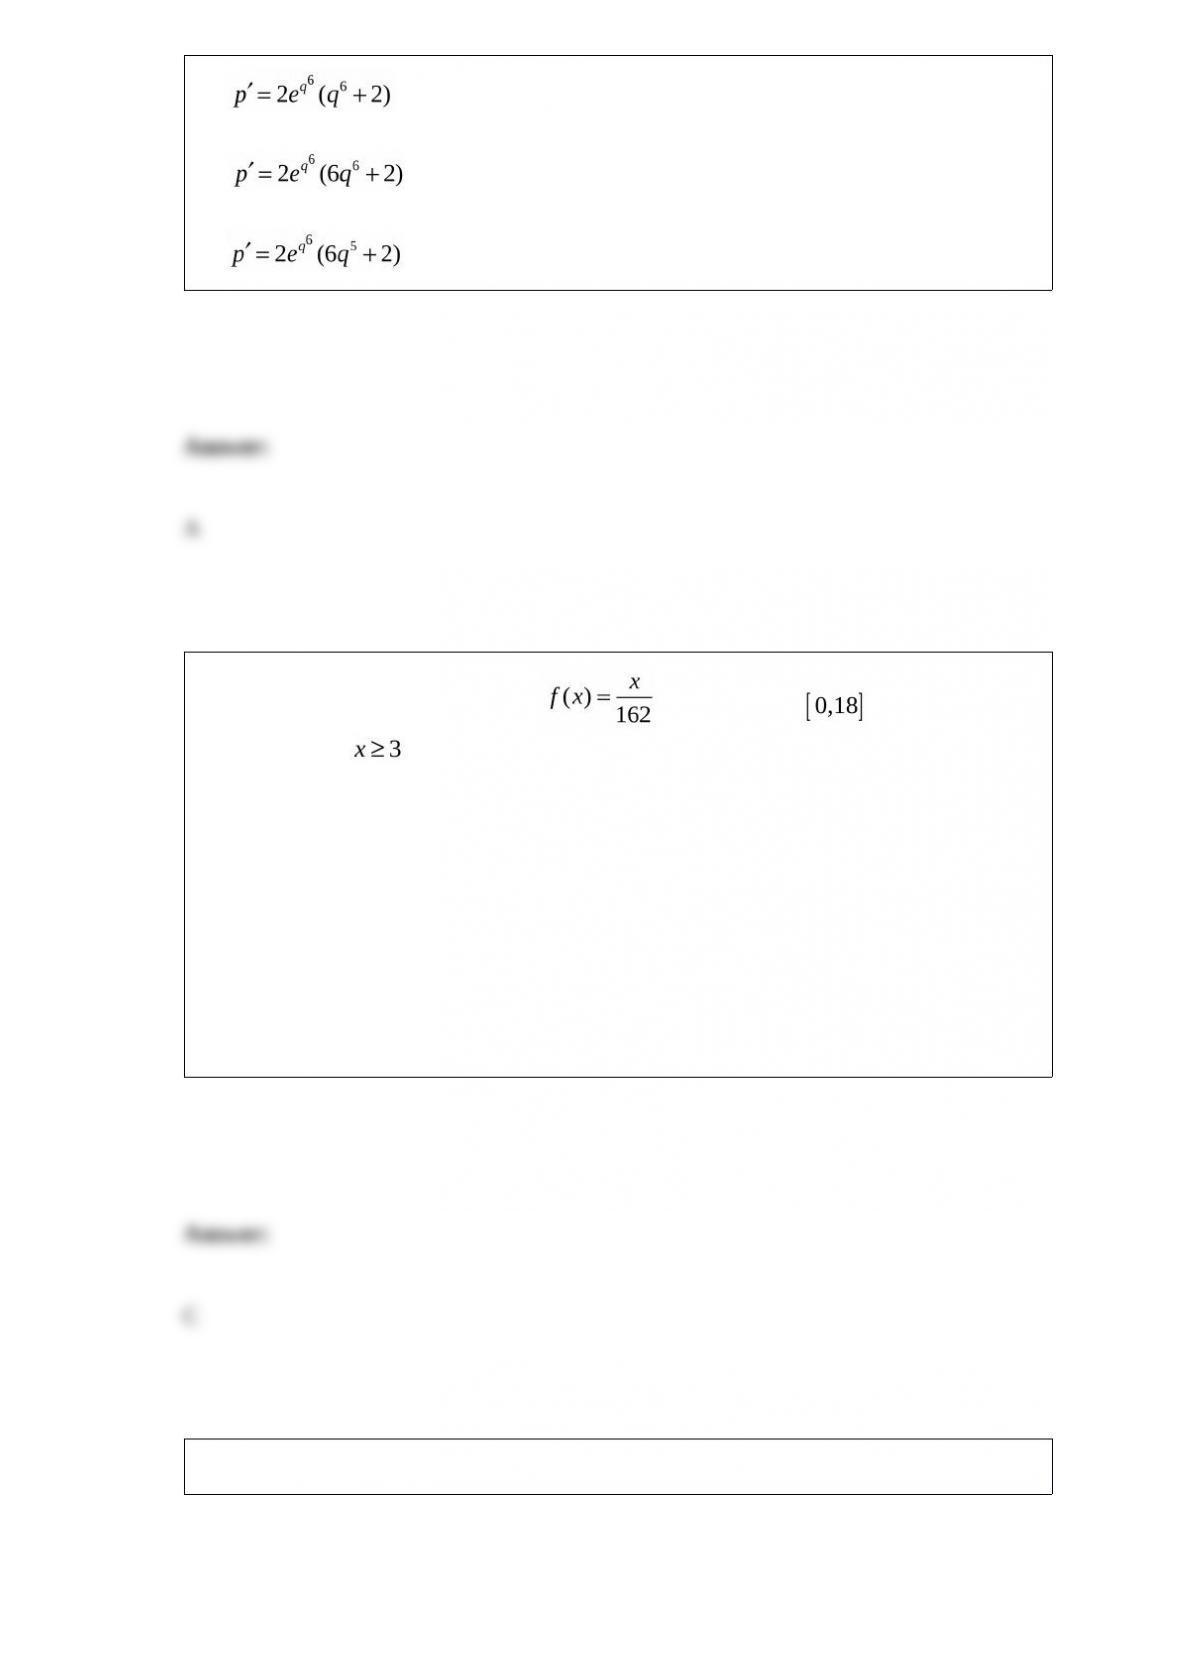
C)
D)
E)
For the probability density function on the interval , find the
probability that . Round your answer to the nearest hundredth.
A) 0.07
B) 0.83
C) 0.97
D) 0.09
E) 0.06
Set up the definite integral that gives the area of the region bounded by the graphs.
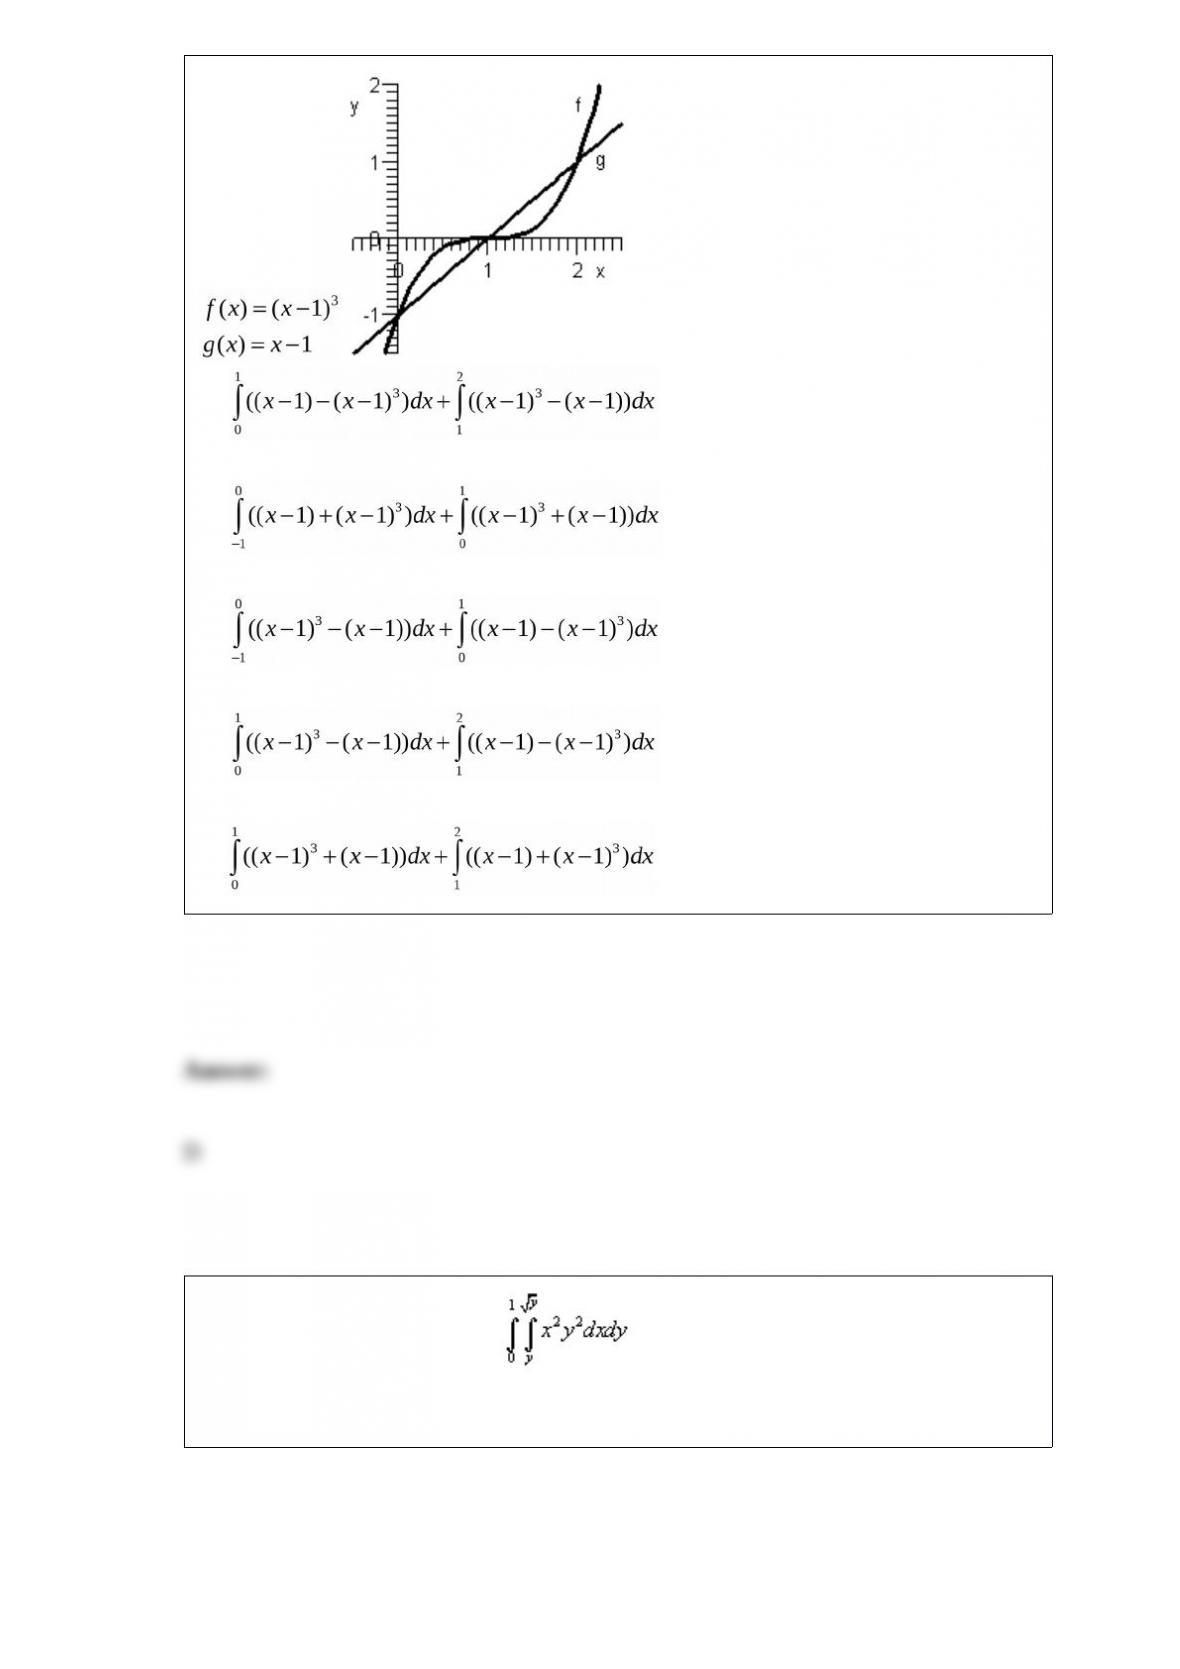
A)
B)
C)
D)
E)
Sketch the region of integration .
A)
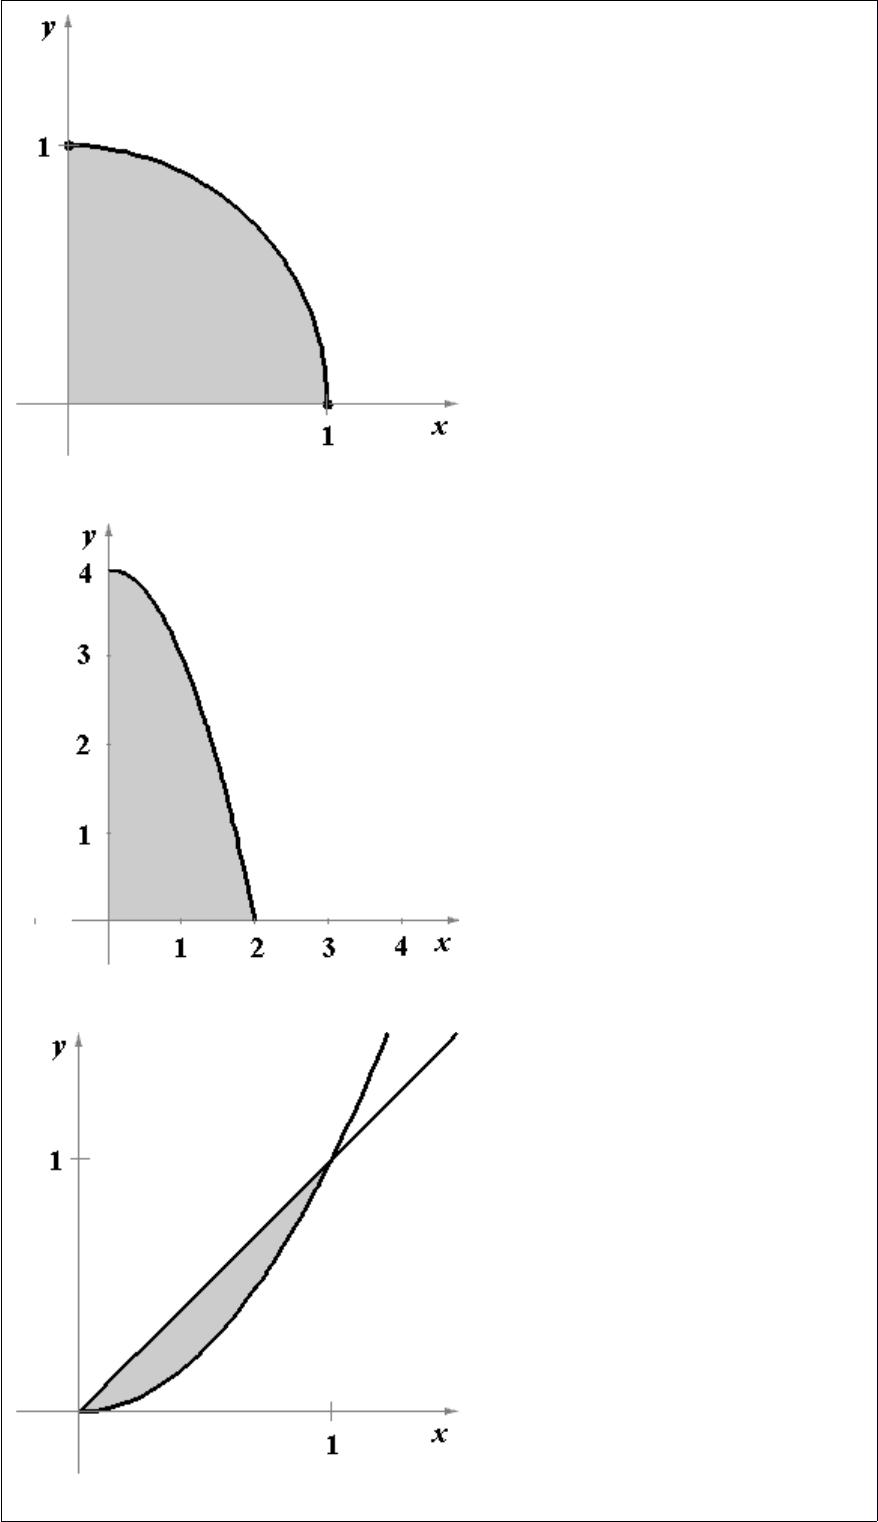
B)
C)
D)
E)
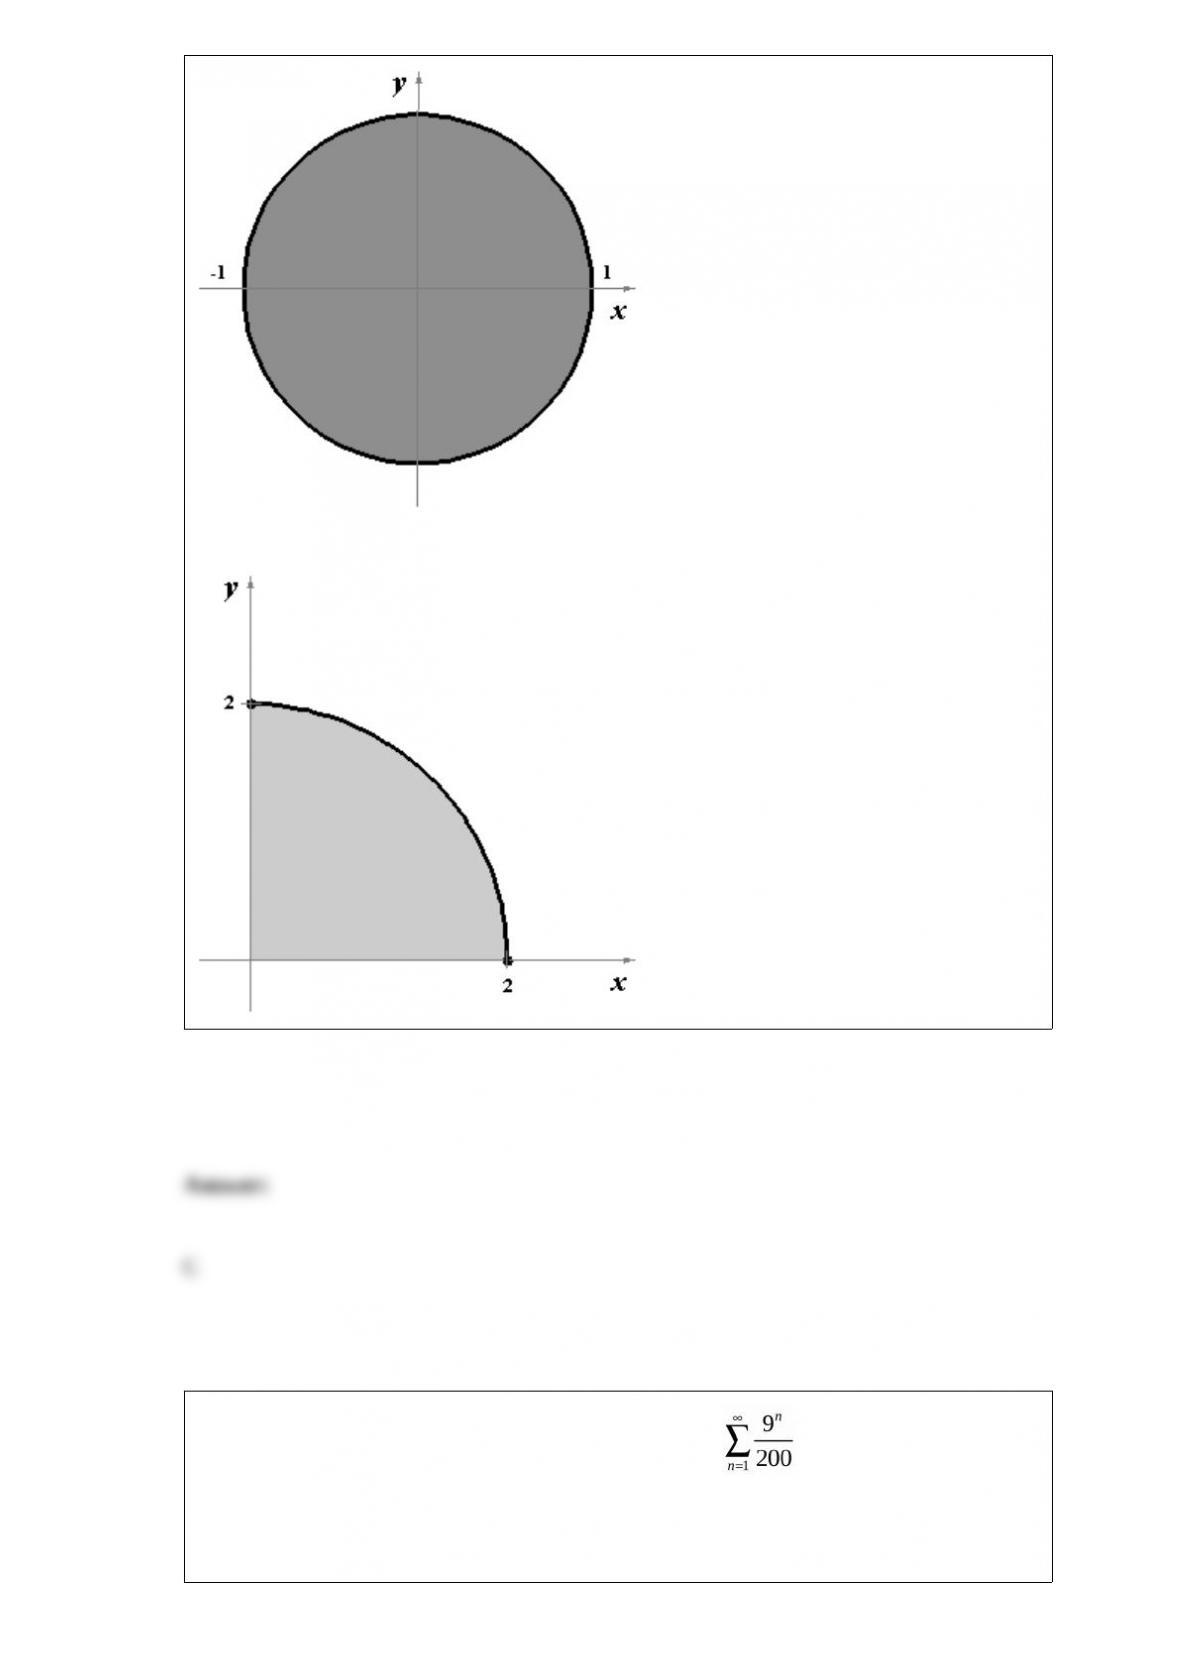
Determine the convergence or divergence of the series . Use a symbolic algebra
utility to verify your result.
A) The series converges.
B) The series diverges.
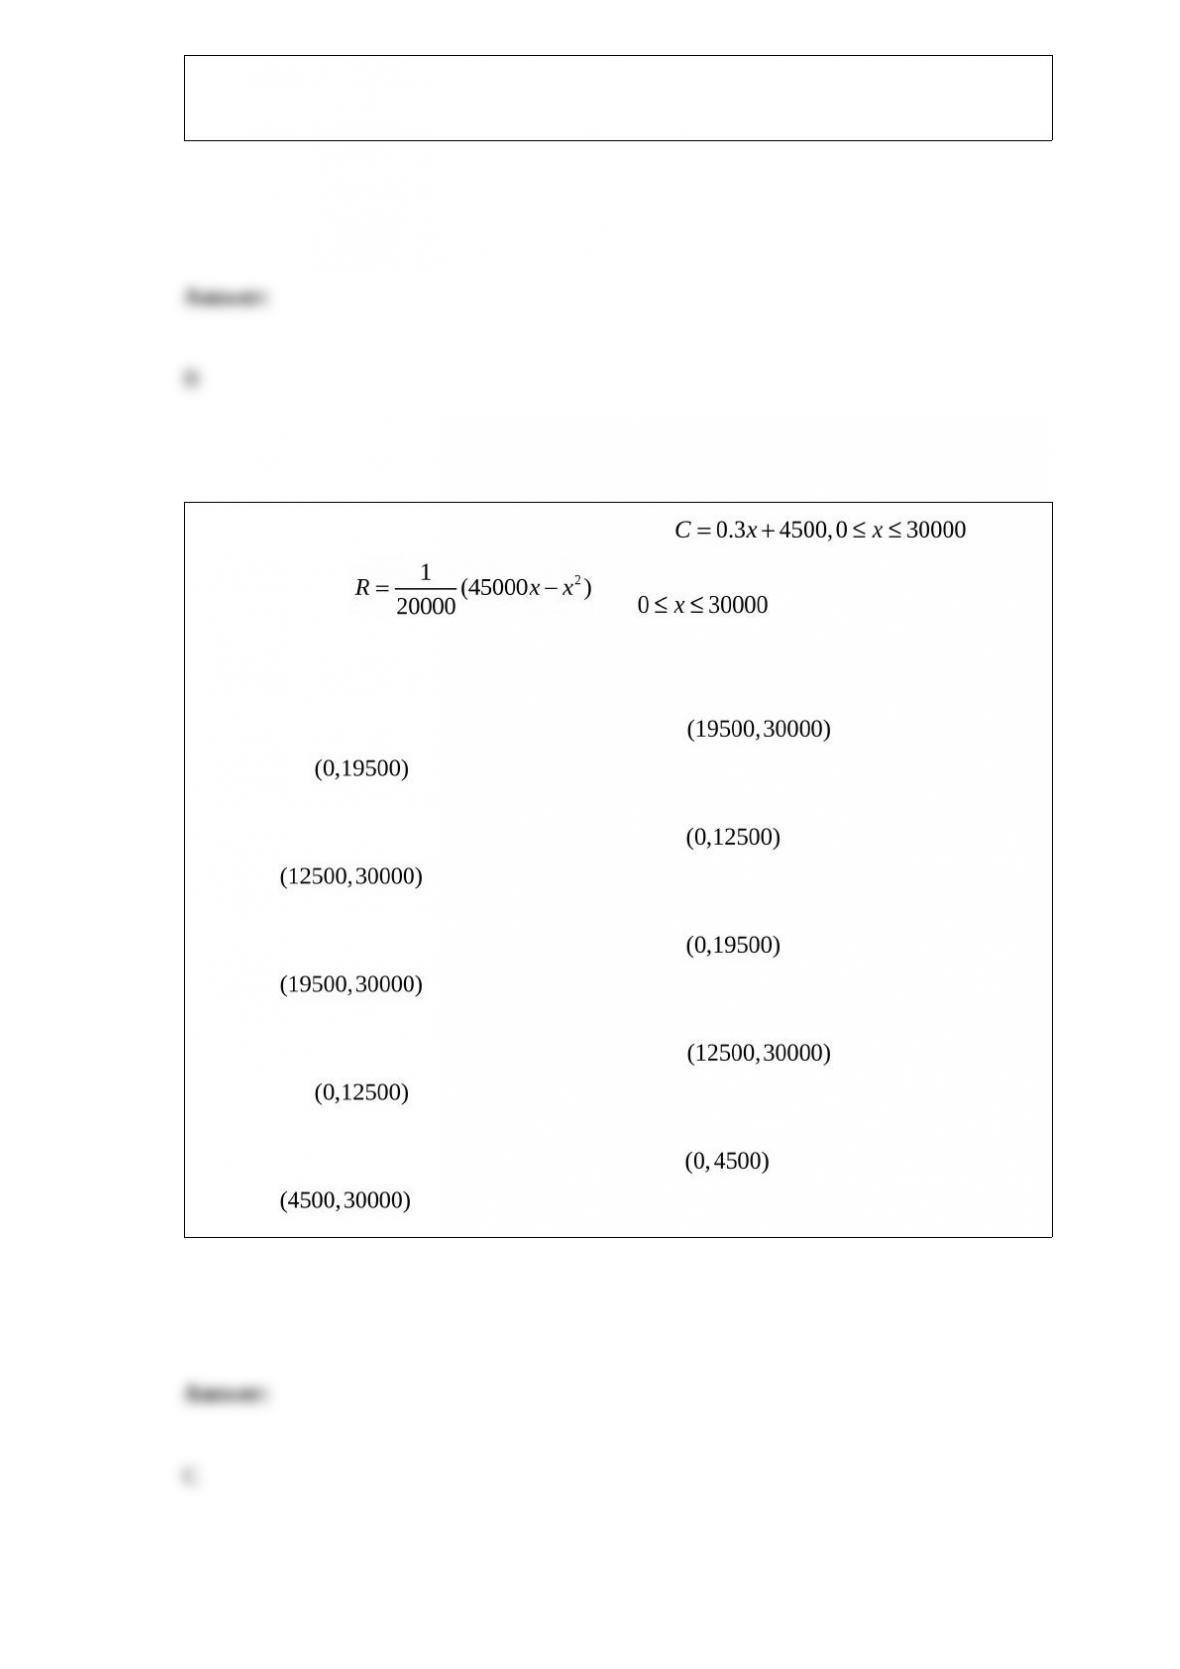
A fast-food restaurant determines the cost model, and
revenue model, for where x is the number of
hamburgers sold. Determine the intervals on which the profit function is increasing and
on which it is decreasing.
A) The profit function is increasing on the interval and decreasing on
the interval .
B) The profit function is increasing on the interval and decreasing on the
interval .
C) The profit function is increasing on the interval and decreasing on the
interval .
D) The profit function is increasing on the interval and decreasing on
the interval .
E) The profit function is increasing on the interval and decreasing on the
interval .
Determine whether the function below has any horizontal asymptotes.
A) horizontal asymptotes: y = 1
B) no horizontal asymptotes
C) horizontal asymptotes: y = 0 and y = 2
D) horizontal asymptotes: y = 3
E) horizontal asymptotes: y = 1 and y = 3
Use the table of integrals to find the average value of the growth function
over the interval , where N the size of a population and t is the
time in days. Round your answer to three decimal places.
A) 248.346
B) 1057.983
C) 246.346
D) 680.477
E) 682.451
Find .
A)
B)
C)
D)
E)
Find if the midpoint of the line segment joining the two points and
is .
A)
B)
C)
D)
E)
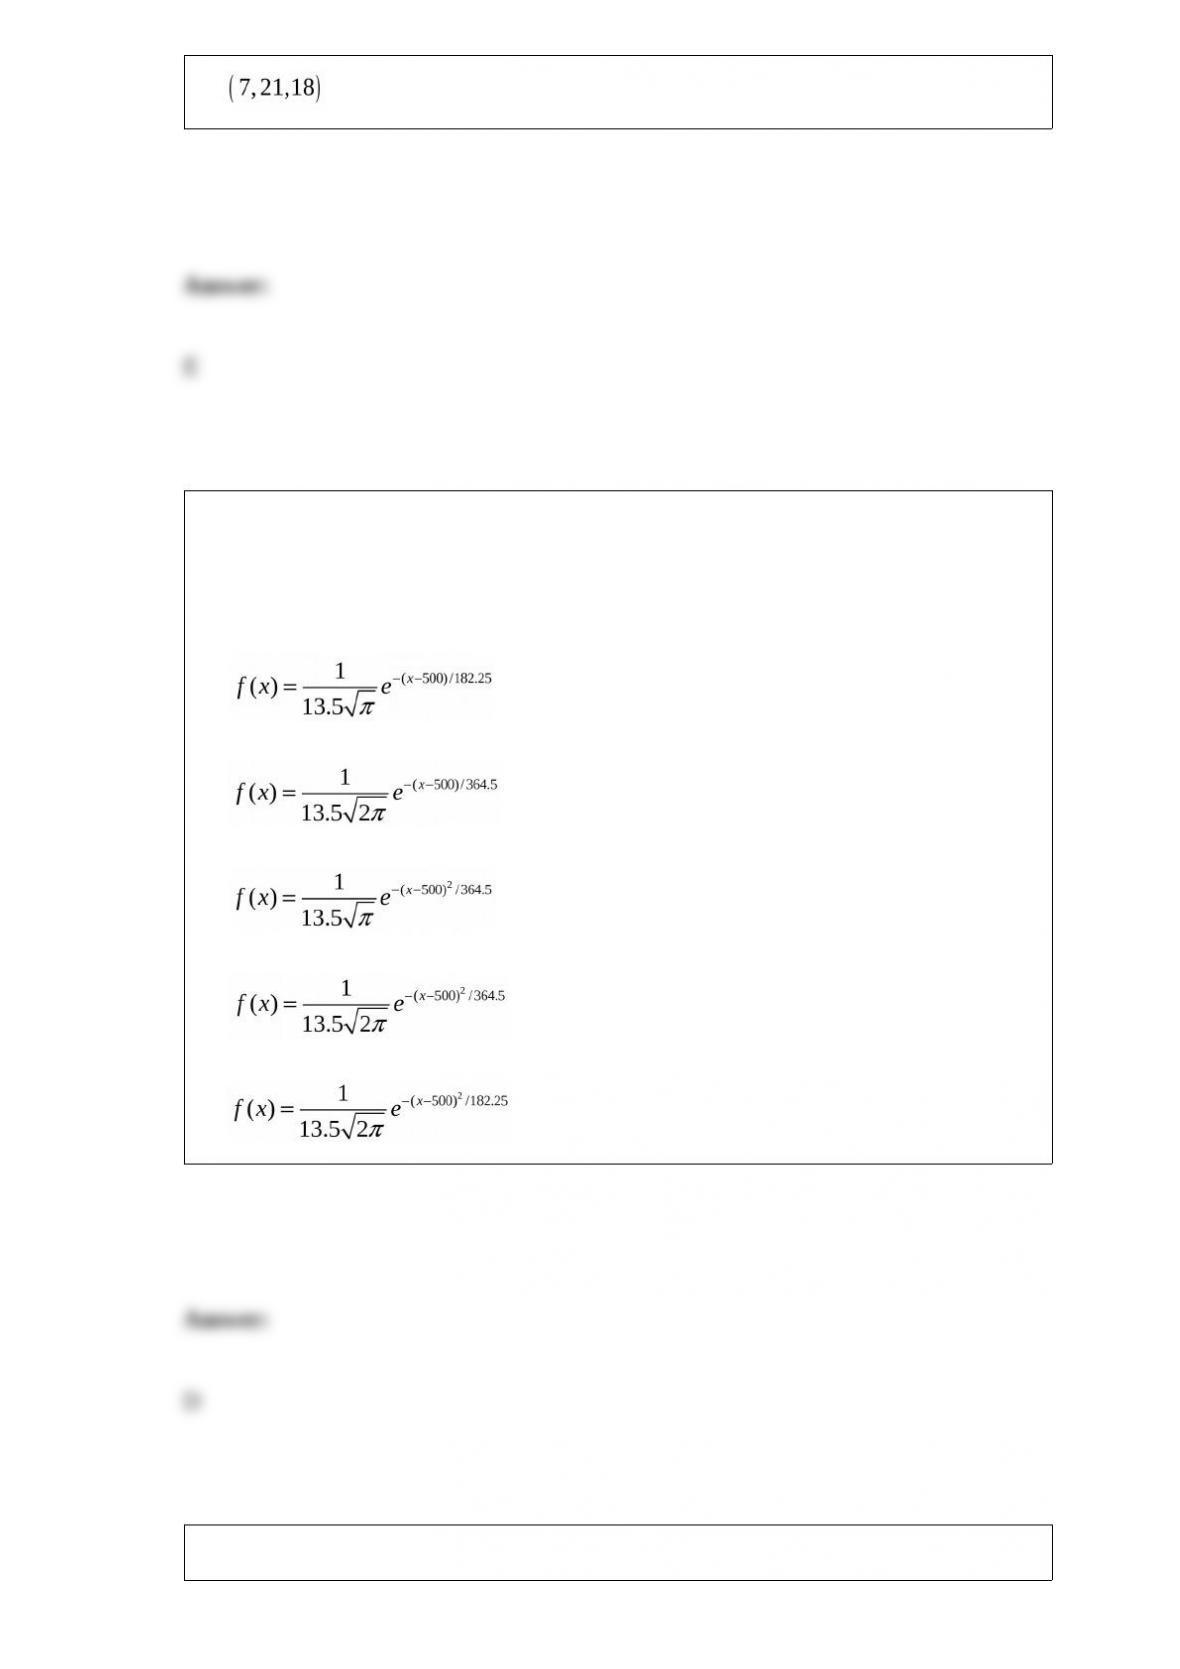
A survey of high school seniors from a certain school district who took the SAT has
determined that the mean score on the mathematics portion was 500 with a standard
deviation of 13.5. Assuming the data can be modeled by a normal probability density
function, find a model for these data.
A)
B)
C)
D)
E)
Find the limit:
A)
B)
C) 0
D) “1
E) 1
Sketch the graph of the function given below. Choose a scale that allows all relative
extrema and points of inflection to be identified on the graph.
A)
B)
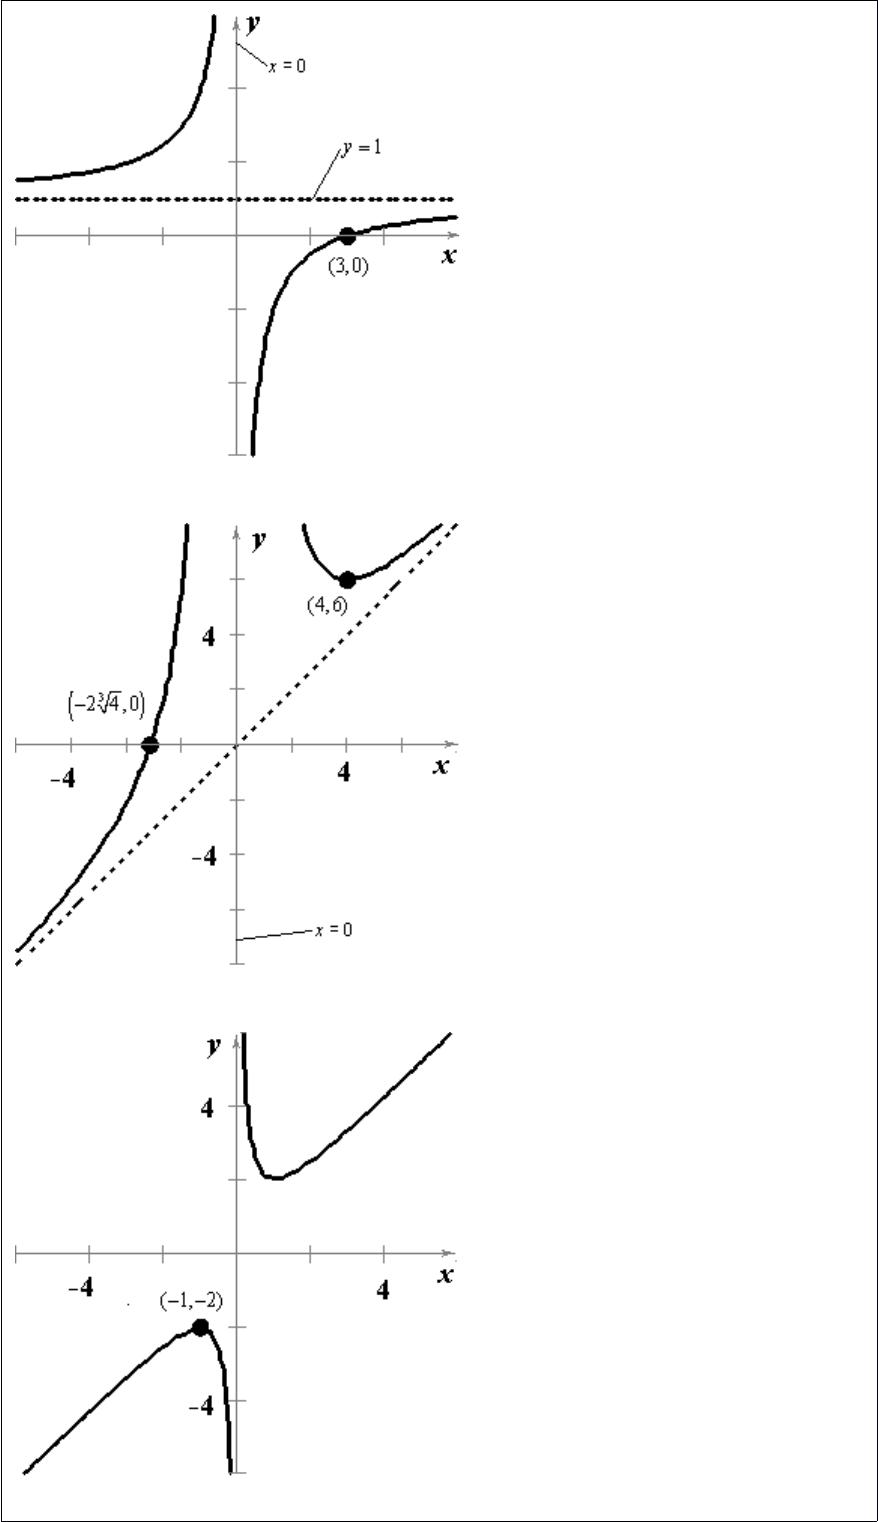
C)
D)
E)
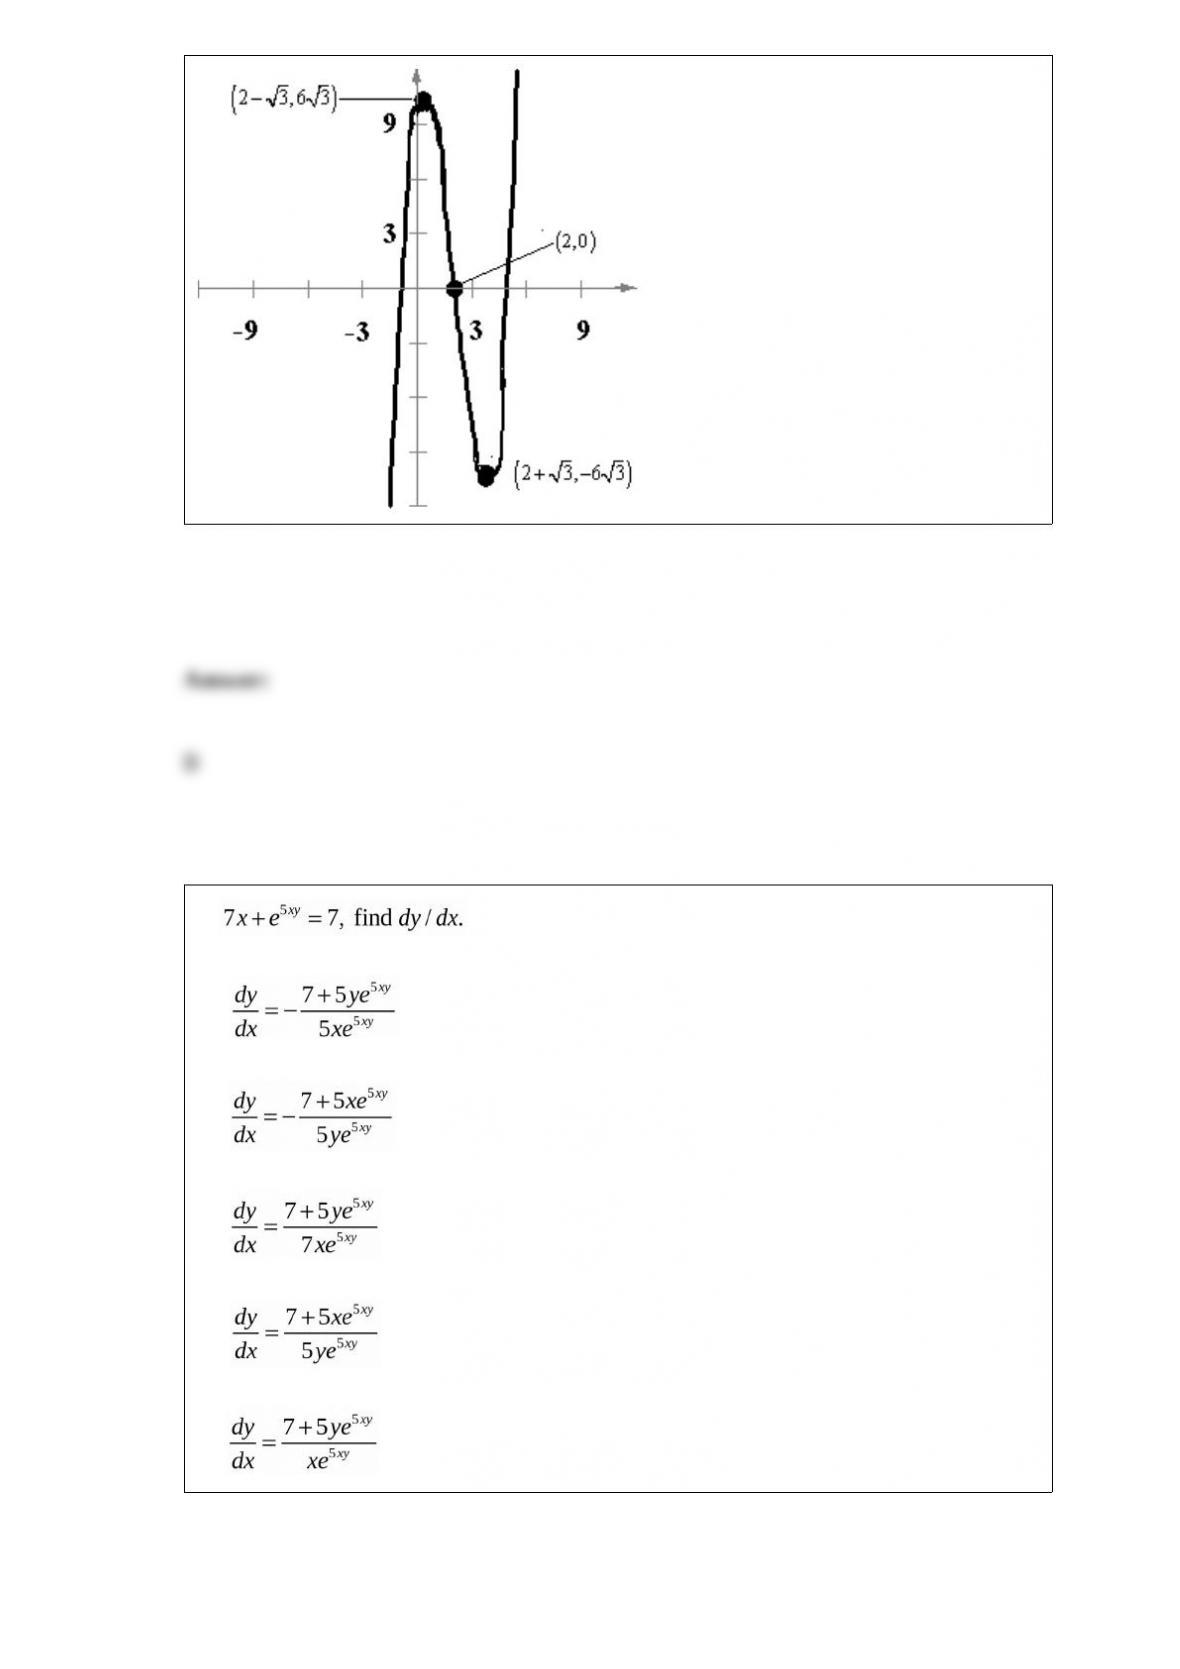
If
A)
B)
C)
D)
E)
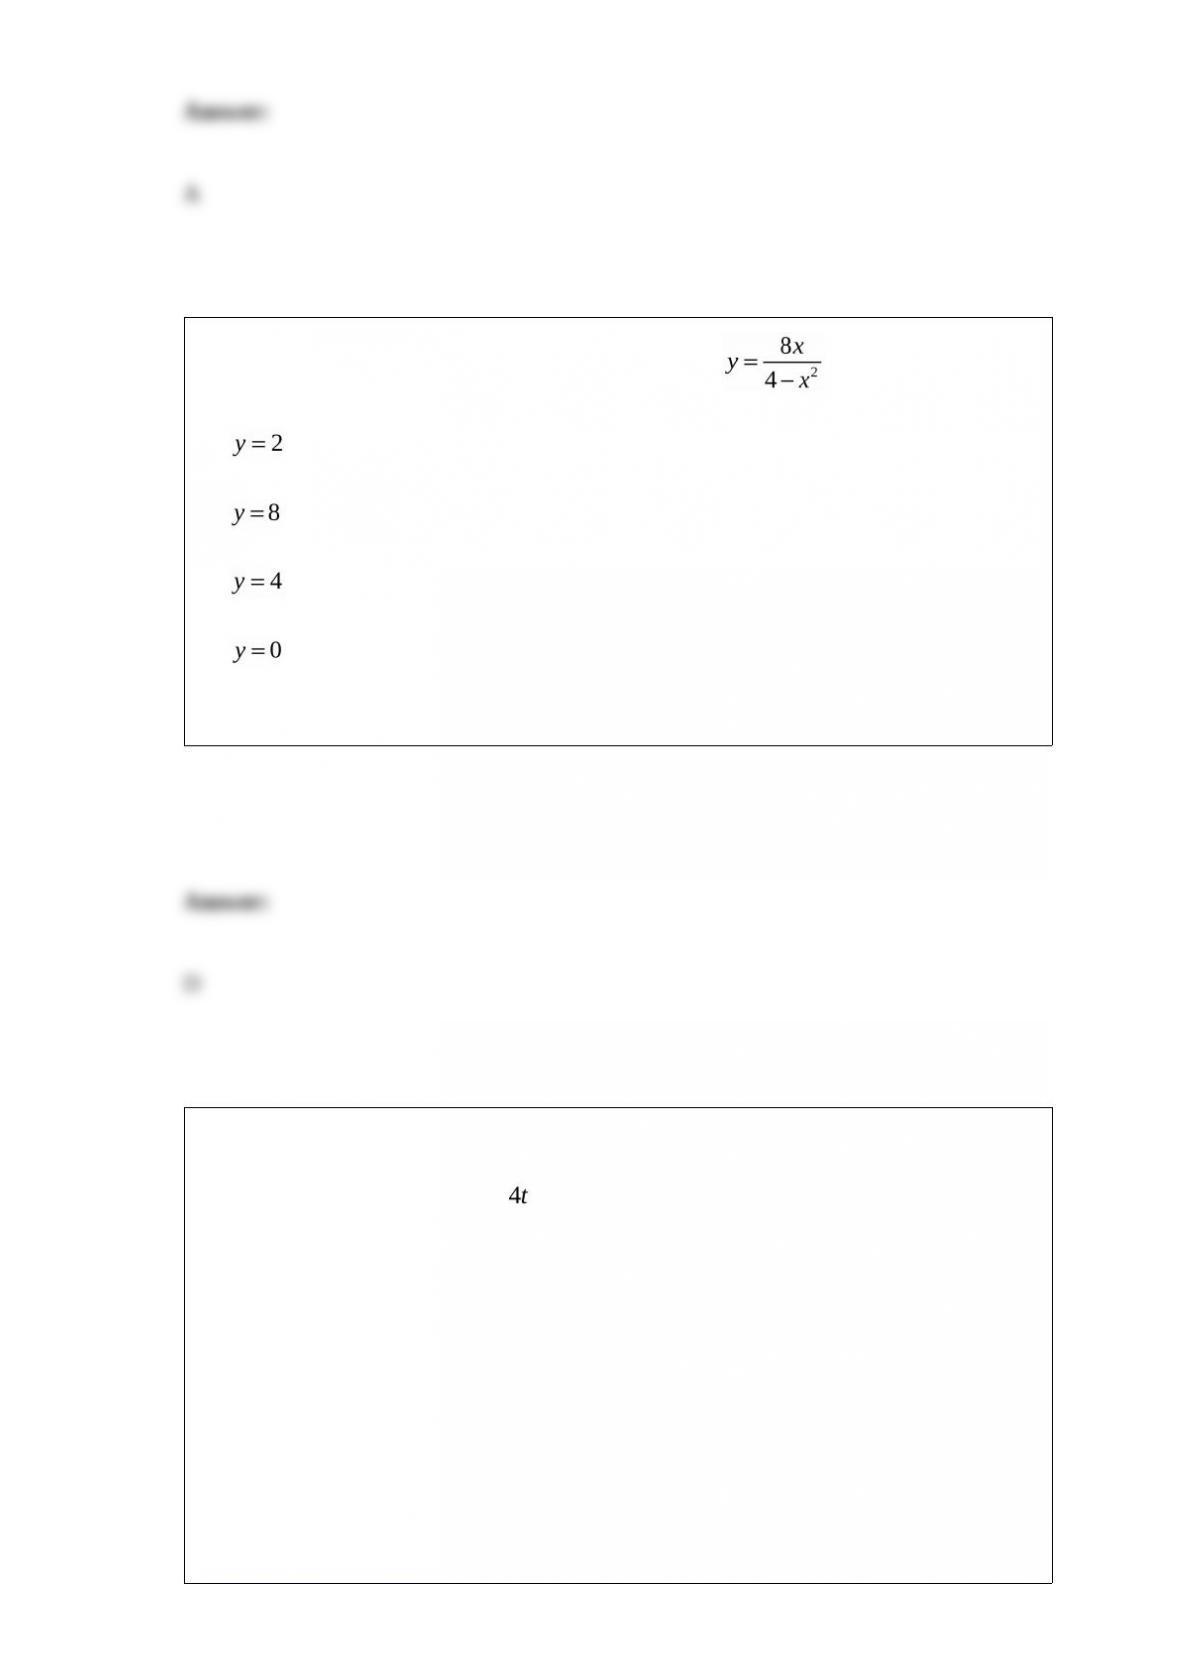
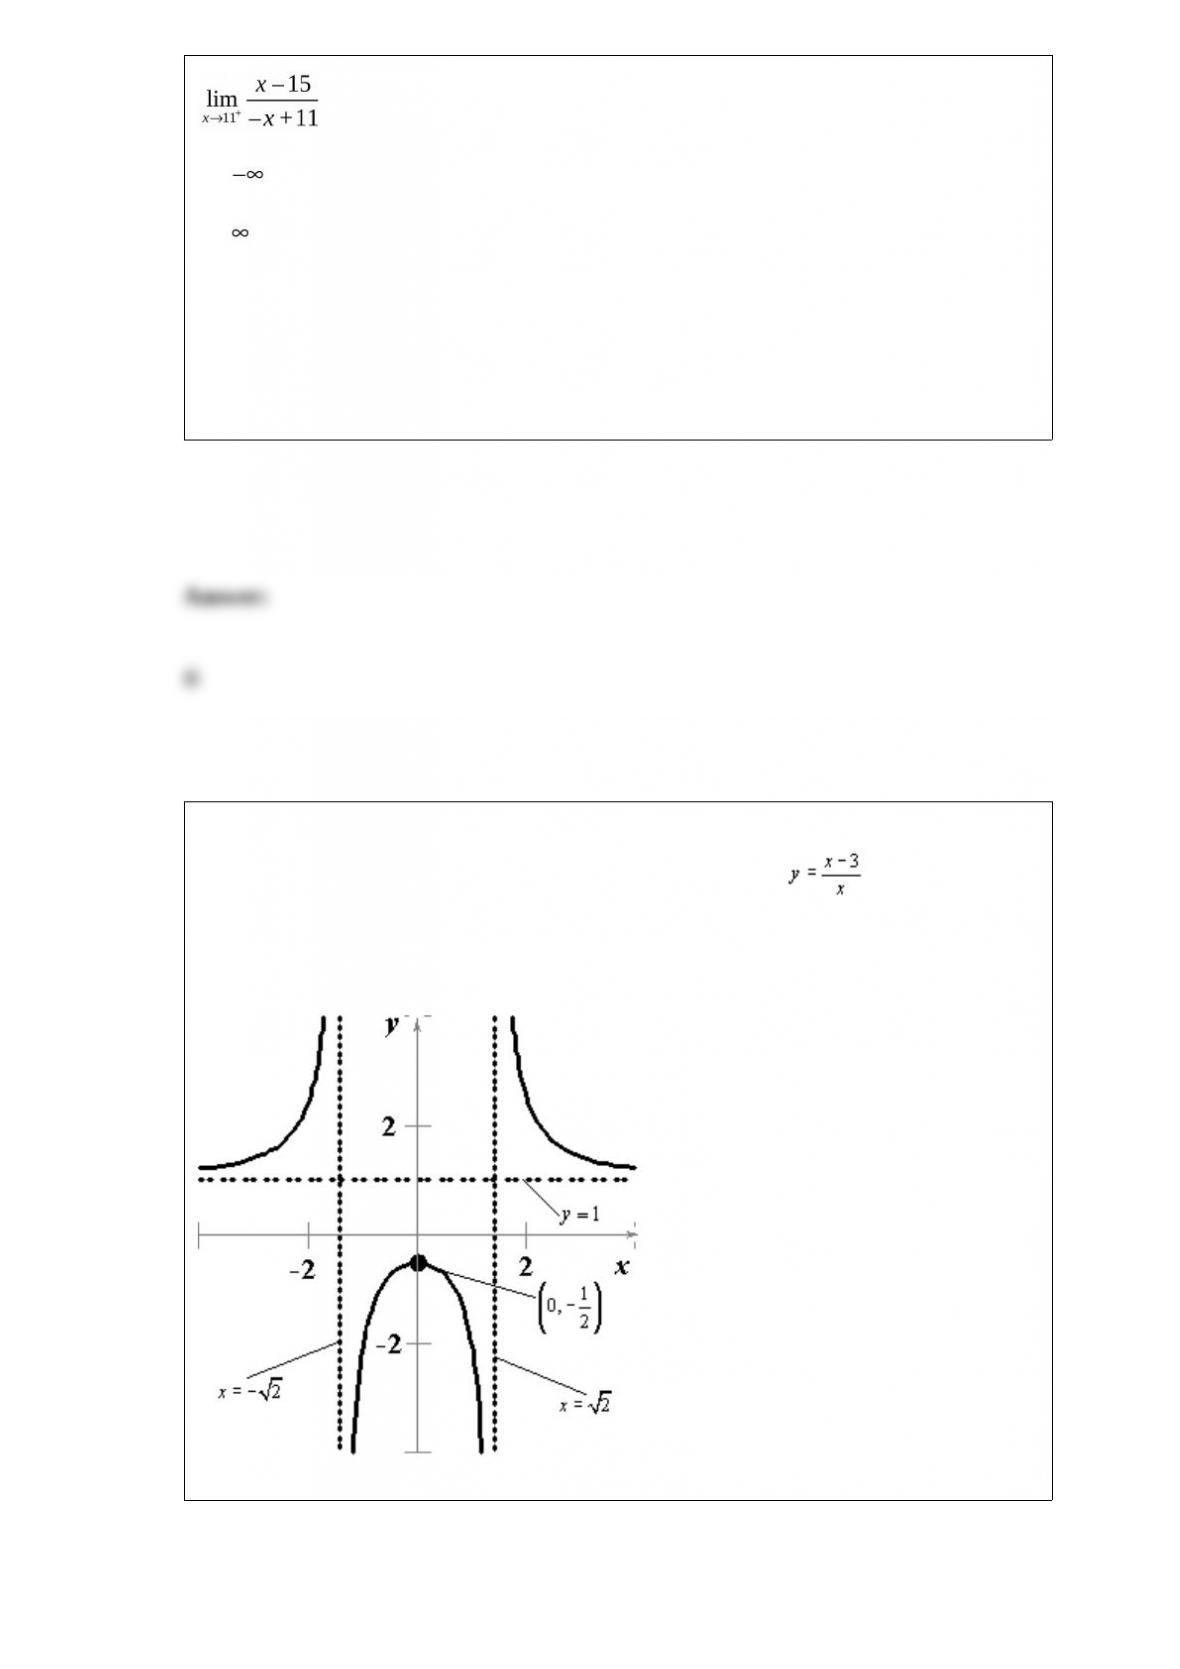
Find any horizontal asymptotes for the given function.
A)
B)
C)
D)
E) no horizontal asymptotes
Present Value of a Continuous Stream of Income. An electronics company generates a
continuous stream of income of million dollars per year, where t is the number of
years that the company has been in operation. Find the present value of this stream of
income over the first 9 years at a continuous interest rate of 12%. Round answer to one
decimal place.
A) $143.7 million
B) $81.6 million
C) $182.7 million
D) $343.2 million
E) $85.8 million
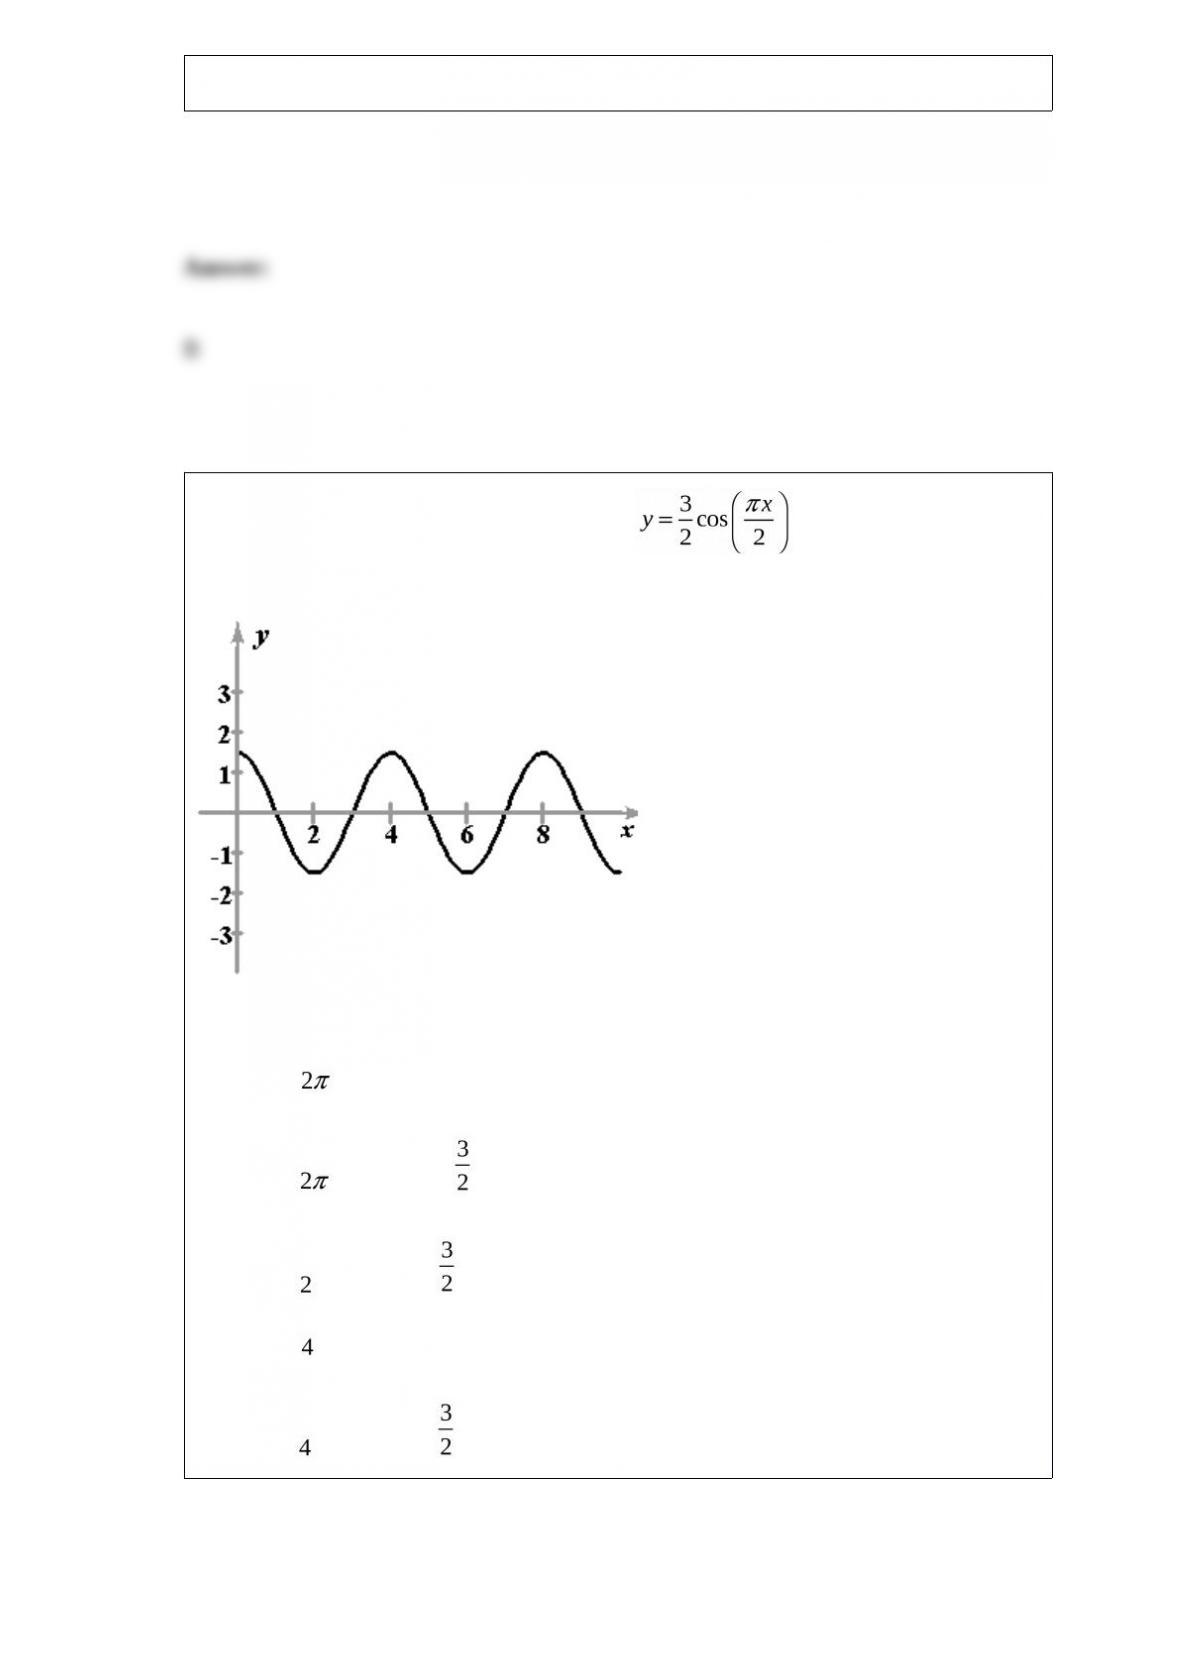
Find the period and amplitude of the function .
A) Period: ; Amplitude:3
B) Period: ; Amplitude:
C) Period: ; Amplitude:
D) Period: ; Amplitude: 3
E) Period: ; Amplitude:
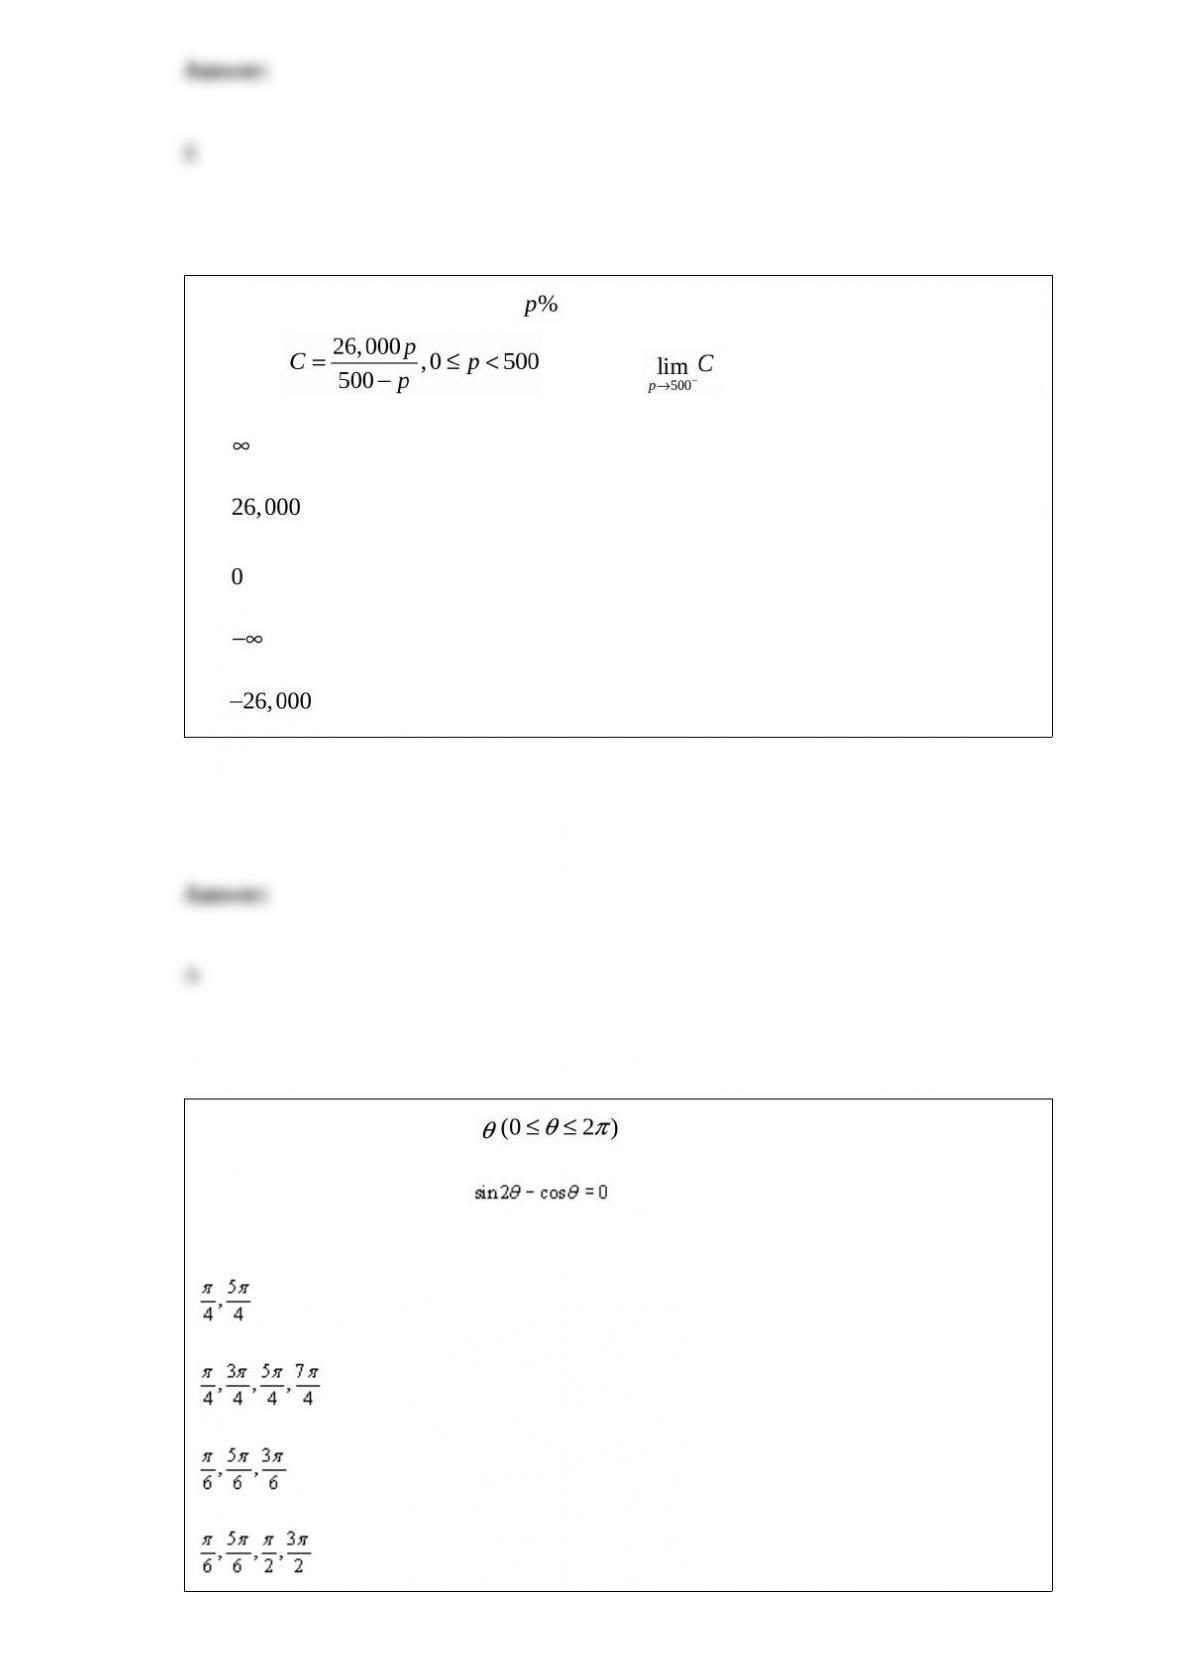
The cost (in dollars) of removing of the pollutants from the water in a small lake is
given by . Evaluate .
A)
B)
C)
D)
E)
Solve the equation below for . For some of the equations you should use
the trigonometric identities listed in this section. Use the trace feature of a graphing
utility to verify your results.
A)
B)
C)
D)
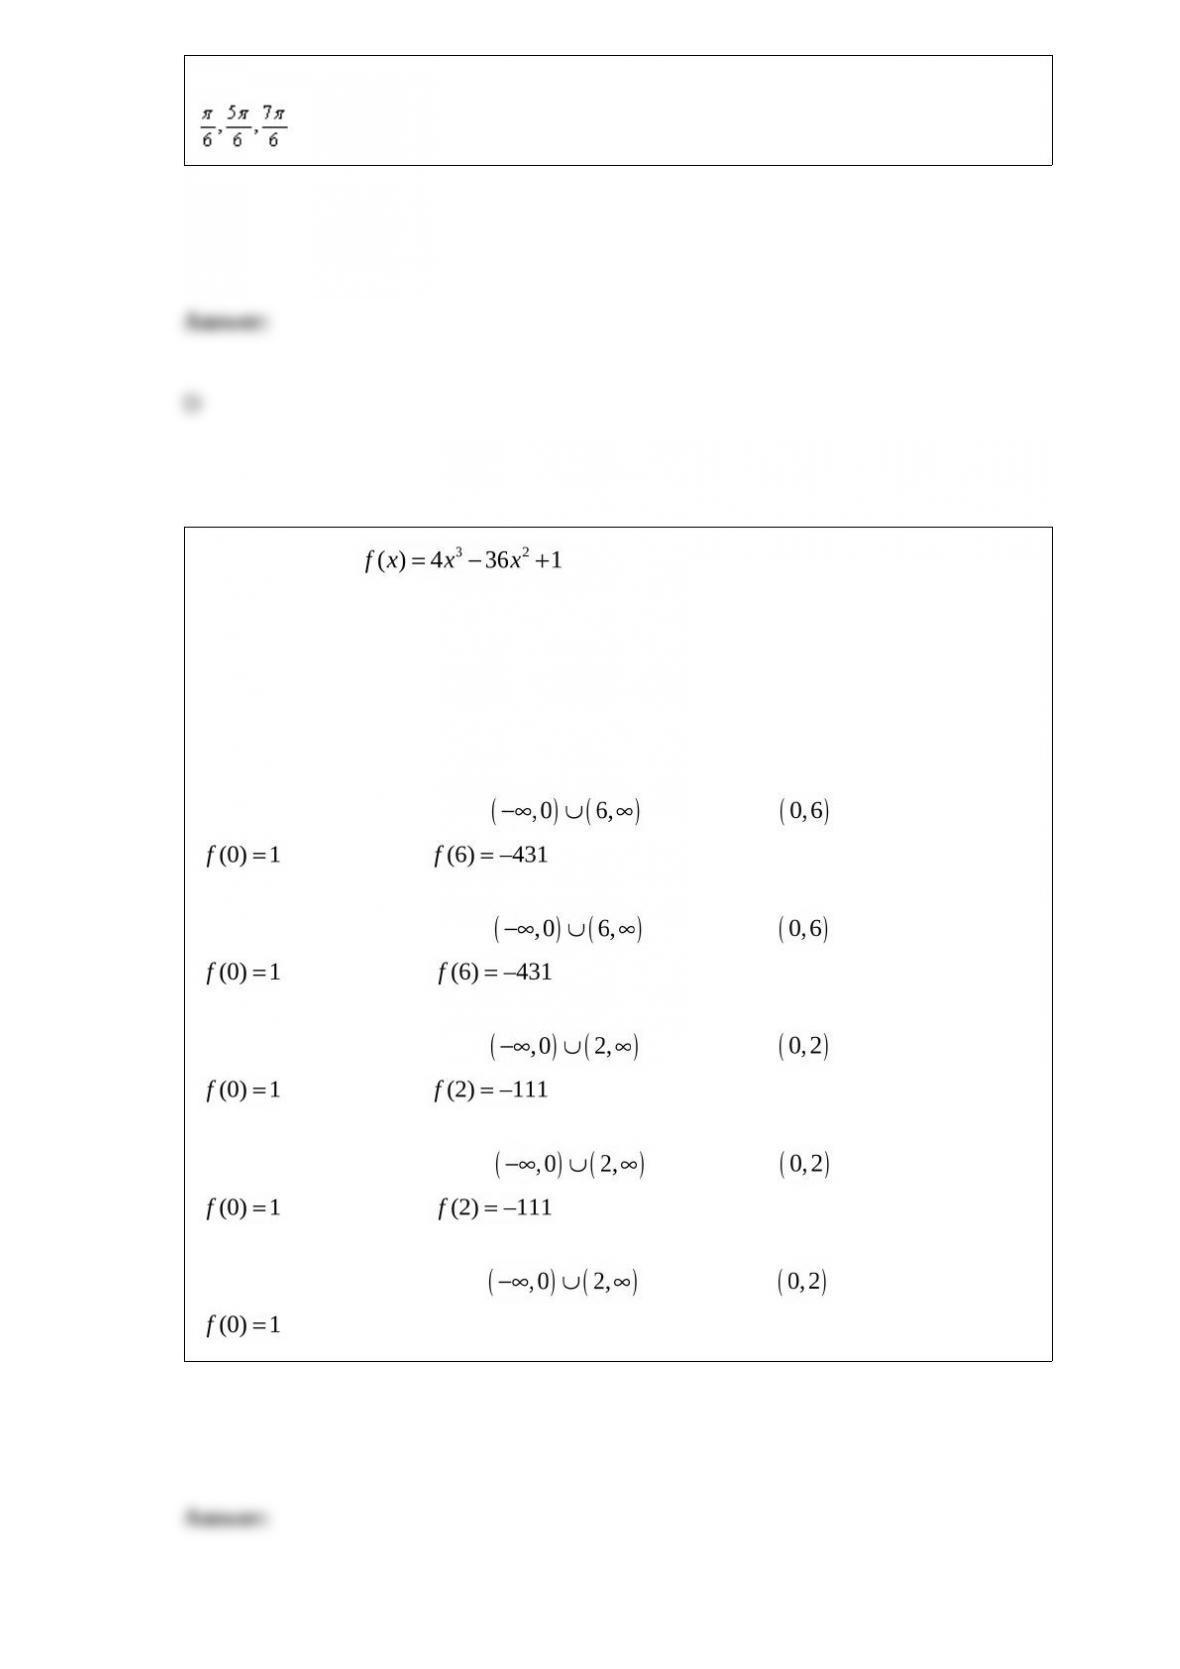
E)
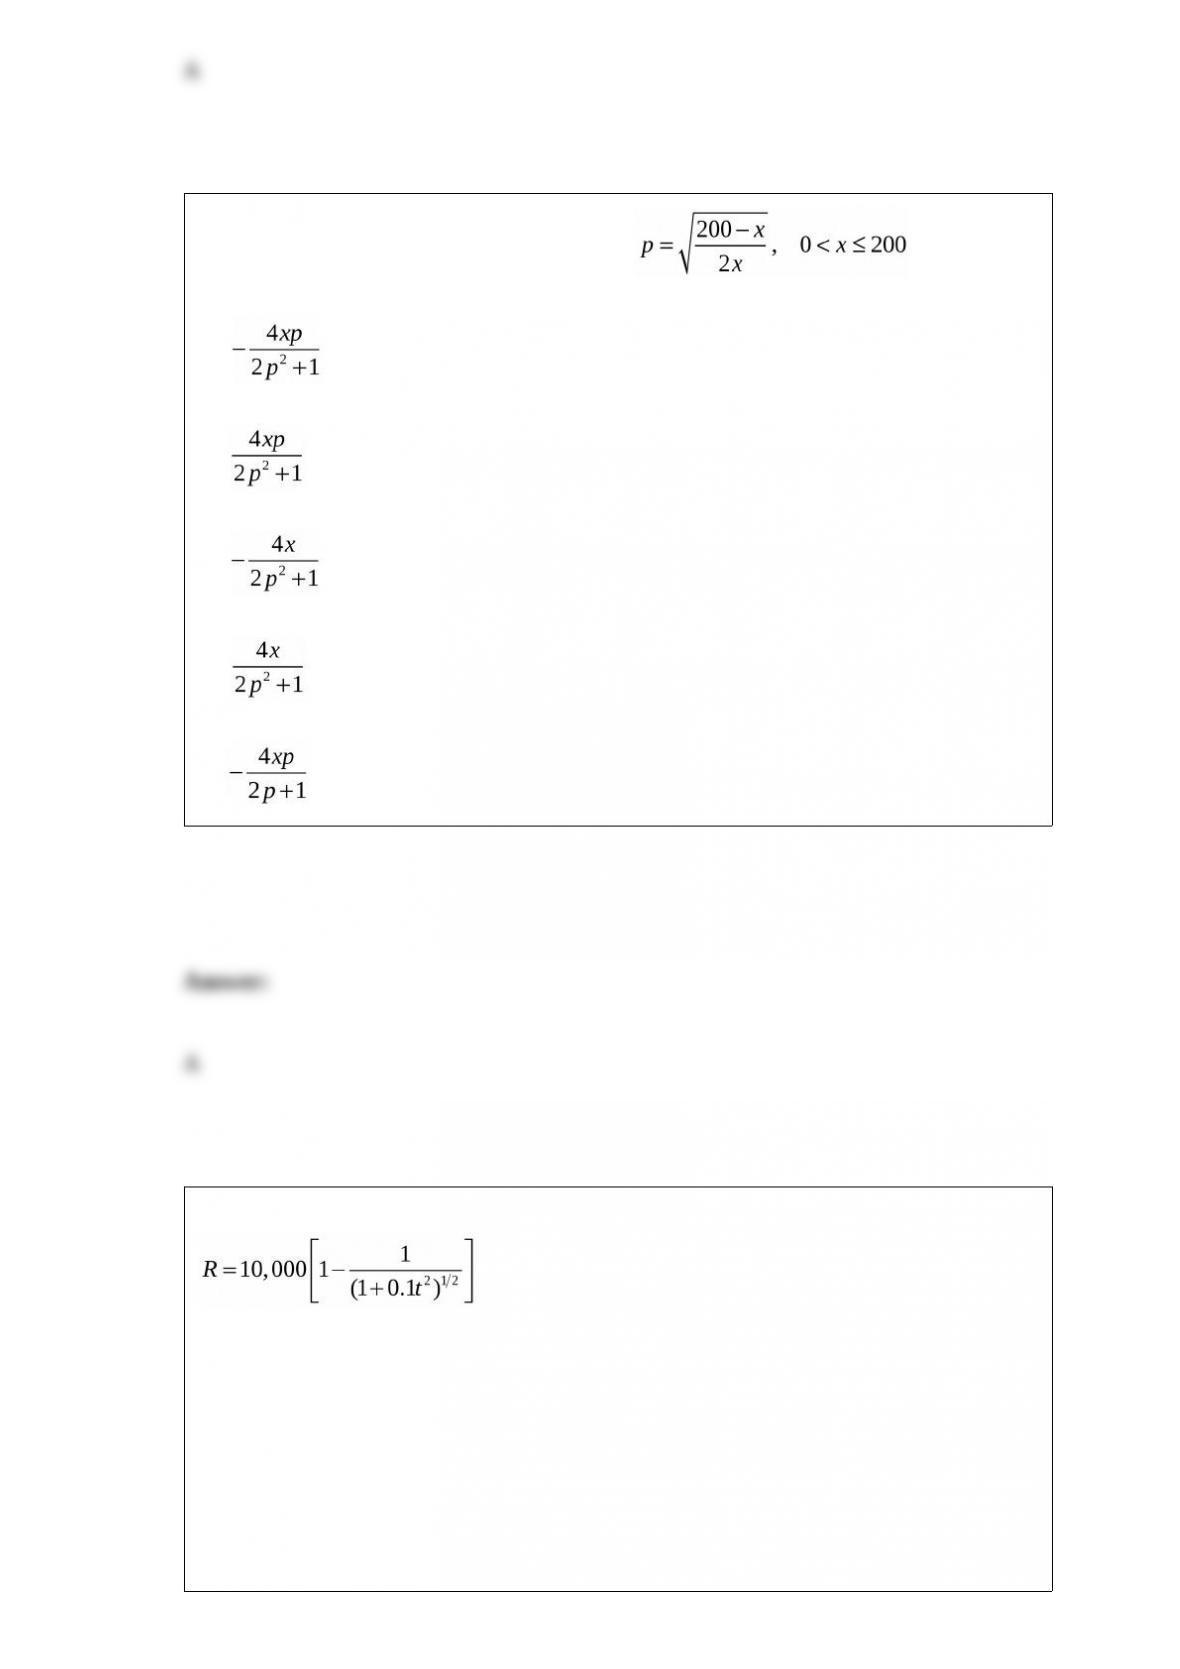
For the function :
(a) Find the critical numbers of f (if any); (b) Find the open intervals where the function
is increasing or decreasing; and (c) Apply the First Derivative Test to identify all
relative extrema.
Then use a graphing utility to confirm your results.
A) (a) x = 0 , 6 (b) increasing: ; decreasing: (c) relative max:
; relative min:
B) (a) x = 0 , 6 (b) decreasing: ; increasing: (c) relative min:
; relative max:
C) (a) x = 0 , 2 (b) increasing: ; decreasing: (c) relative max:
; relative min:
D) (a) x = 0 , 2 (b) decreasing: ; increasing: (c) relative min:
; relative max:
E) (a) x = 0 , 2 (b) increasing: ; decreasing: (c) relative max:
; no relative min.
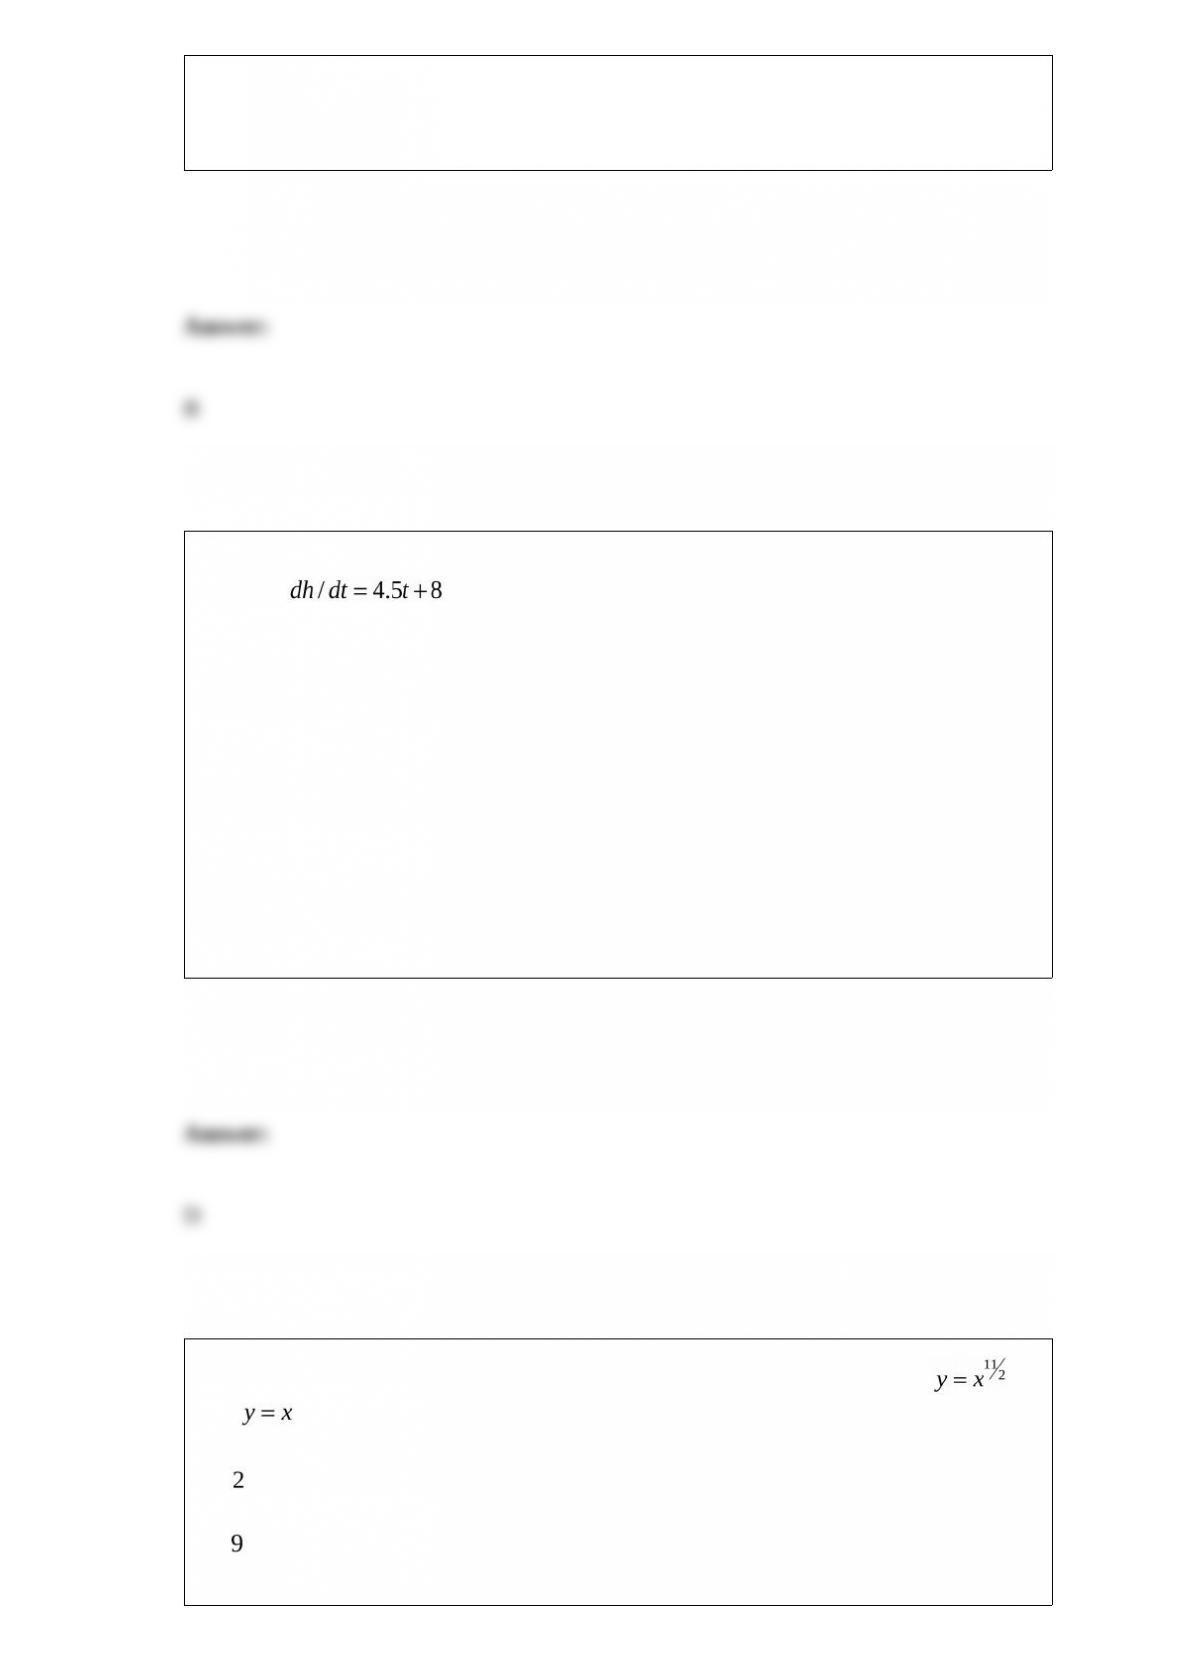
Find the rate of change of x with respect to p.
A)
B)
C)
D)
E)
The revenue (in dollars per year) for a new product is modeled by
where t the time in years. Estimate the total revenue from
sales of the product over its first 3 years on the market. Round your answer to nearest
dollar
A) $6579
B) $3291
C) $10,821
D) $15,830
E) $1138
An evergreen nursery sells a certain shrub after 8 years. The growth rate of the shrub is
given by , where t is the time in years and h is the height in
centimeters. The seedlings are 14 centimeters tall when planted (t = 0). How tall are the
shrubs when they are sold?
A) 166 centimeters
B) 172 centimeters
C) 208 centimeters
D) 222 centimeters
E) 270 centimeters
Use a double integral to find the area of the region bounded by the graphs of
and .
A)
B)
C)
D)
E)
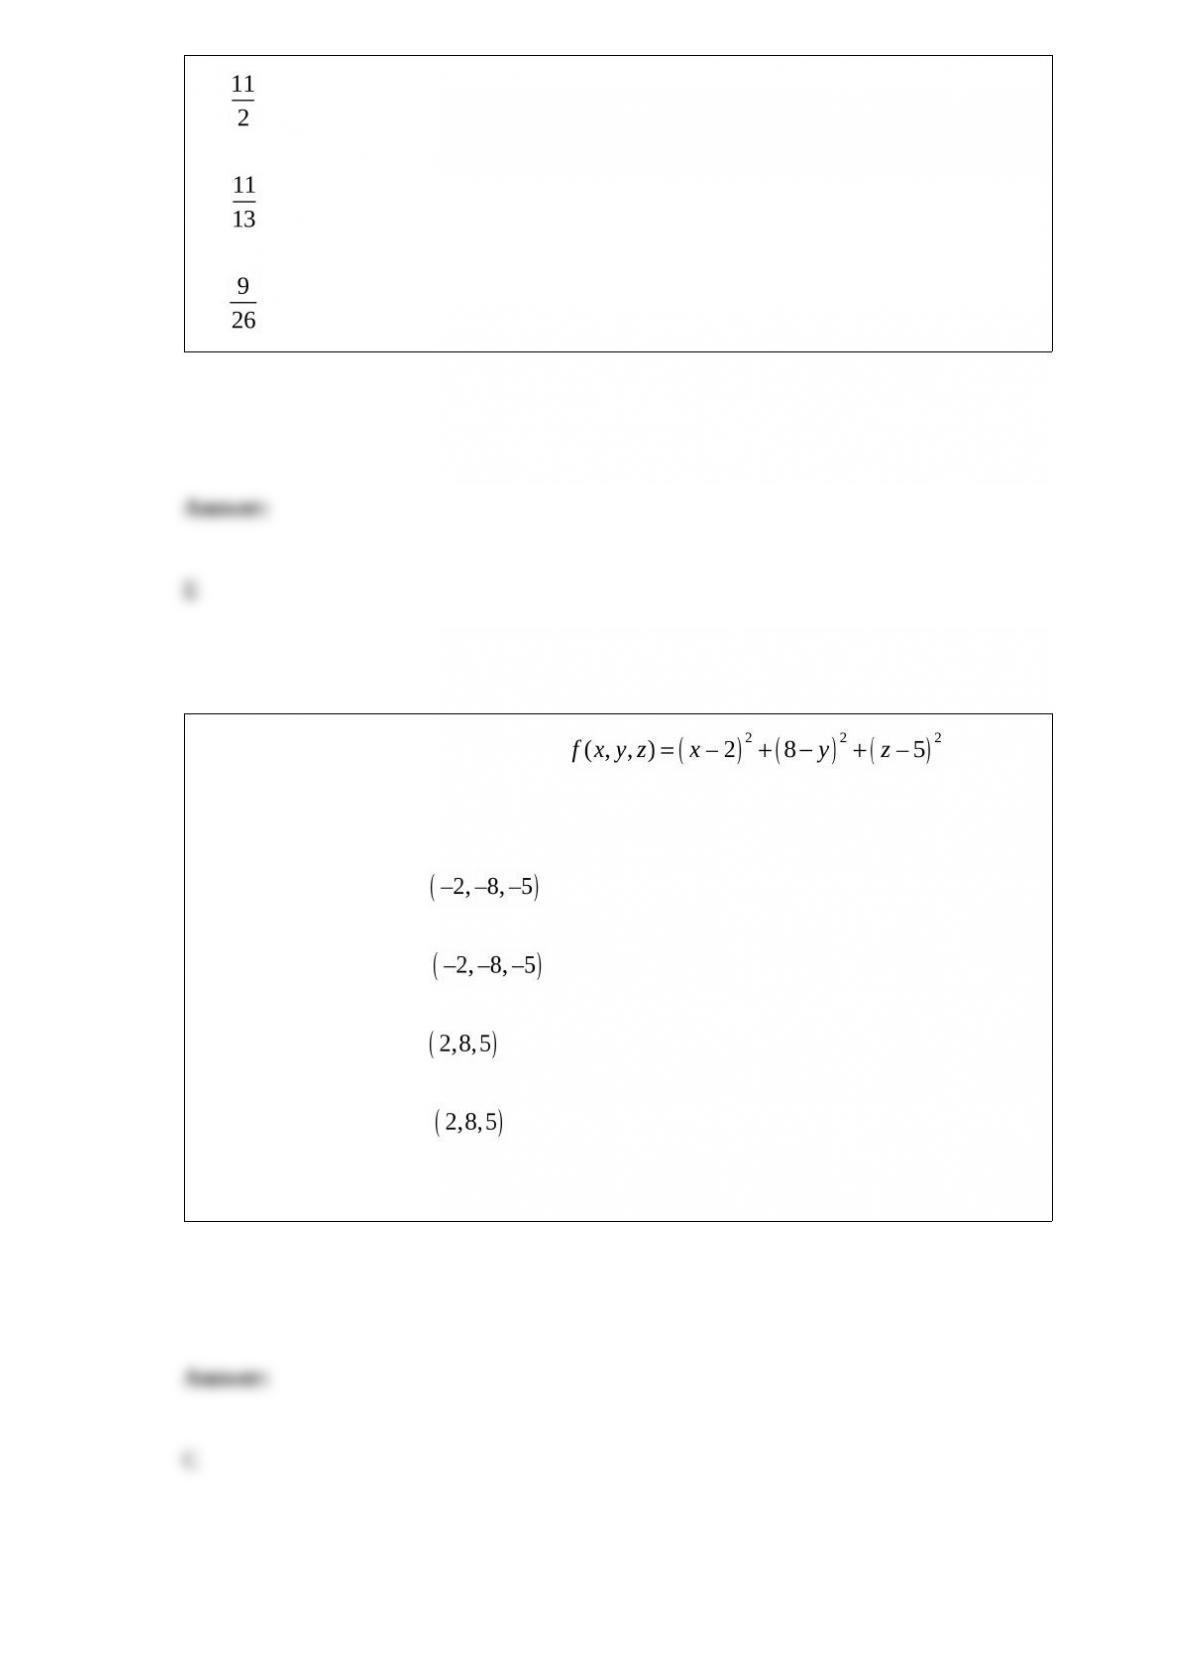
Find the critical points of the function , and,
from the form of the function, determine whether a relative maximum or a relative
minimum occurs at each point.
A) relative minimum at
B) relative maximum at
C) relative minimum at
D) relative maximum at
E) no relative extrema
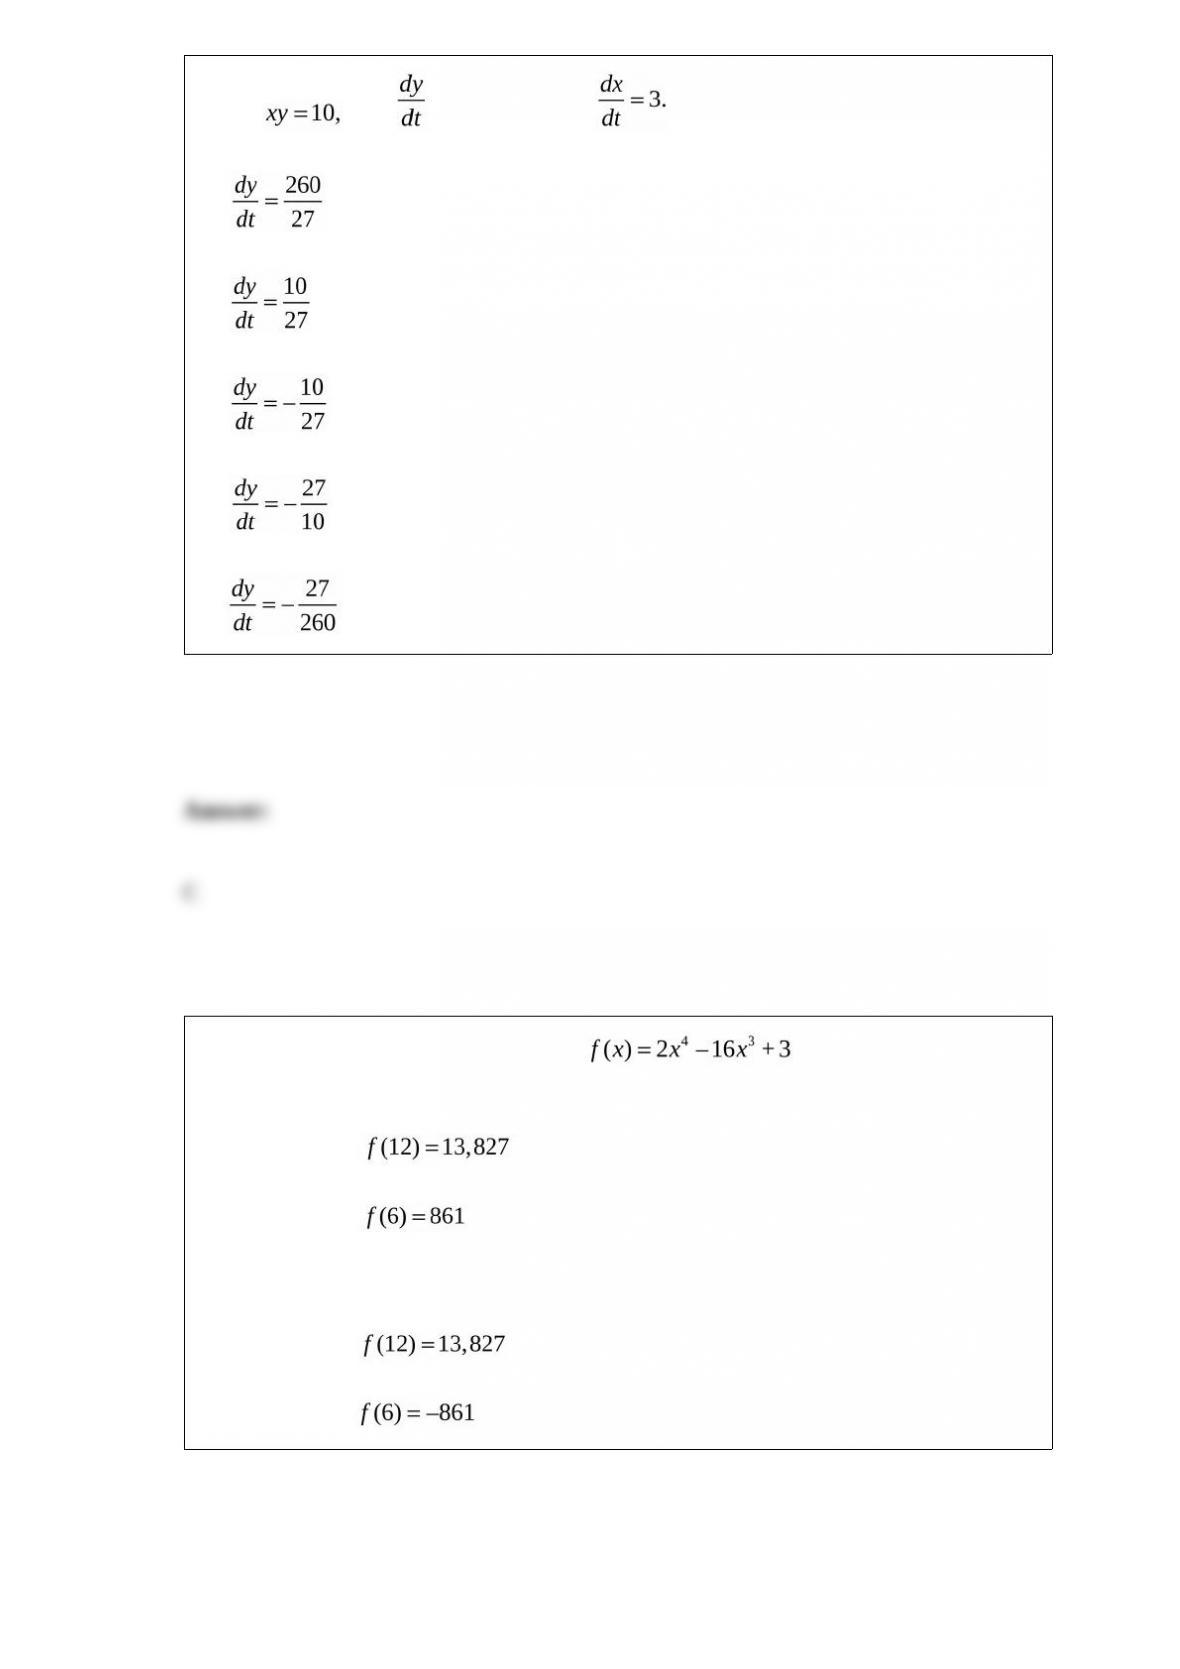
Given find when x = “9 and
A)
B)
C)
D)
E)
Find all relative extrema of the function Use the Second
Derivative Test where applicable.
A) relative max: ; no relative min
B) relative max: ; no relative min
C) no relative max or min
D) relative min: ; no relative max
E) relative min: ; no relative max
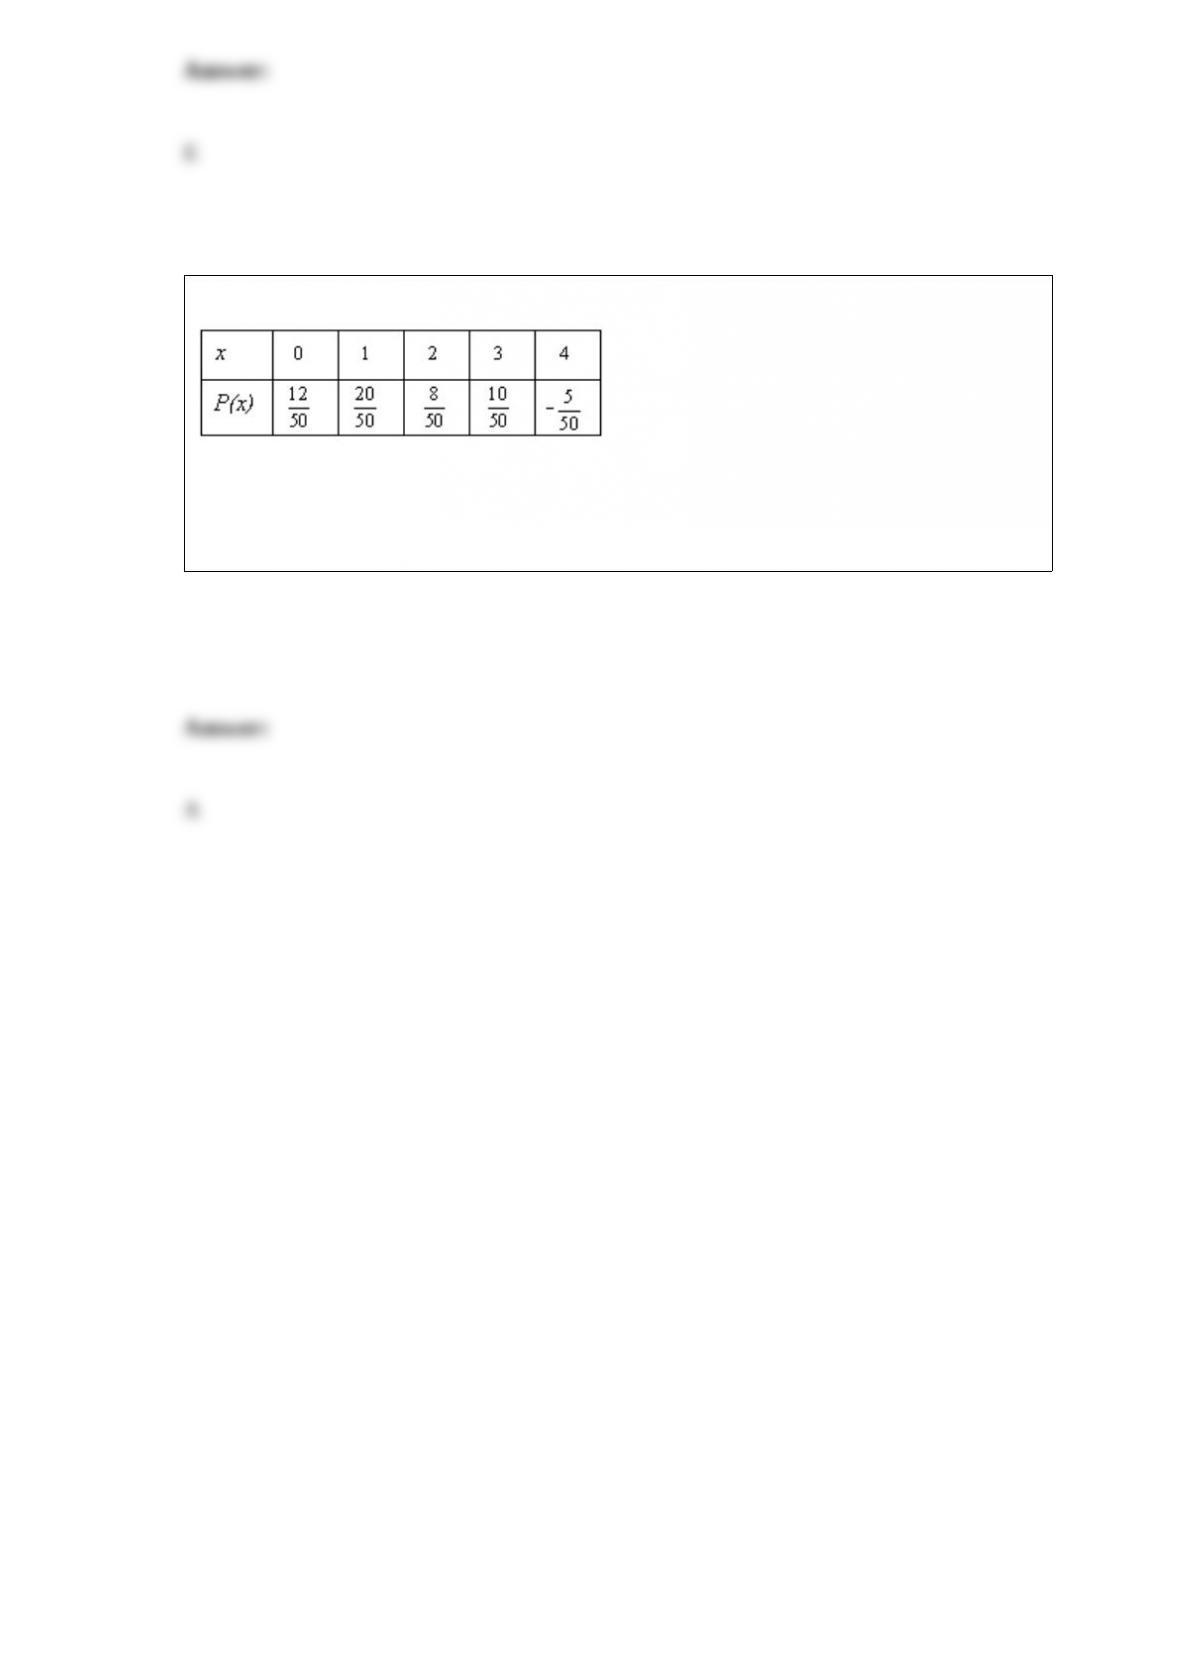
Determine whether the table represents a probability distribution.
A) no
B) yes