238) ________ consists of practices and processes that encourage the use of external as well as
internal ideas as well as internal and external collaboration when conceiving, producing, and
marketing new products and services.
A) Innovation partnership
B) Open innovation
C) Formalized collaboration
D) Piggy-back thinking
E) Stakeholder cooperation
239) Open innovation helps organizations overcome ________, one of the organizational inertias
common in new-product failures.
A) groupthink
B) intelligent failures
C) incomplete protocols
D) NIH barriers
E) bad timing
240) If you are using a marketing dashboard to discover which cities in Florida are not meeting
their sales growth goal for your sunscreen products, which of the following metrics should be
used to measure sales performance?
A) consumer awareness
B) shelf space for this year and last year by city
C) production costs
D) customer psychographics
E) annual percent sales change by city
241) Marketing dashboards are useful in measuring actual market performance versus the goals
set in new-product planning, such as sales. Once shortfalls are identified, the first step would be
to conduct market research to determine
A) how to change the promotional strategy.
B) whether the problem is internal or external to the organization.
C) whether to drop or keep the failing product or market.
D) whether to change the goal, and therefore, the marketing metric used to measure it.
E) if the numbers used for evaluation in the marketing dashboard are accurate.
242) If an organization’s 2018 sales for the entire United States were $50 million and its 2017
U.S. sales were $30 million, what is the annual percentage sales change?
A) 40
B) 67
C) 100
D) 125
E) 133
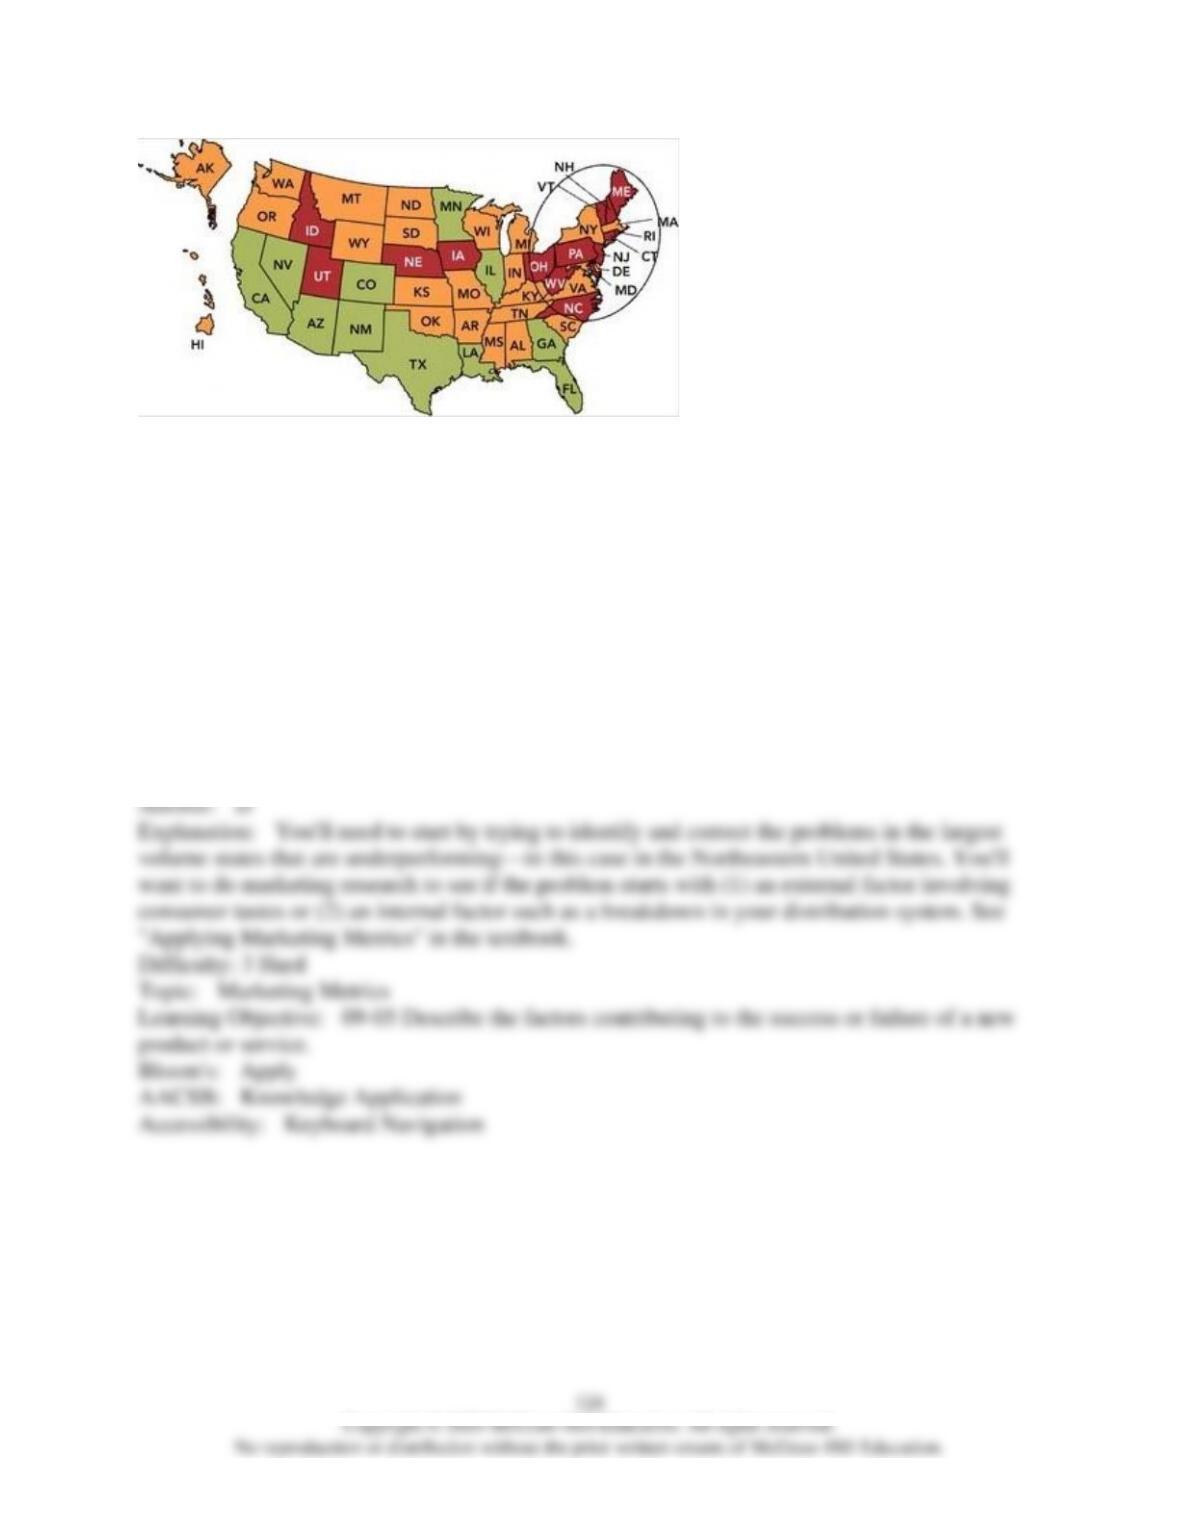
Marketing Dashboard Map
243) In the marketing map above, the annual growth rate in each state is shown. There are 11
“good” states (CA, NV, AZ, NM, CO, TX, LA, MN, IL, GA, and FL) and 15 “bad” states,
meaning very poor states (ID, UT, NE, IA, OH, WV, NC, PA, MD, NJ, CT, RI, VT, NH, and
ME). If you were a marketing manager faced with this dashboard, which of the following would
be the best action?
A) focus on the shortfalls in Idaho and Utah
B) revise the relevant goals for both the East and West Coast
C) conduct additional market research in the Southern United States
D) examine your distribution system in the Northeastern United States
E) change the marketing metric being used to evaluate cities individually
244) The seven stages an organization goes through to identify business opportunities and
convert them into salable products or services is referred to as the
A) commercialization process.
B) SWOT process.
C) business prospect development cycle.
D) opportunity stage gate sequence.
E) new-product development process.
245) The new-product development process is
A) the informal process of brainstorming to generate new-product concepts at a marketing staff
meeting.
B) the process of presenting cross-functional teams with a written new-product concept
statement and asking them to respond to it in writing.
C) the seven stages an organization goes through to identify business opportunities and convert
them into salable products or services.
D) the two stages an organization goes through from idea generation to commercialization.
E) a formalized protocol for new-product development that begins at the corporate level and ends
at the functional level.
246) The new-product development process an organization goes through to identify business
opportunities and convert them into salable products or services contains
A) three main steps: research, production, and distribution.
B) four distinct steps: research, evaluation, production, and distribution.
C) five key phases ranging from idea generation to creating the first prototype.
D) seven stages from new-product strategy development to commercialization.
E) three phases: planning, implementation, and evaluation.
247) There are seven stages of the new-product development process. The stage of the new-
product development process that defines the role for a new product in terms of the firm’s overall
objectives is the ________ stage.
A) idea generation
B) screening and evaluation
C) screening and analysis
D) new-product strategy development
E) product assessment

248) There are seven stages of the new-product development process. Following the new-
product strategy development stage is the second step, known as
A) idea generation.
B) screening and evaluation.
C) screening and analysis.
D) new-product tactic development.
E) product assessment.
249) There are seven stages of the new-product development process. Stage 3 follows idea
generation; it is the ________ stage.
A) tactic generation
B) screening and evaluation
C) screening and analysis
D) new-product strategy development
E) product assessment
250) There are seven stages of the new-product development process. After screening and
evaluation is stage 4, the ________ stage.
A) tactic generation
B) creative direction
C) business analysis
D) new-product strategy development
E) market testing
251) There are seven stages of the new-product development process. Stage 5 is the ________
stage.
A) business analysis
B) screening and evaluation
C) market testing
D) commercialization
E) development
252) There are seven stages of the new-product development process. Right before
commercialization is stage 6, which is the ________ stage.
A) business analysis
B) screening and evaluation
C) market testing
D) pre-launch
E) development
253) There are seven stages of the new-product development process. The last stage is
A) business analysis.
B) screening and evaluation.
C) market testing.
D) commercialization.
E) development.
254) One reason new products fail is that although most major corporations use a formal
decision making process, sometimes they fail to critically evaluate the progress along the way.
This is why many firms have a ________ to ensure that problems are corrected before
proceeding to the next stage.
A) written protocol
B) Stage-Gate process
C) cross-functional team
D) prototype test
E) test market
255) The stage of the new-product development process that defines the role for a new product in
terms of the firm’s overall objectives is referred to as
A) distinctive competency determination.
B) new-product strategy development.
C) strategic marketing process.
D) strategic invention process.
E) product protocol definition.
256) New-product strategy development is
A) the stage of the new-product development process where specific product features and
benefits are selected prior creating a new-product prototype.
B) a formalized protocol for new-product development determined by the director of marketing.
C) the stage of the new-product development process that defines the role for a new product in
terms of the firm’s overall objectives.
D) the process of presenting cross-functional teams with a written new-product concept
statement and asking them to respond to it in writing.
E) the stage of the new-product development process that turns the idea on paper into a
prototype, which results in a demonstrable, producible product corresponding to its protocol.
257) In which stage of the new-product development process is a SWOT analysis used to
identify the strategic role the new product might serve in the firm’s business portfolio?
A) idea generation
B) screening and evaluation
C) business analysis
D) development
E) new-product strategy development
258) During the first stage of the new-product development process, two important activities take
place. They are
A) a SWOT analysis and environmental scanning.
B) open innovation and business analysis.
C) concept testing and product forecasting.
D) R&D and operations setup.
E) environmental scanning and open innovation.
259) In which stage of the new-product development process would a firm use both a SWOT
analysis and environmental scanning to develop a new-product protocol and identify its strategic
role for the firm?
A) idea generation
B) screening and evaluation
C) new-product strategy development
D) business analysis
E) development
260) Occasionally, a firm’s Stage 1 product development activities can be blind-sided by a
revolutionary new product or technology that completely disrupts its business, which is
sometimes called a
A) marketing opportunity.
B) disruptive innovation.
C) business threat.
D) crowdsourcing.
E) concept test.
261) Developing a pool of concepts to serve as candidates for new products is the ________
stage of the new-product process.
A) open innovation
B) screening and evaluation
C) product development
D) new-product strategy development
E) idea generation
262) Idea generation is the stage in the new-product development process that
A) develops a pool of concepts to serve as candidates for new products.
B) selects a single concept and scrutinizes it for all potential benefits and flaws.
C) separates ideas into two categories: consumer-oriented and organization-oriented.
D) requires the organization to perform a SWOT analysis and an environmental scan.
E) consists of the techniques used to screen and reject those ideas that have no merit.
263) Open innovation may enhance the ________ stage of the new-product development
process.
A) internal collaboration
B) screening and evaluation
C) product development
D) new-product strategy development
E) idea generation
264) All of the following are sources for new-product ideas except which?
A) competitors
B) universities
C) regulators
D) crowdsourcing
E) employees
265) Business researchers emphasize that firms must actively involve customers and suppliers in
the new-product development process. This means that the focus should be on what the new
product will ________ rather than simply what they want.
A) look like
B) cost them
C) do for them
D) feel like
E) consist of in terms of new features
266) Generating insights leading to marketing actions based on massive numbers of people’s
ideas is called
A) brainstorming.
B) groupthink.
C) outsourcing.
D) crowdsourcing.
E) NIH method.
267) Dell used ________ to develop an online site to generate 13,464 ideas for new products as
well as website and marketing improvements.
A) brainstorming
B) crowdsourcing
C) group think
D) outsourcing
E) data mining
268) IDEO is a company that
A) creates innovative promotional programs for its clients’ new products.
B) developed the formal Stage-Gate process to commercialize new products for its clients.
C) uses “design thinking” to develop new products for other organizations.
D) rates new products like Consumer Reports.
E) runs patent searches for companies that don’t have an internal legal department.
269) Which of the following is an IDEO design?
A) Crest Neat Squeeze toothpaste dispenser
B) Under ArmourSpeedForm Gemini 2 smart shoe
C) 3M Post-it Notes
D) Pampers Swaddlers diapers
E) Apple iPod
270) In addition to seeking ideas from more well-known sources, organizations also get ideas
from universities, inventors, and smaller nontraditional firms. For example, General Mills
partnered with Brigham Young University to license its patent for
A) scones with coffee-flavored cream frosting.
B) an Omega-3 enriched SKU for the Philadelphia cream cheese line.
C) a carbonated yogurt called Go-Gurt Fizzix.
D) deep fried chicken skins for people who cannot eat pork.
E) a crispy baked macaroni and cheese snack that can be eaten out of a bag like Cheetos.
271) Imagine you work for a TV production company that has been approached by one of the
broadcast TV networks to develop a concept for a new reality show. Where are you most likely
to look first for ideas?
A) Conduct a survey among the 2 million people belonging to the NPD Consumer Panel.
B) Observe similar reality programs that are on competing television networks.
C) Contact contestants from other reality shows such as Survivor or The Amazing Race.
D) Brainstorm ideas from the TV production company’s employees.
E) Read about the stars of reality TV programs in gossip magazines such as Us Weekly and TV
programs like TMZ.
272) Because early-stage financing is almost always a problem for those starting a new business,
________ is a way to gather an online community of supporters to financially rally around a
specific project that is unlikely to get resources from traditional sources.
A) crowdfunding
B) open sourcing
C) venture capital
D) online banking
E) crowdsourcing
273) Which of the following firms uses crowdfunding to raise capital for products that are
unlikely to get resources from traditional sources?
A) IDEO
B) Kickstarter.com
C) Warren Buffett’s Berkshire Hathaway
D) the Industrial Design Group
E) Unfundable.com
274) The stage of the new-product process that internally and externally evaluates new-product
ideas to eliminate those that warrant no further effort is referred to as
A) development.
B) Stage-Gate.
C) idea generation.
D) business analysis.
E) screening and evaluation.
275) Screening and evaluation is the stage of the new-product development process
A) at which prospective customers are exposed to new-product prototypes for the first time.
B) at which new-product concepts that have been found viable are converted into actual
prototypes.
C) that internally and externally assesses new-product ideas to eliminate those that warrant no
further effort.
D) that specifies the features of the product and the marketing strategy needed to bring it to
market and make financial projections.
E) where consumers evaluate a new product’s performance in an actual-use situation.