Introduction to Operations and Supply Chain Management, 4e (Bozarth/Handfield)
Chapter 9 Forecasting
Learning Objective 9-1
1) A video game publishing company needs to predict the total sales in the European market for
the next year. This is an example of a(n):
A) firm-level demand forecast.
B) overall market demand forecast.
C) supply forecast.
D) price forecast.
Learning Objective 9-2
1) Forecasts are almost always wrong.
2) Fed up with her working conditions at the call center, Lisa decides to invest in a state-of-the-
art sewing machine and produce limited quantities of her own clothing designs. After a few
months of operation, she decides to apply some of the forecasting techniques she mastered in
school. Which of these statements about her forecasts is correct?
A) Her forecasts will probably be 100% accurate.
B) Her demand forecasts for a year from now will probably be more accurate than her demand
forecasts for three months from now.
C) Her demand forecasts for each style of skirt will be more accurate than her demand forecasts
for all skirts.
D) The best way for her to determine the amount of fabric she needs is to forecast it based on her
customer orders for each type of skirt.
3) What are the laws of forecasting and what are their implications for operations and supply
chain managers?
Learning Objective 9-3
1) Qualitative forecasts are used when there is plenty of relevant data.
Learning Objective 9-4
1) The Delphi method, panel consensus forecasting, and market surveys are all qualitative
forecasting methods, but only market surveys do NOT use experts.
2) A qualitative forecasting technique well-suited for demand forecasts of a new product or
service is the:
A) Delphi method.
B) build-up forecast.
C) life cycle analogy method.
D) market survey.
3) A qualitative forecasting technique in which individuals familiar with specific market
segments estimate the demand within these sectors that are then summed to get an overall
forecast is called a:
A) market survey.
B) life cycle analogy.
C) panel consensus forecasting.
D) build-up forecast.
4) The panel consensus forecasting approach requires that the forecasting team discuss their
forecast as a team but the ________ requires that each member of the team develop a separate
forecast initially.
5) Describe the mechanics of three qualitative forecasting techniques and compare their strengths
and weaknesses.
Learning Objective 9-5
1) Over the long run, fluctuations in demand due to seasonality are greater than those due to
randomness.
2) A seasonal pattern in time series data is evident when the level of the variable of interest
moves erratically up or down from one period to the next.
3) The greater the randomness in the model, the greater the number of periods should be used in
a moving average forecast.
4) Exponential smoothing with an alpha of one will yield identical results to a last period
forecast.
5) When there is a significant upward or downward trend in the data, the two best forecasting
models are adjusted exponential smoothing and linear regression.
6) The independent variable is the quantity the forecaster is interested in estimating with a linear
regression model.
7) A seasonal index less than 1.0 means that the model is overforecasted.
8) The slope of the regression equation is positive if the r-squared value is greater than 0.0.
9) A long-term movement up or down in a time series is called:
A) seasonality.
B) trend.
C) randomness.
D) cycle.
10) A firm’s demand data from the last two quarter is displayed in the table. Use a three period
moving average to forecast demand for July.
Month
Demand
January
154
February
148
March
214
April
180
May
225
June
246
A) 206
B) 217
C) 223
D) 226
11) A firm’s demand data from the last two quarter is displayed in the table. Use a three period
weighted moving average with Wt = 0.7, Wt-1 = 0.2, and Wt-2 = 0.1 to forecast demand for
July.
Month
Demand
January
154
February
148
March
214
April
180
May
225
June
246
A) 235.2
B) 195.6
C) 158.8
D) 180.4
12) Heidi favors using a two period moving average but Tim is “an exponential-smoothing man.”
Tim’s demand forecast for May was identical to Heidi’s. What value of alpha would Tim need to
use in order for his June forecast to be identical to Heidi’s if each sticks with their preferred
technique?
Month
Demand
January
154
February
148
March
214
April
180
May
225
June
246
A) .085
B) .196
C) .237
D) .348
13) A drive-in restaurant has experienced the following customer loads on the past 8 Friday
nights. If their forecast for period 7 was 59 customers, then what is their forecast for period
number 8 using a smoothing constant of 0.7?
Friday
# Customers
1
49
2
55
3
57
4
59
5
56
6
61
7
62
8
63
A) 61.10
B) 62.43
C) 59.90
D) 60.83
14) A counseling service records the number of calls to their hotline for the last year. What is the
forecast for July if the service uses a simple moving average of three periods?
Month
Demand
January
111
February
127
March
146
April
159
May
165
June
165
July
178
August
182
September
191
October
208
November
223
December
228
A) 169
B) 163
C) 157
D) 178
15) A counseling service records the number of calls to their hotline for the last year. What is the
forecast for August if the forecast for June was 164 and the service uses exponential smoothing
with an alpha of 0.8?
Month
Demand
January
111
February
127
March
146
April
159
May
165
June
165
July
178
August
182
September
191
October
208
November
223
December
228
A) 164.80
B) 188.93
C) 180.67
D) 175.36
16) A counseling service records the number of calls to their hotline for the last year. What is the
forecast for August if a regression equation is used to model this data?
Month
Demand
January
111
February
127
March
146
April
159
May
165
June
165
July
178
August
182
September
191
October
208
November
223
December
228
A) 188.3
B) 179.9
C) 180.6
D) 175.7
17) A counseling service records the number of calls to their hotline for the last year. What is the
forecast for October if a weighted moving average with weights of 0.5, 0.3, and 0.2 is used to
model this data?
Month
Demand
January
111
February
127
March
146
April
159
May
165
June
165
July
178
August
182
September
191
October
208
November
223
December
228
A) 177.4
B) 185.7
C) 197.7
D) 190.3
18) A counseling service records the number of calls to their hotline for the last year. What is the
forecast for March if an adjusted exponential smoothing model is used with α=0.8 and β=0.7?
The unadjusted forecast for January is 123.5.
Month
Demand
January
111
February
127
March
146
April
159
May
165
June
165
July
178
August
182
September
191
October
208
November
223
December
228
A) 135.44
B) 138.53
C) 132.76
D) 144.34
19) A company keeps track of unit sales and notes a strong trend during the past eight periods.
They use an adjusted exponential smoothing model with an alpha equal to 0.7 and a beta equal to
0.6. Using the demand data and previous forecasts shown in the table, develop a forecast for
period 4.
Week
# Units
Unadjusted
Forecast
Trend
Adjusted
Forecast
1
68
65.0
0.0
65.0
2
72
67.1
1.3
68.4
3
80
4
93
5
108
6
121
7
125
8
139
A) 82.2
B) 84.9
C) 87.5
D) 91.6
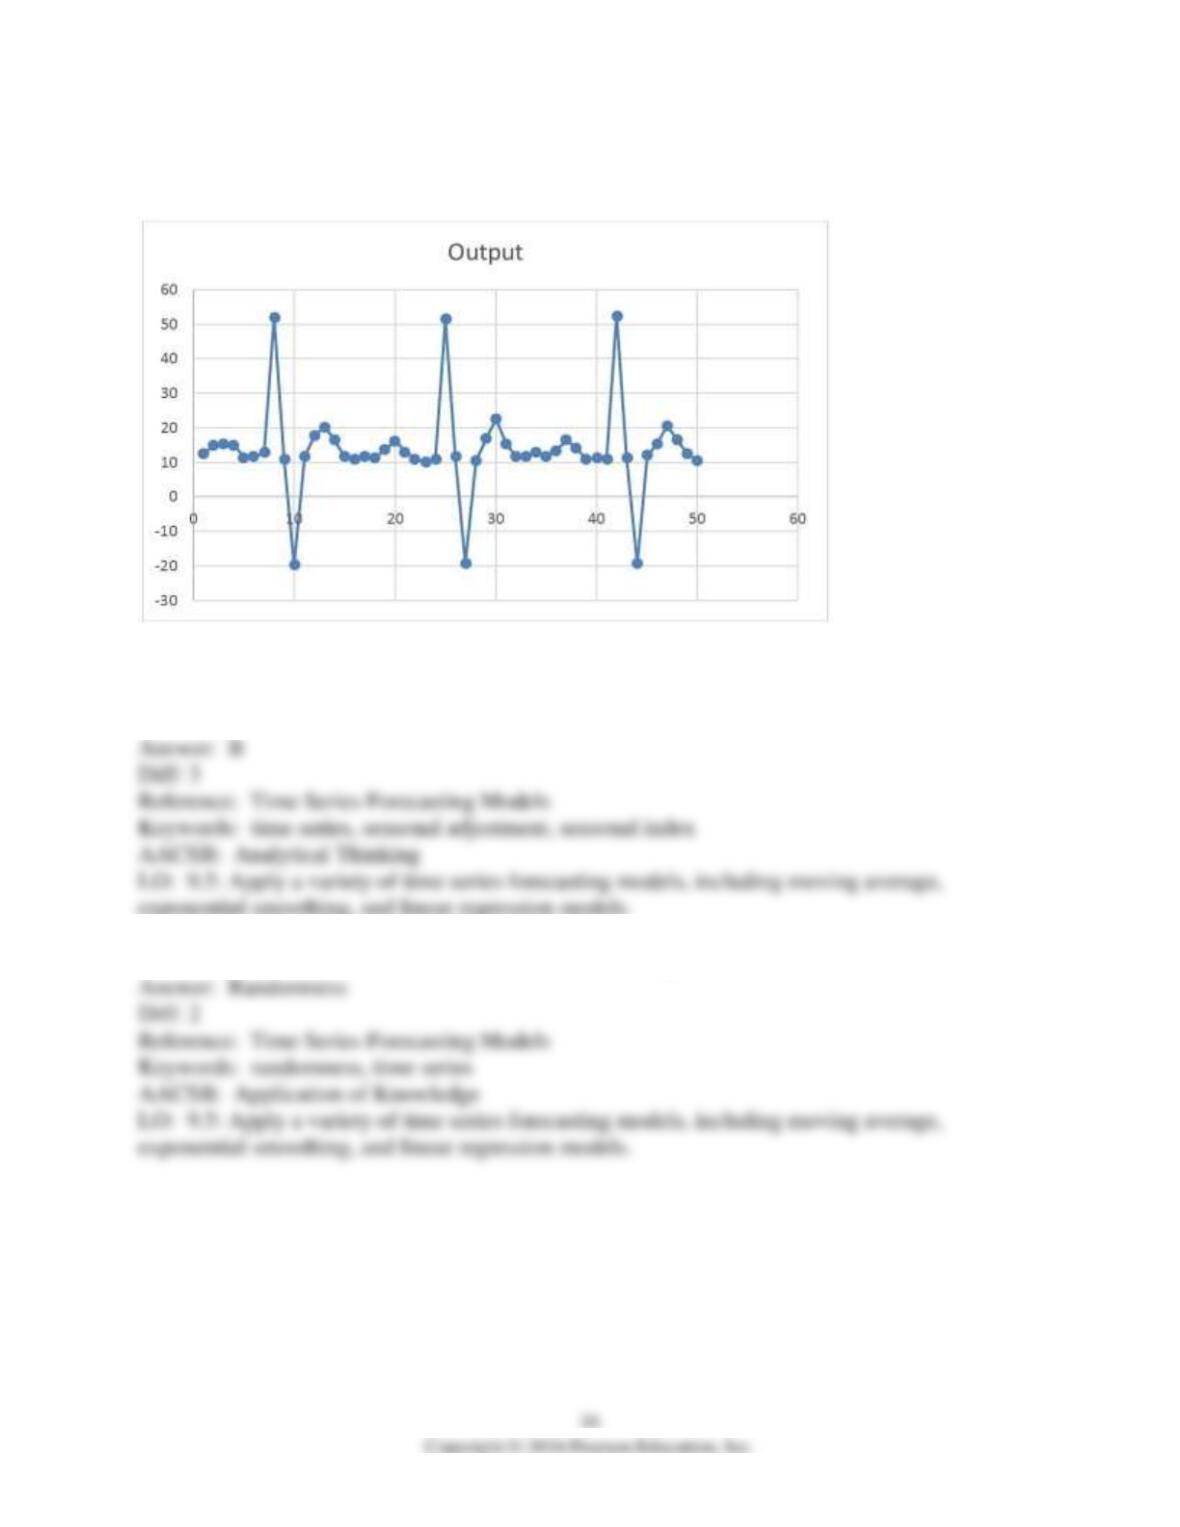
20) Consider the data that generate this plot covering time months 1 to 50. What characteristic is
most prominent in the pattern?
A) trend
B) seasonality
C) randomness
D) none
21) ________ is unpredictable movement from one time period to the next.
22) Two smoothing models that yield identical forecasts are exponential smoothing with an
alpha equal to ________ and a moving average with n equal to ________.
23) The greater the randomness in the data, the ________ the value of the alpha should be in an
exponential smoothing forecast.
24) Two time series techniques that are appropriate when the data display a strong upward or
downward trend are ________ and ________.
25) Dividing actual demand by the model’s forecast yields an index that can be used to adjust for
________ in the data.
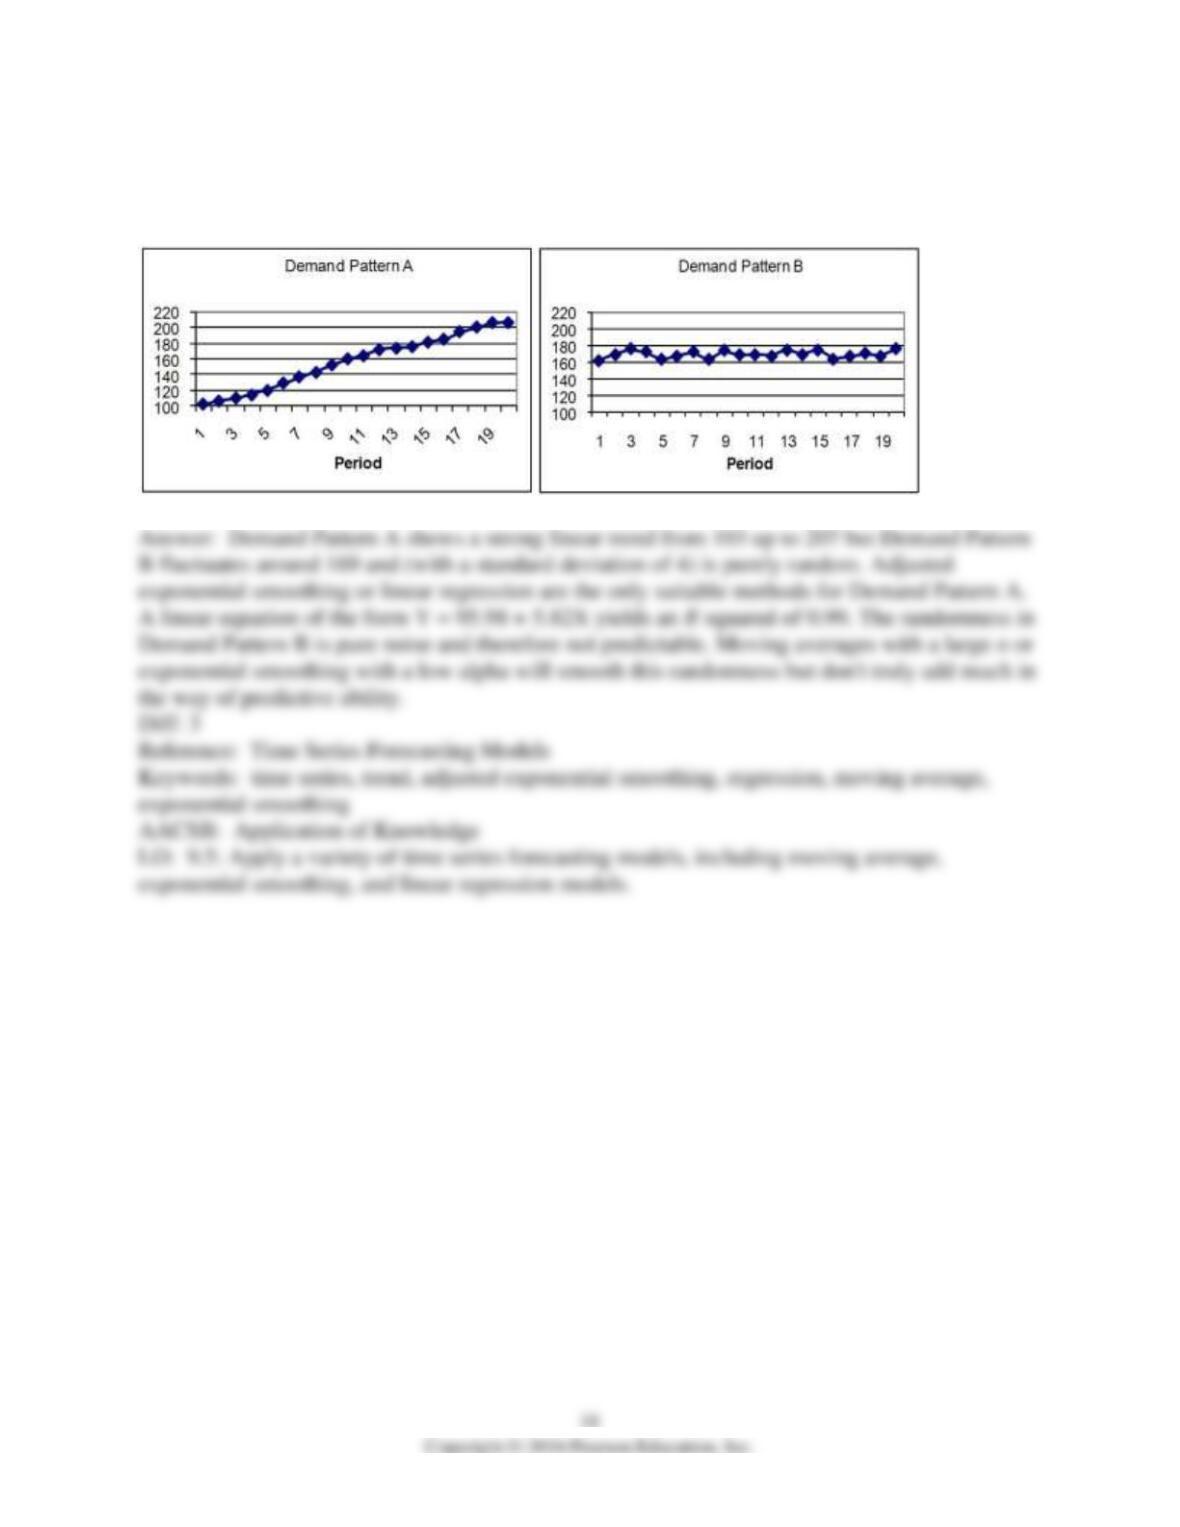
26) Examine these two graphs and based on the demand pattern and axis scaling, recommend a
forecasting technique (and the required parameters) that would work best for each one. Justify
your recommendations.
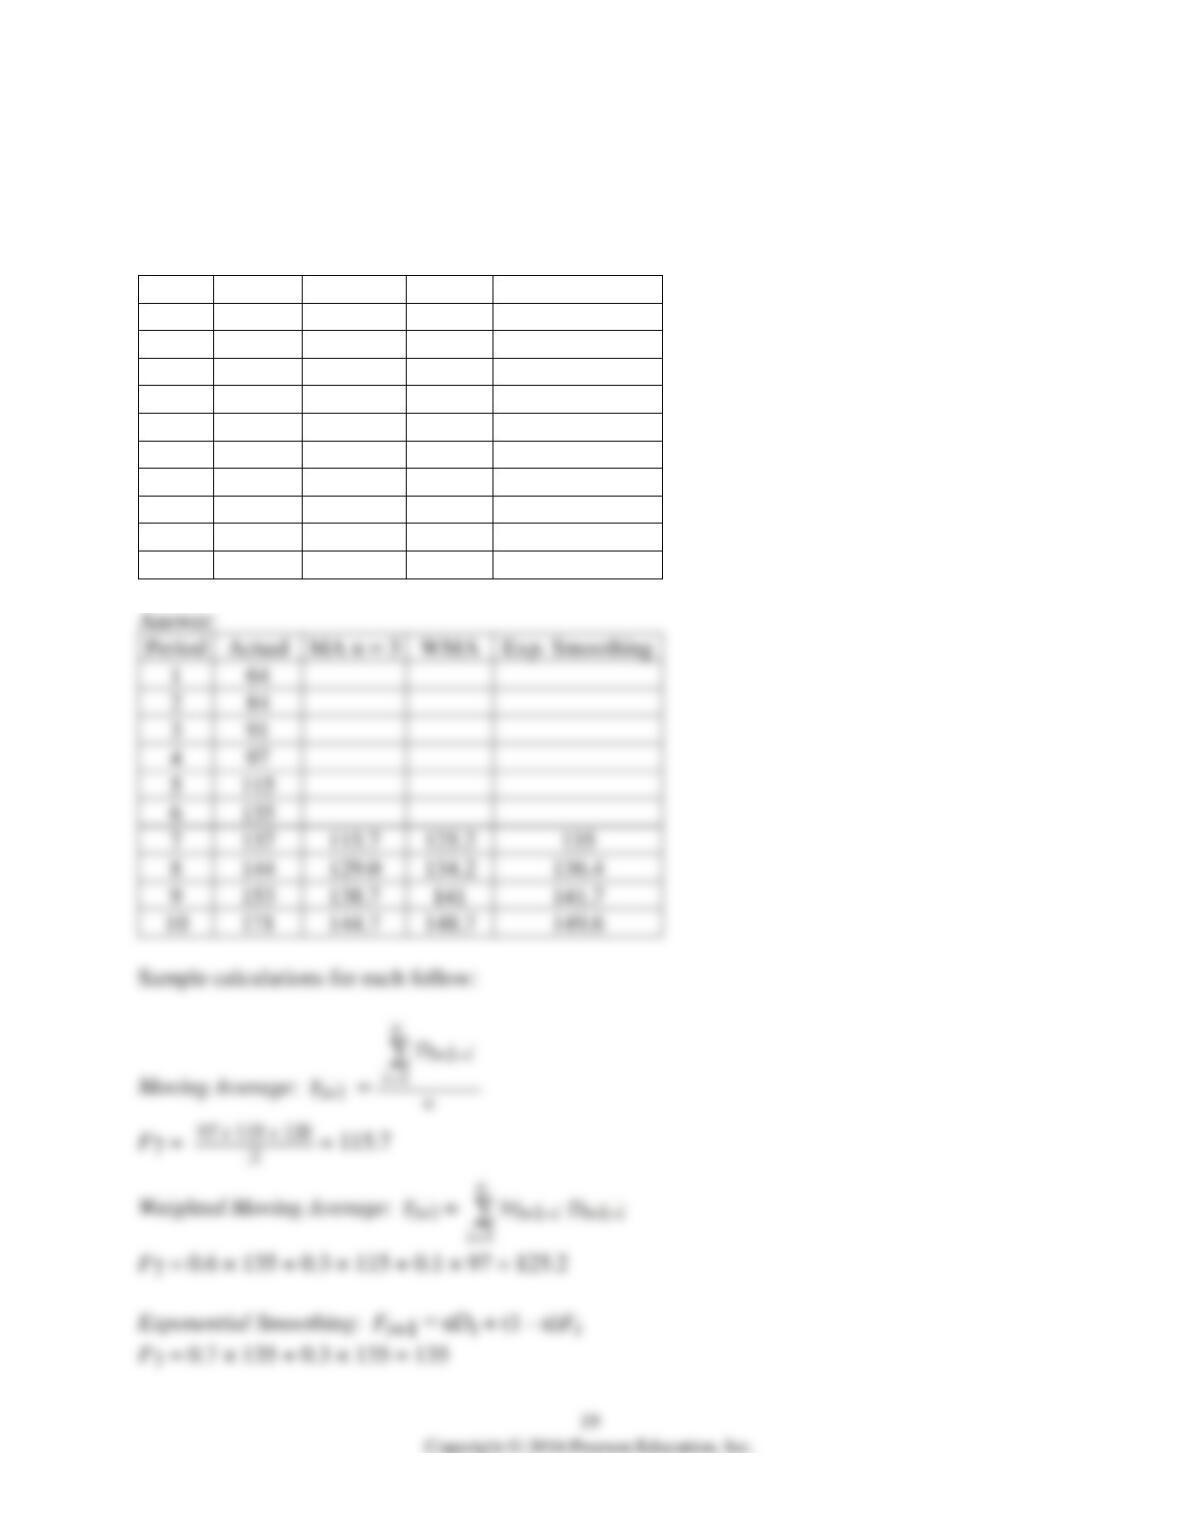
27) Develop forecasts for periods 7 through 10 for the demand data in the table using a three
period moving average, a weighted moving average using 0.6, 0.3, and 0.1, and exponential
smoothing with alpha = 0.7. Use a 6th period forecast of 135 as the starting point for the
exponential smoothing technique.
Period
Actual
MA n = 3
WMA
Exp. Smoothing
1
64
2
84
3
91
4
97
5
115
6
135
7
137
8
144
9
153
10
171
Period
Actual
MA n = 3
WMA
Exp. Smoothing
1
64
2
84
3
91
4
97
5
115
6
135
7
137
115.7
8
144
129.0
9
153
138.7
141
10
171
144.7
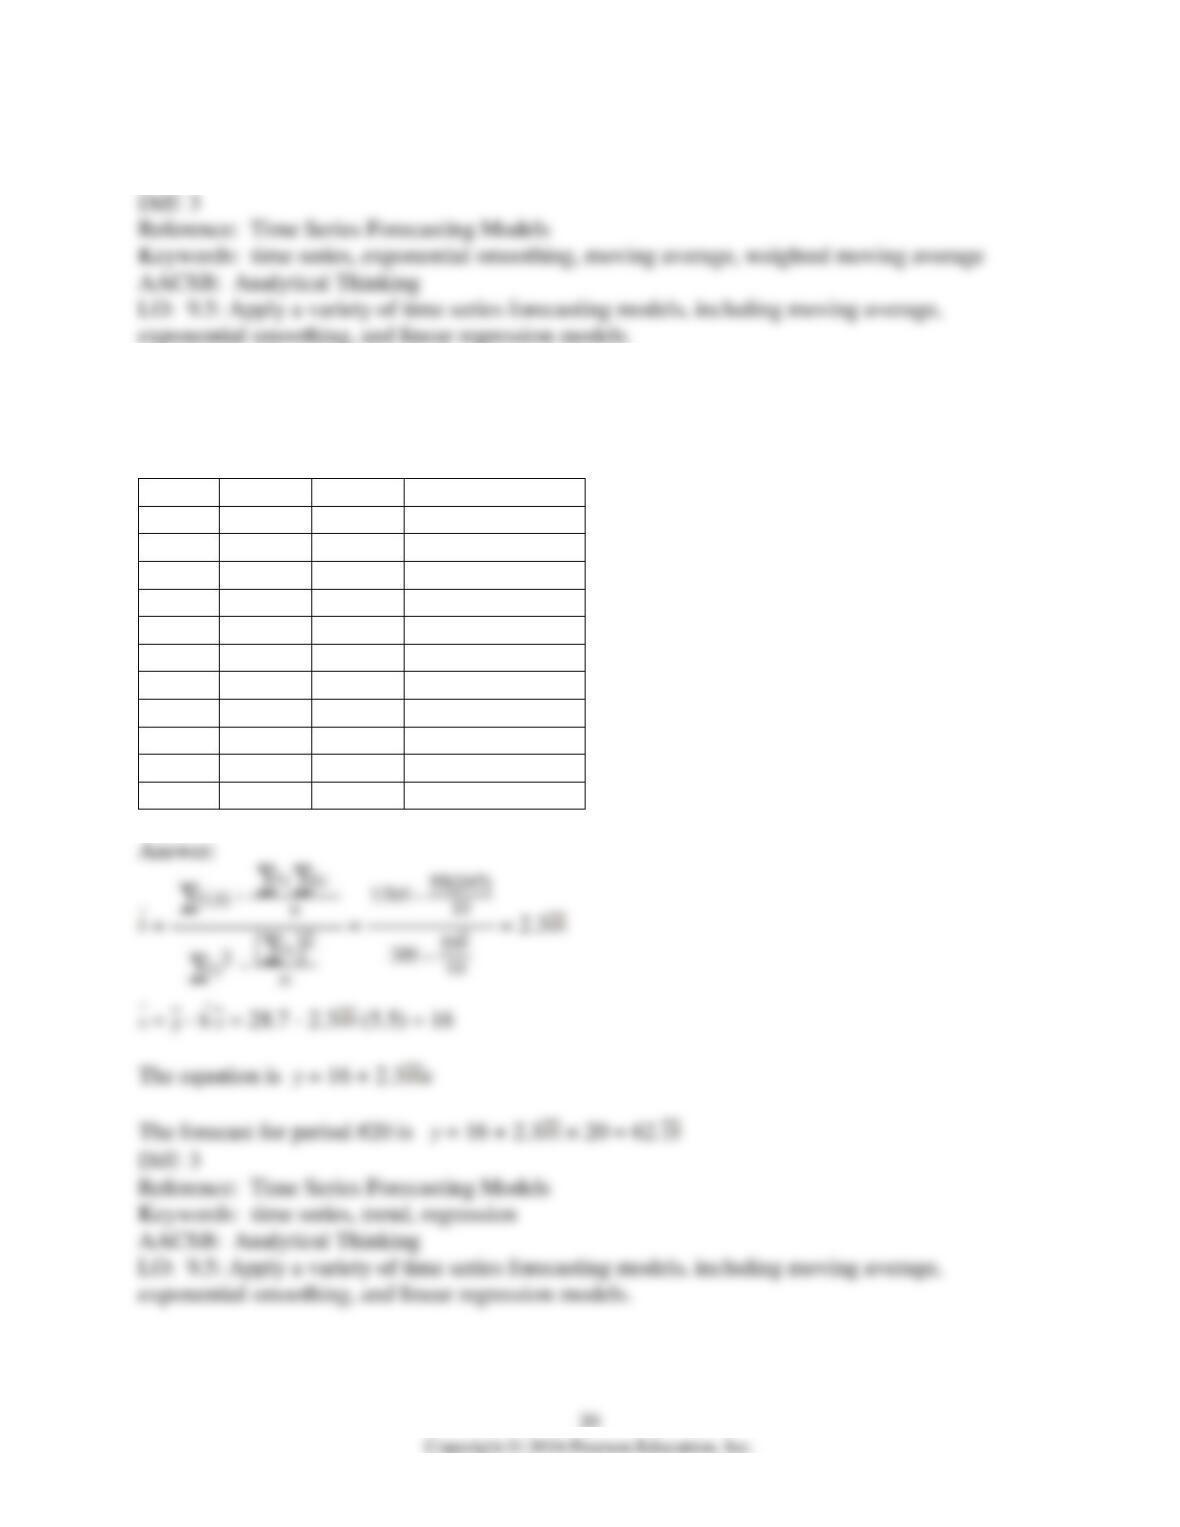
28) Using the data shown in the table, develop a regression line that can be used to predict the
demand for time period number 20. What is the prediction equation and what is your forecast for
period 20?
Period
Demand
Period ∗ Demand
1
16
16
2
20
40
3
24
72
4
27
108
5
29
145
6
30
180
7
32
224
8
35
280
9
36
324
10
38
380
Sums
55
287
1769