Unlock document.
This document is partially blurred.
Unlock all pages and 1 million more documents.
Get Access
CHAPTER 08—MEASURING AND CONTROLLING QUALITY
TRUE/FALSE
1. A nonconforming unit of work is one that has no defects or errors.
2. Attribute measurement requires a much larger sample size than variable measurement to obtain the
same amount of statistical information.
3. For variable data, the two important quality measures are the proportion nonconforming and
nonconformances per unit.
4. Rolled throughput yield is the proportion of conforming units that results from a series of process
steps.
5. The total observed variation in production output is the sum of the true process variation plus variation
due to measurement.
6. A measurement system may be precise but not necessarily accurate at the same time.
7. Histograms allow you to distinguish between common and special causes of variation.
8. Common and special causes of variation must be eliminated before process capability can be
determined.
9. The frequency of sampling in pre-control is often determined by dividing the time period between two
successive out-of-control signals by six.
10. Pre-control should only be used when process capability is greater than 88 percent of the tolerance.
11. A histogram of data that resembles the normal distribution indicates that the process is in control.
12. If most of the points on a control chart are within the control limits with a recognizable pattern, then
the process is in statistical control.
13. A “hugging the center line” pattern in a control chart can be the result of taking each sample from
different process but not mixed together.
14. If points on a control chart are determined to be the result of special causes, the points should be
eliminated and new control limits should be computed.
15. If all sample averages on an -chart fall within the control limits, all output will be conforming.
16. The larger the sample size, the narrower the control limits.
17. Process capability indices cannot be computed from data in an -chart.
18. A better alternative to the -chart to monitor variation is to compute and plot the standard deviation s
of each sample.
19. A p-chart is used with the attribute data.
20. The center line for the np-chart is the average number of nonconforming items per sample.
21. A c-chart is based on the binomial distribution.
22. When constructing a u-chart, the standard deviation of each sample varies because the size of the
sampling unit varies.
23. Control limits for variables and attributes data utilize the same mathematical formulas.
24. Control limits for the s-chart are given by: LCLs = B3s and UCLs = B4s, where B3 and B4 are constants.
25. In determining the method of sampling, samples should be chosen to be as heterogeneous as possible
so that each sample reflects the system of common causes or assignable causes that may be present at
that point in time.
26. If the cost of investigating an operation to identify the cause of an apparent out-of-control condition is
low, narrower control limits should be selected.
MULTIPLE CHOICE
1. In service applications, the term _____ is generally used to describe a nonconformance.
a.
error
b.
unit
c.
cycle
d.
trend
2. A(n) _____ characterizes the presence or absence of nonconformances in a unit of work.
a.
variable
b.
indicator
c.
attribute
d.
error
3. Variable data are _____.
a.
discrete
b.
not measurable
c.
nonrandom
d.
continuous
4. Collecting _____ data is usually easier than collecting _____ data because the assessment can usually
be done more quickly by a simple inspection or count.
a.
variable; attribute
b.
conformances; nonconformances
c.
attribute; variable
d.
simple; complex
5. Compared to variable measurement, attributes measurement requires _____ to obtain the same amount
of statistical information about the quality of the product.
a.
a more distributed population
b.
more nonconformances
c.
a larger sample
d.
a smaller sample
6. Defects per million opportunities (dpmo) = _____.
a.
(Number of defects discovered / Opportunities for error) 100,000
b.
Opportunities for error Number of defects discovered / 1,000,000
c.
(Number of defects discovered / Opportunities for error) 1,000,000
d.
Opportunities for error / (Number of defects discovered 10,000,000)
7. _____ is measured as the amount of error in a measurement in proportion to the total size of the
measurement.
a.
Precision
b.
Accuracy
c.
Systematic bias
d.
Capability
8. _____ is a study of variation in a measurement system using statistical analysis.
a.
Metrology study
b.
SPC study
c.
Calibration study
d.
A repeatability and reproducibility (R&R) study
9. The output of a process is stable and normally distributed. If the process mean equals 23.5, the
percentage of output expected to be less than or equal to the mean:
a.
is less than 25% .
b.
is 50%.
c.
is greater than 75%.
d.
cannot be determined without knowing the standard deviation value.
10. If the variation in the process is due to common causes alone, the process is said to be:
a.
out of control.
b.
in statistical control.
c.
in pre-control.
d.
out of capability.
11. A process is said to be out of control when:
a.
common causes are present.
b.
special causes are present.
c.
the process is not capable of meeting specifications.
d.
the upper and lower control limits cannot be computed.
12. Process capability calculations make little sense if the process:
a.
data were taken over a period of time.
b.
is not in statistical control.
c.
variations are due to common causes.
d.
is not initiated.
13. If a process is neither capable nor in control, the appropriate first step is to:
a.
remove common causes of variation.
b.
redesign the equipment.
c.
remove special causes of variation.
d.
determine the process capability index.
14. In pre-control, which zone covers the nominal specification of a process?
a.
Gray zone
b.
Yellow zone
c.
Red zone
d.
Green zone
15. A machined part has a lower specification limit of 3.5 inches and an upper specification limit of 3.9
inches. The range for the pre-control green zone is:
a.
3.5 inches to 3.9 inches.
b.
3.8 inches to 3.9 inches.
c.
less than 3.5 inches.
d.
3.6 inches to 3.8 inches.
16. Statistical process control relies on _____.
a.
process capability studies
b.
dashboards
c.
control charts
d.
metrology
17. Which of the following is NOT one of the basic applications of a control chart?
a.
To calculate the average-range.
b.
To establish a state of statistical control.
c.
To monitor a process to identify special causes of variation.
d.
To determine process capability.
18. If the process mean and variance do not change over time, the process is considered to be:
a.
in statistical control.
b.
normally distributed.
c.
stable.
d.
capable.
19. Which of the following is NOT an indication of an out-of-control process?
a.
Five consecutive points fall on one side of the center line.
b.
Four of five consecutive points fall within the outer two-thirds region between the center
line and one of the control limits.
c.
Two of three consecutive points fall in the outer one-third region between the center line
and one of the control limits.
d.
A single point falls above the upper control limit.
20. Short repeated patterns in a control chart, with alternating high peaks and low valleys, are known as:
a.
trends.
b.
cycles.
c.
shifts.
d.
runs.
21. A _____ is the result of some cause that gradually affects the quality characteristics of the product and
causes the points on a control chart to gradually move up or down from the center line.
a.
defect
b.
process shift
c.
cycle
d.
trend
22. Which of the following is a likely cause of the control chart pattern known as a “trend?”
a.
Aging equipment
b.
Maintenance schedules
c.
New process operator
d.
Sudden power surge
23. For variables data, the sample means are assumed to be:
a.
exponentially distributed.
b.
normally distributed.
c.
Poisson distributed.
d.
binomially distributed.
24. The _____ is used to monitor the centering of the process.
a.
-chart
b.
R-chart
c.
p-chart
d.
np-chart
25. Which of the following pairs of charts are used together?
a.
-chart and p-chart
b.
R-chart and p-chart
c.
R-chart and s-chart
d.
-chart and R-chart
26. In determining whether a process is in statistical control, the _____ is/are generally analyzed first.
a.
R-chart
b.
upper and lower control limits
c.
-chart
d.
center line
27. Control limits are often confused with _____.
a.
pre-control lines
b.
center lines
c.
specification limits
d.
three sigma limits
28. A company wishes to monitor the variation in the length of time it takes to process and send a bill to a
customer. Seven bills will be randomly selected each day for a 60-day period and the length of time it
takes to process and send the bill to a customer will be recorded for each bill. The appropriate control
chart is a(n):
a.
-chart.
b.
R-chart.
c.
p-chart.
d.
u-chart.
29. Twenty samples of size 6 were collected for a variable measurement. Determine the upper control limit
(UCL) and lower control limit (LCL) for an R-chart if the sum of the sample ranges equals 88.0.
a.
UCL = 8.8176, LCL = 0.0000
b.
UCL = 9.3016, LCL = 0.3344
c.
UCL = 13.2000, LCL = 0.0000
d.
UCL = 29.3921, LCL = 0.0000
30. A precision parts manufacturer produces bolts for use in military aircraft. The specifications for bolt
length are 37.50 0.25 cm. The company has established an -chart and an R-chart using samples of
size five. The center lines for the -chart and R-chart are set at 35.25 cm and 1.08 cm, respectively.
What is the value of Cp for this process?
a.
0.179
b.
1.333
c.
0.301
d.
0.166
31. A precision parts manufacturer produces bolts for use in military aircraft. The specifications for bolt
length are 37.50 0.25 cm. The company has established an -chart and an R-chart using samples of
size five. The center lines for the -chart and R-chart are set at 37.35 cm and 1.05 cm, respectively.
What is the value of Cpk for this process?
a.
0.07
b.
0.28
c.
0.75
d.
0.03
32. An alternative to using the R-chart is the:
a.
np-chart.
b.
s-chart.
c.
c-chart.
d.
p-chart.
33. The s-chart is recommended when:
a.
the control chart calculations needs to be performed by hand.
b.
tight control of variability in the process is required.
c.
the -chart is not associated with an R-chart.
d.
the sample size for each sample needs to be reduced.
34. Six samples of size 10 were collected. The data are provided in the following table:
Sample number
1
2
3
4
5
6
Sample mean
4.80
4.62
4.81
4.55
4.92
4.65
Sample standard deviation
0.35
0.33
0.31
0.35
0.37
0.39
The upper control limit (UCL) and lower control limit (LCL) for an s-chart are:
a.
LCL = 0.2840, UCL = 1.7160.
b.
LCL = 0.0994, UCL = 0.6006.
c.
LCL = 4.6256, UCL = 5.3256.
d.
LCL = 3.6750, UCL = 5.7750.
35. The sample size for an x-chart:
a.
should be between 25 and 30.
b.
is larger than that for an -chart.
c.
is equal to one.
d.
should be greater than one.
36. x-charts are used for:
a.
averages of variables data.
b.
individual attributes data.
c.
individual variables data.
d.
averages of attributes data.
37. Because of high test costs, a sample of single wastewater sludge is tested daily for dissolved oxygen
content. The appropriate control chart is:
a.
-chart and R-chart.
b.
u-chart.
c.
x-chart and moving range chart.
d.
x-chart and R-chart.
38. Which of the following is CORRECT regarding an x-chart?
a.
Individual data require averaging before being plotted on it.
b.
It is less sensitive to many conditions that can be detected by -chart and R-chart.
c.
Specification limits cannot be drawn on the chart for direct comparison with the control
limits.
d.
The assumption of normality of observations is less critical than for -chart and R-charts.
39. A _____ monitors the fraction of nonconforming units.
a.
c-chart
b.
u-chart
c.
np-chart
d.
p-chart
40. If the lower limit for a p-chart computes to a number less than zero, this indicates:
a.
that a calculation error has been made.
b.
that the process is out of control.
c.
that an attribute measure is incorrectly used.
d.
that the lower limit should be set at zero.
41. 25 samples, of size 100 were collected and a total of 96 nonconforming items were found. The upper
control limit for a p-chart would be:
a.
0.083.
b.
0.096.
c.
0.137.
d.
0.254.
42. All else being constant, if the sample size in a p-chart increases from 100 to 120, the upper and lower
control limits will:
a.
move farther apart.
b.
move closer together.
c.
not be affected.
d.
both shift upward.
43. Which of the following is a major advantage of np-charts?
a.
They can be used for variable sample sizes.
b.
They are more accurate than p-charts.
c.
They are easier to understand for production personnel.
d.
The control limits are based on binomial distribution.
44. c-charts are based on the _____ probability distribution.
a.
normal
b.
binomial
c.
Poisson
d.
exponential
45. The control chart most appropriate for plotting the daily percentage of students that wait longer than 5
minutes in line at the undergraduate admissions office is a(n):
a.
p-chart.
b.
np-chart.
c.
x-chart.
d.
-chart.
46. A delivery company defines a “defect” as a package delivered later than the promised delivery time.
Management wants to monitor the proportion of such defect packages per week and plans to sample
120 packages every week. The appropriate control chart is a(n):
a.
-chart.
b.
R-chart.
c.
p-chart.
d.
np-chart.
47. A canning company defines a “nonconformance” as an orange juice can whose diameter is beyond the
upper specification limit. A manager at the canning company wants to monitor the number of such
orange juice cans produced per day. Each day, an employee will randomly select 120 cans over a
period of four weeks. The employee then determines and plots the number of nonconformance cans in
each sample. The appropriate control chart is a(n):
a.
u-chart.
b.
R-chart.
c.
p-chart.
d.
np-chart.
48. Each day, a manufacturing company producing circuit boards will randomly sample 60 circuit boards
for a period of 25 days and then determine and plot the number of defects contained in each of these
boards. The appropriate control chart is a(n):
a.
u-chart.
b.
p-chart.
c.
np-chart.
d.
c-chart.
49. Which of the following charts is used to monitor the average number of nonconformances per unit
when sample sizes vary?
a.
-chart
b.
c-chart
c.
p-chart
d.
u-chart
50. For statistical process control, a good sampling method should always:
a.
use samples of random measurements over a long period of time.
b.
minimize sampling cost.
c.
maximize sample size.
d.
use rational subgroups.
51. To form rational subgroups for an -chart, the goal is to choose the samples as _____ as possible.
a.
heterogeneous
b.
homogeneous
c.
large
d.
systematic
ESSAY
1. Discuss the differences between attributes and variables data.
2. Define pre-control and explain under what conditions pre-control can be used.
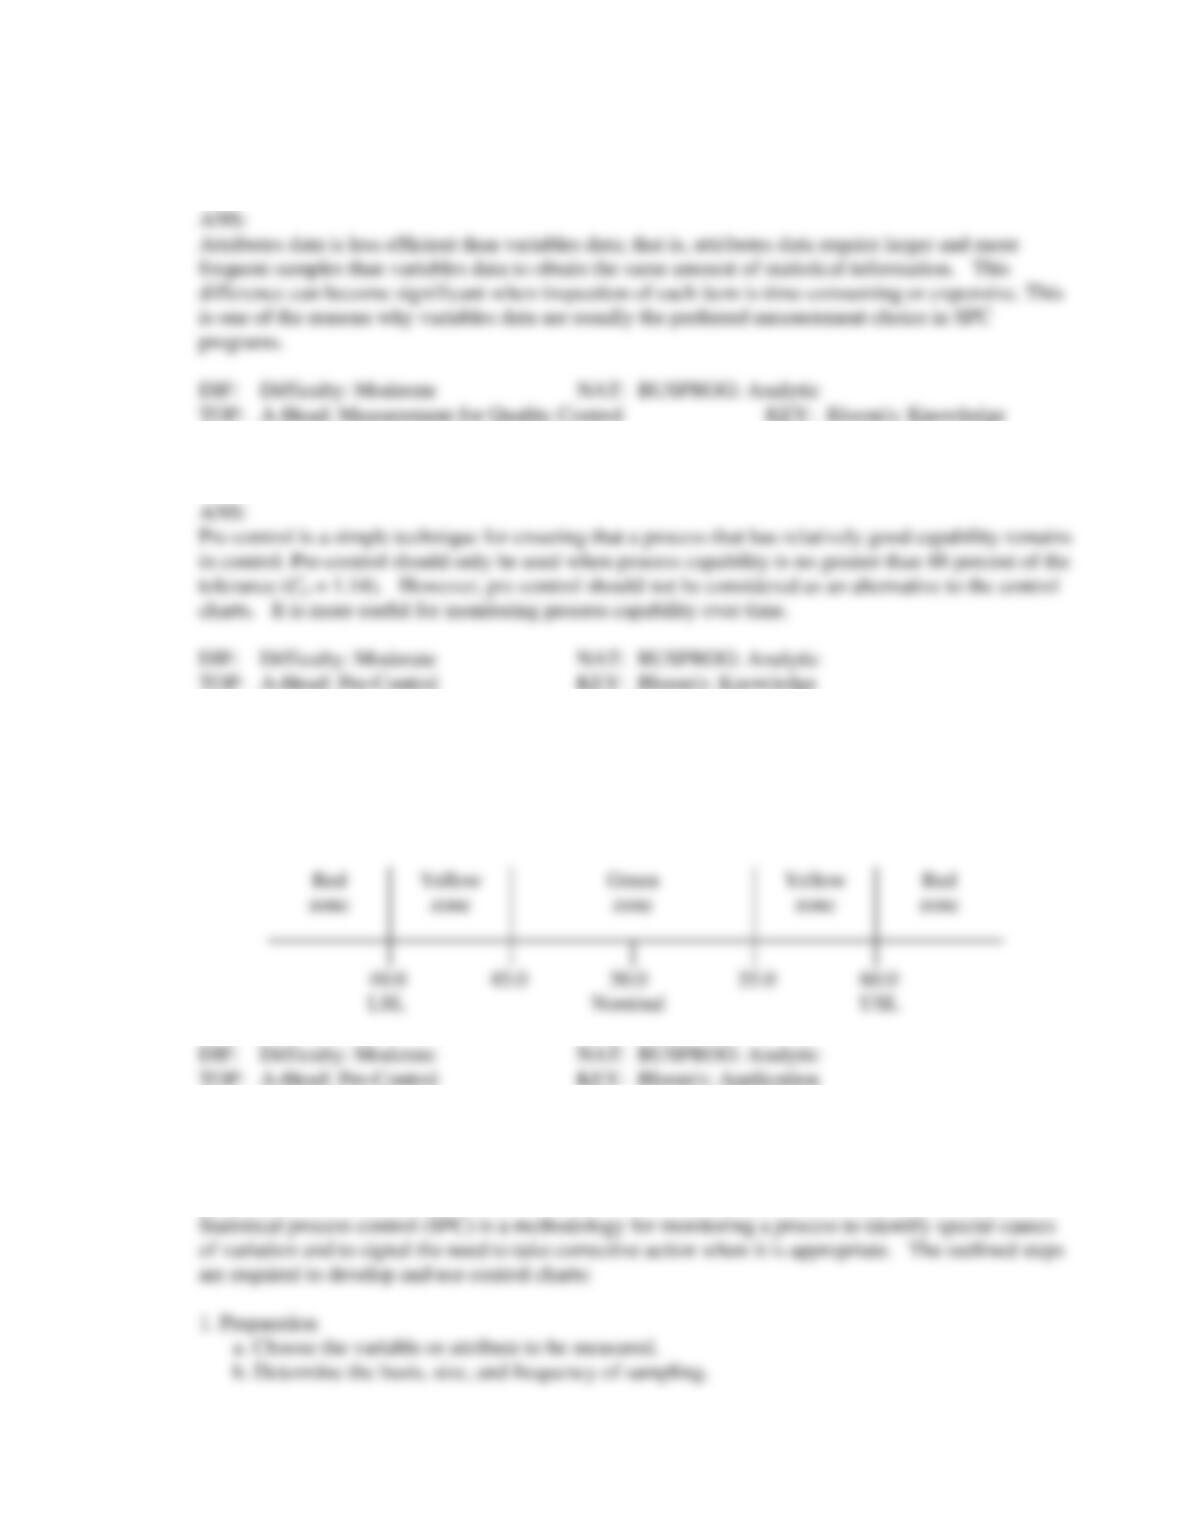
3. A specification is 50.0 cm 10.0 cm. Sketch and label the pre-control zones for this specification.
Include the following values on your sketch: nominal, upper and lower specification limits, and end
points of the green zone.
ANS:
4. Define the term statistical process control. Outline the steps for setting up a control chart to monitor a
process.
ANS:


