5. Define each of the following control chart patterns. Include a sketch of each pattern with your
definition.
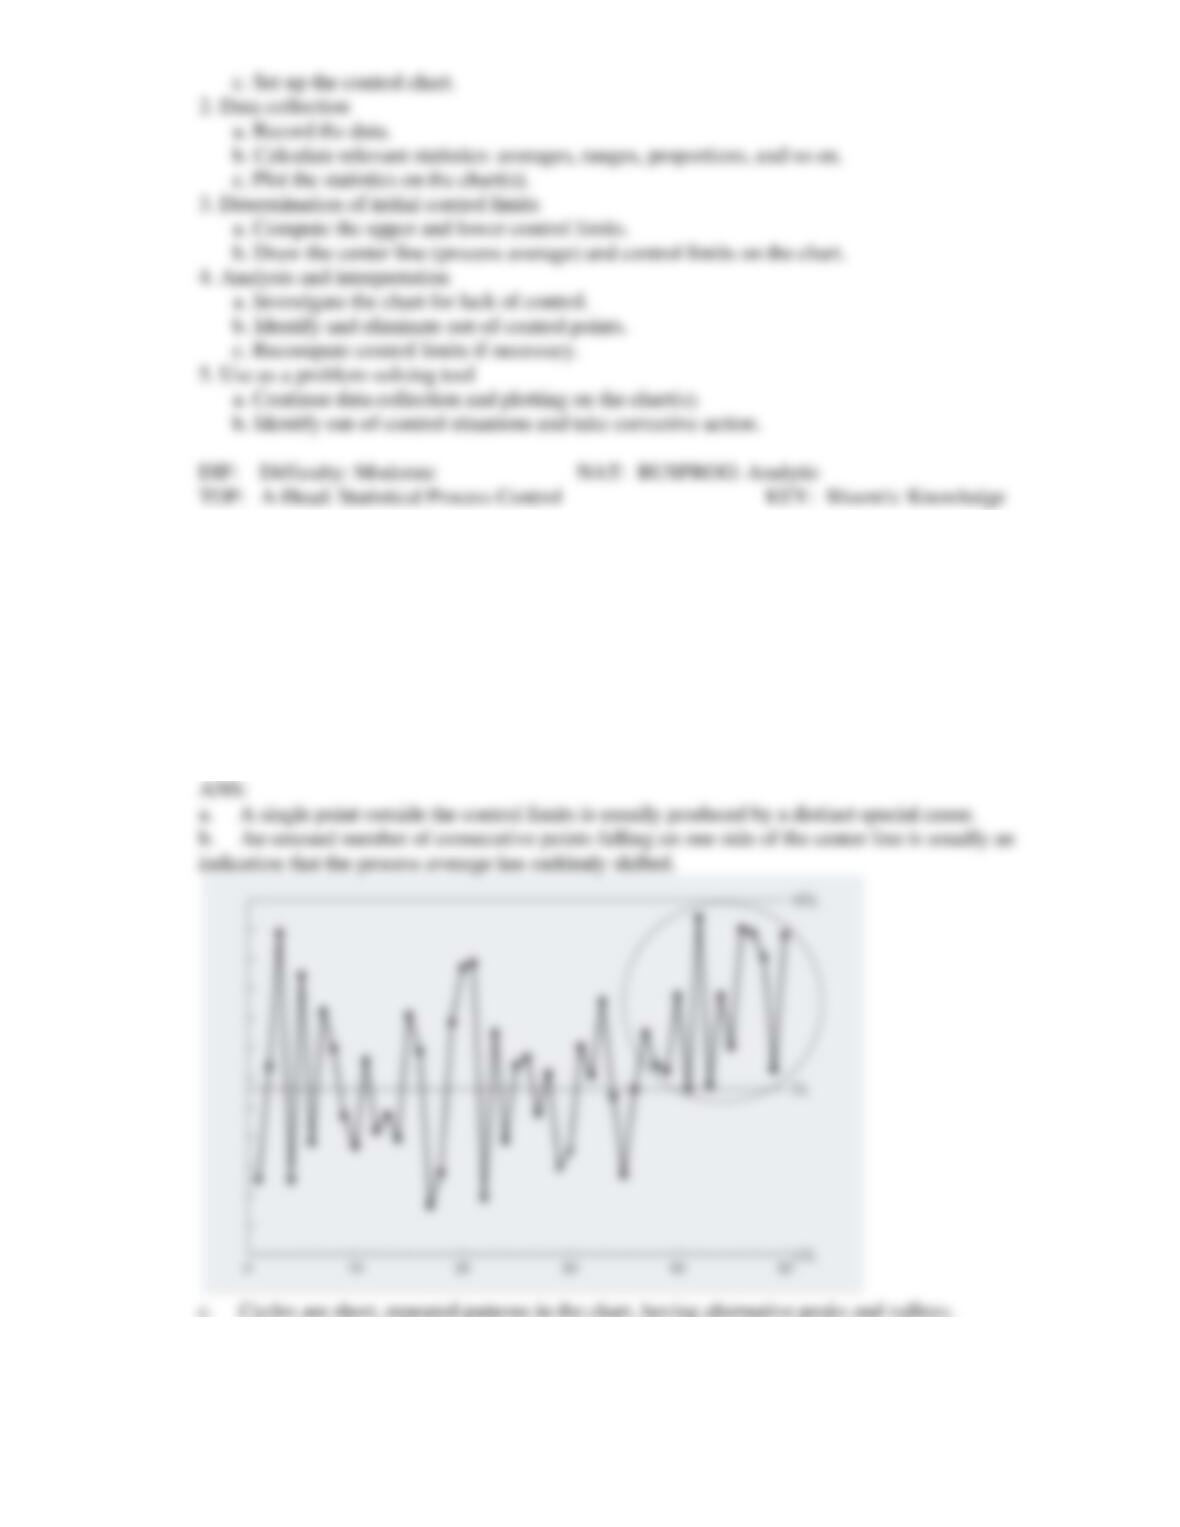
a. One point outside the control limits
b. Sudden shift in the process average
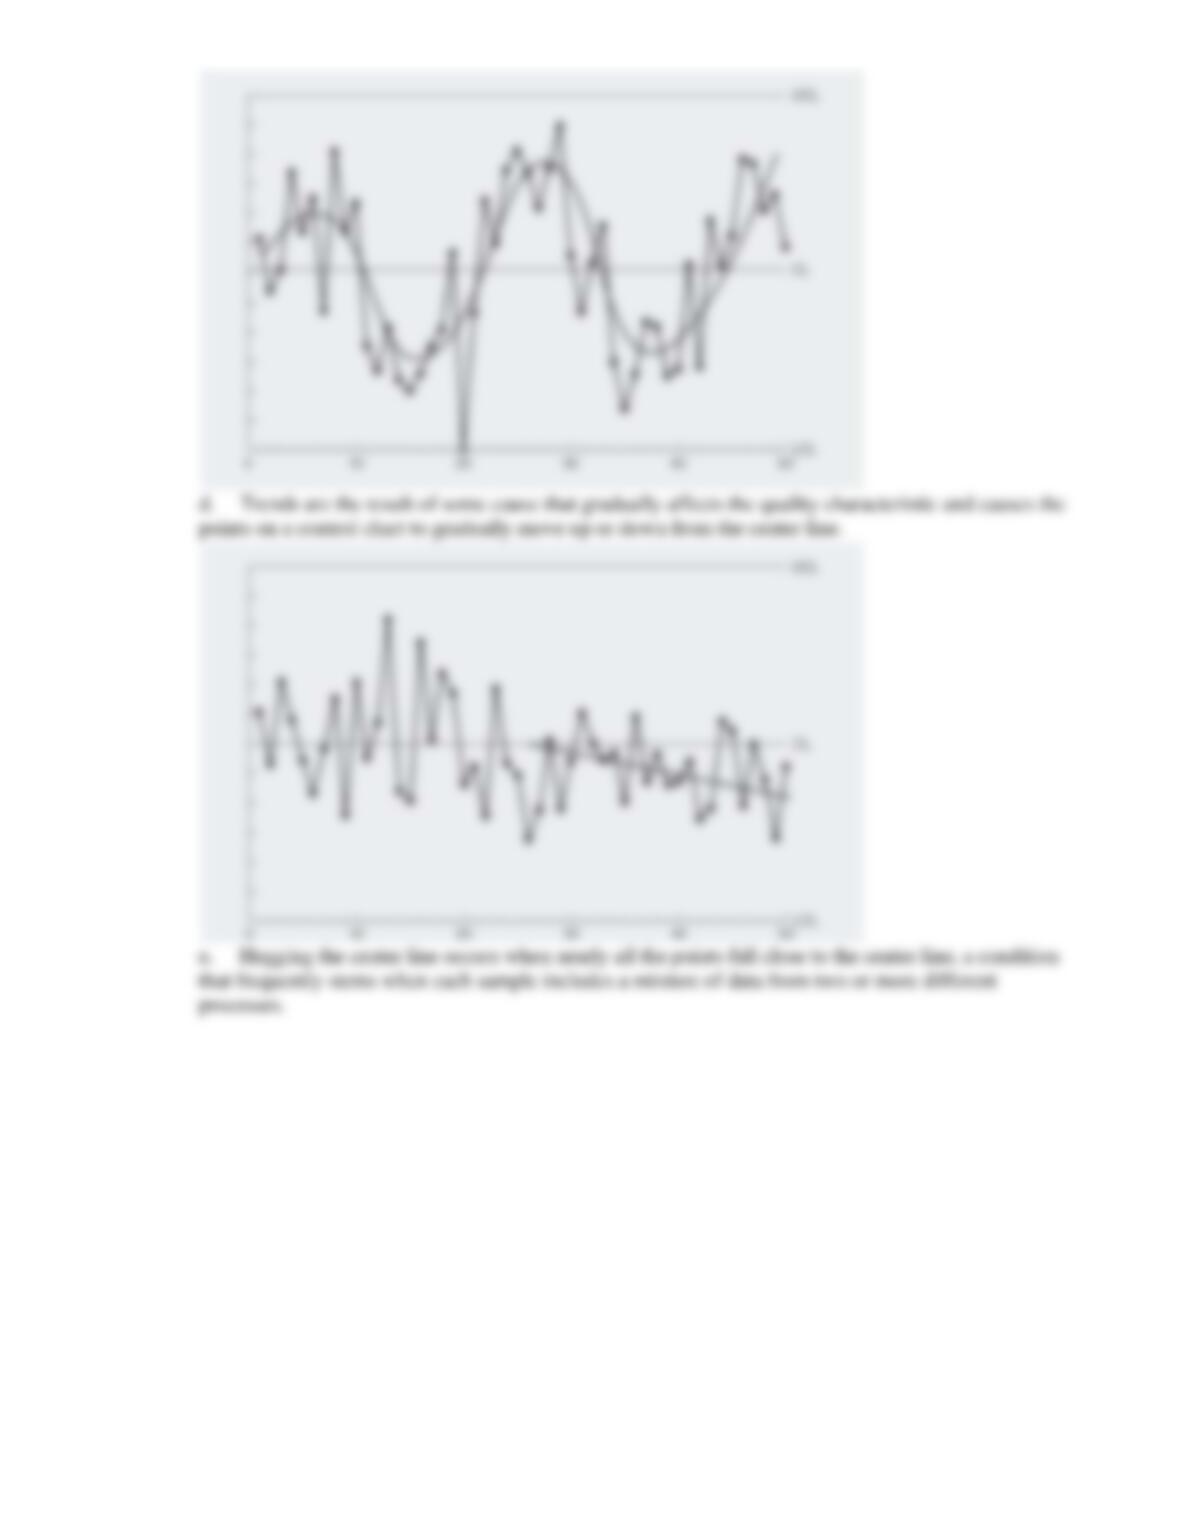
c. Cycles
d. Trends
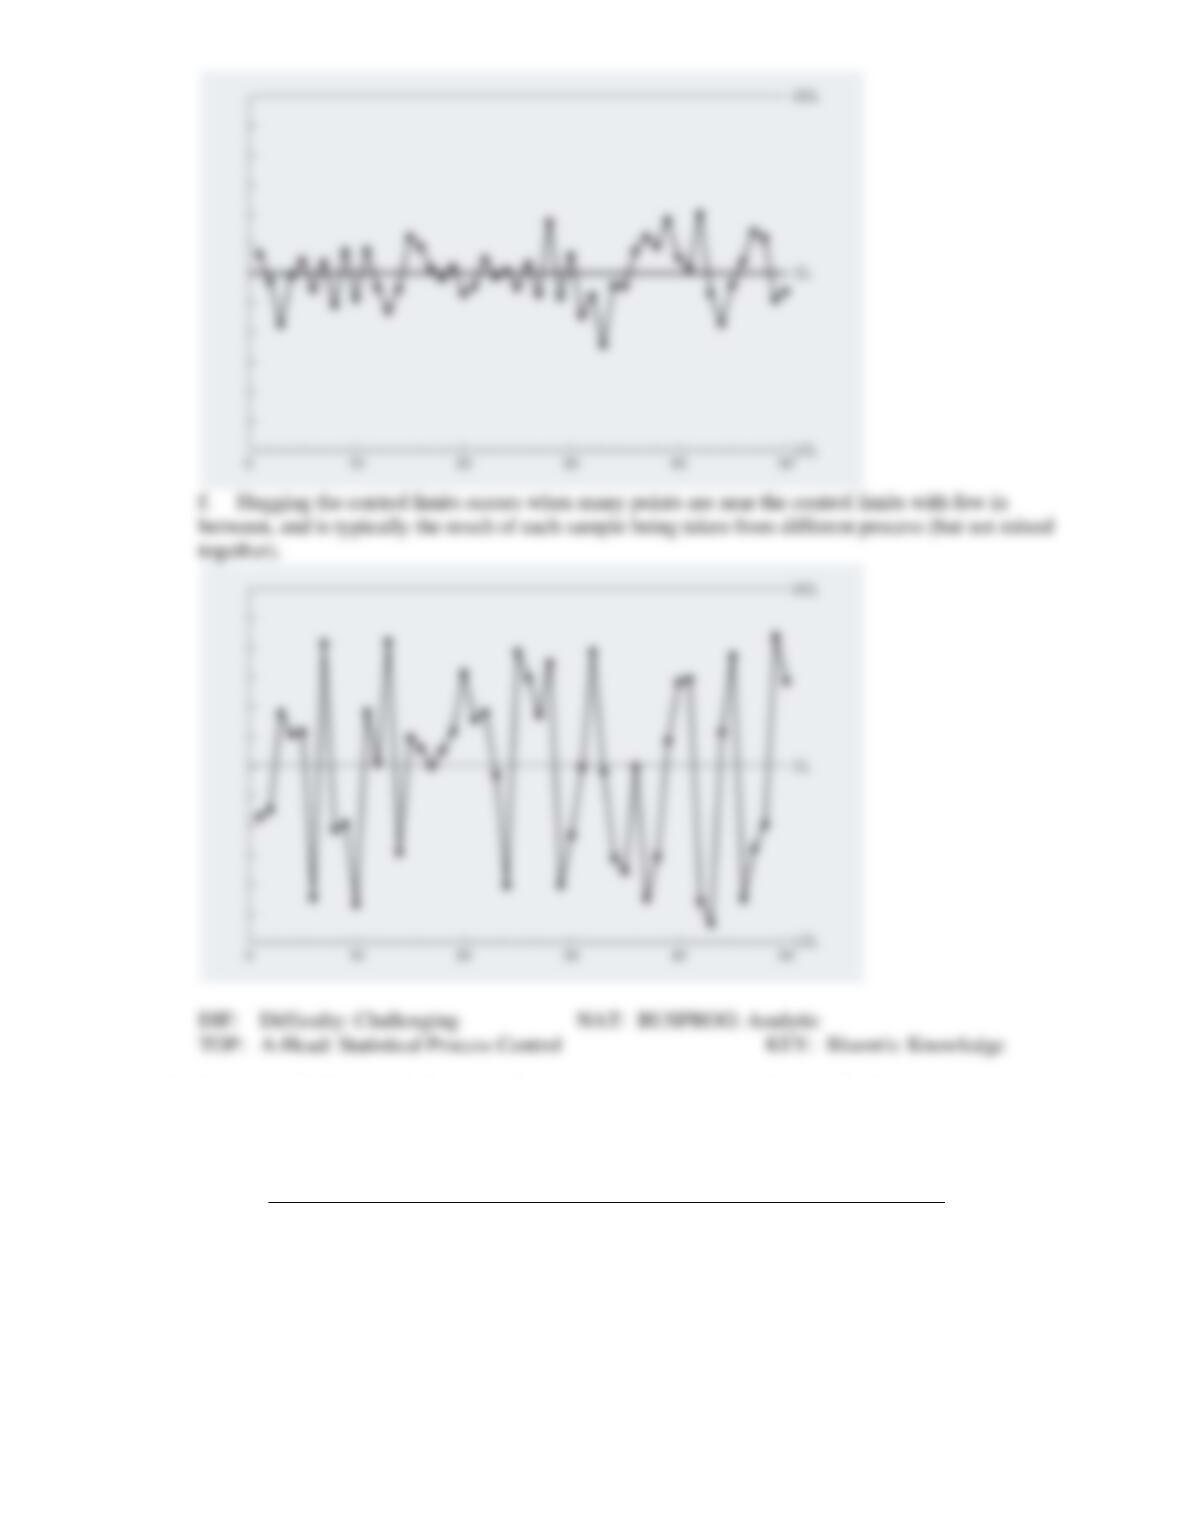
e. Hugging the center line
f. Hugging the control limits
6. A process fills boxes with detergent. Construct an appropriate set of control limits to monitor the
filling process. Historical data for fill weight (in ounces) of ten samples are presented below. A sample
size of six was used.
Sample
Sample Mean
Sample Range
1
15.80
0.42
2
16.10
0.38
3
16.02
0.08
4
15.95
0.15
5
16.12
0.42
6
16.18
0.23
7
15.87
0.36
8
16.20
0.40
9
16.07
0.28
10
15.94
0.36
7. Identify the tradeoffs associated with the s-chart instead of the R-chart.
8. In the production of vitamin capsules, the proportion of calcium in each capsule has a specification of
48 ± 18 parts per million (ppm). An initial random sample of 100 capsules revealed a sample average
calcium content of 44.5 ppm and a sample standard deviation of 3.2 ppm. Management uses – and
R-charts to monitor the calcium amount using samples each of size 4.
The charts depict an in-control process. The center line of the R-chart is 6.7 and the center line of the
-chart is 44.8.
a. Compute Cp for this process using estimates of the process mean and standard deviation derived
from the random sample.
b. Compute Cp for this process using estimates of the process mean and standard deviation derived
from the control chart parameters.
c. Compute Cpk for this process using estimates of the process mean and standard deviation derived
from the random sample.
c. Compute Cpk for this process using estimates of the process mean and standard deviation derived
from the control chart parameters.
d. What do the differences between the values of Cp and Cpk tell you?
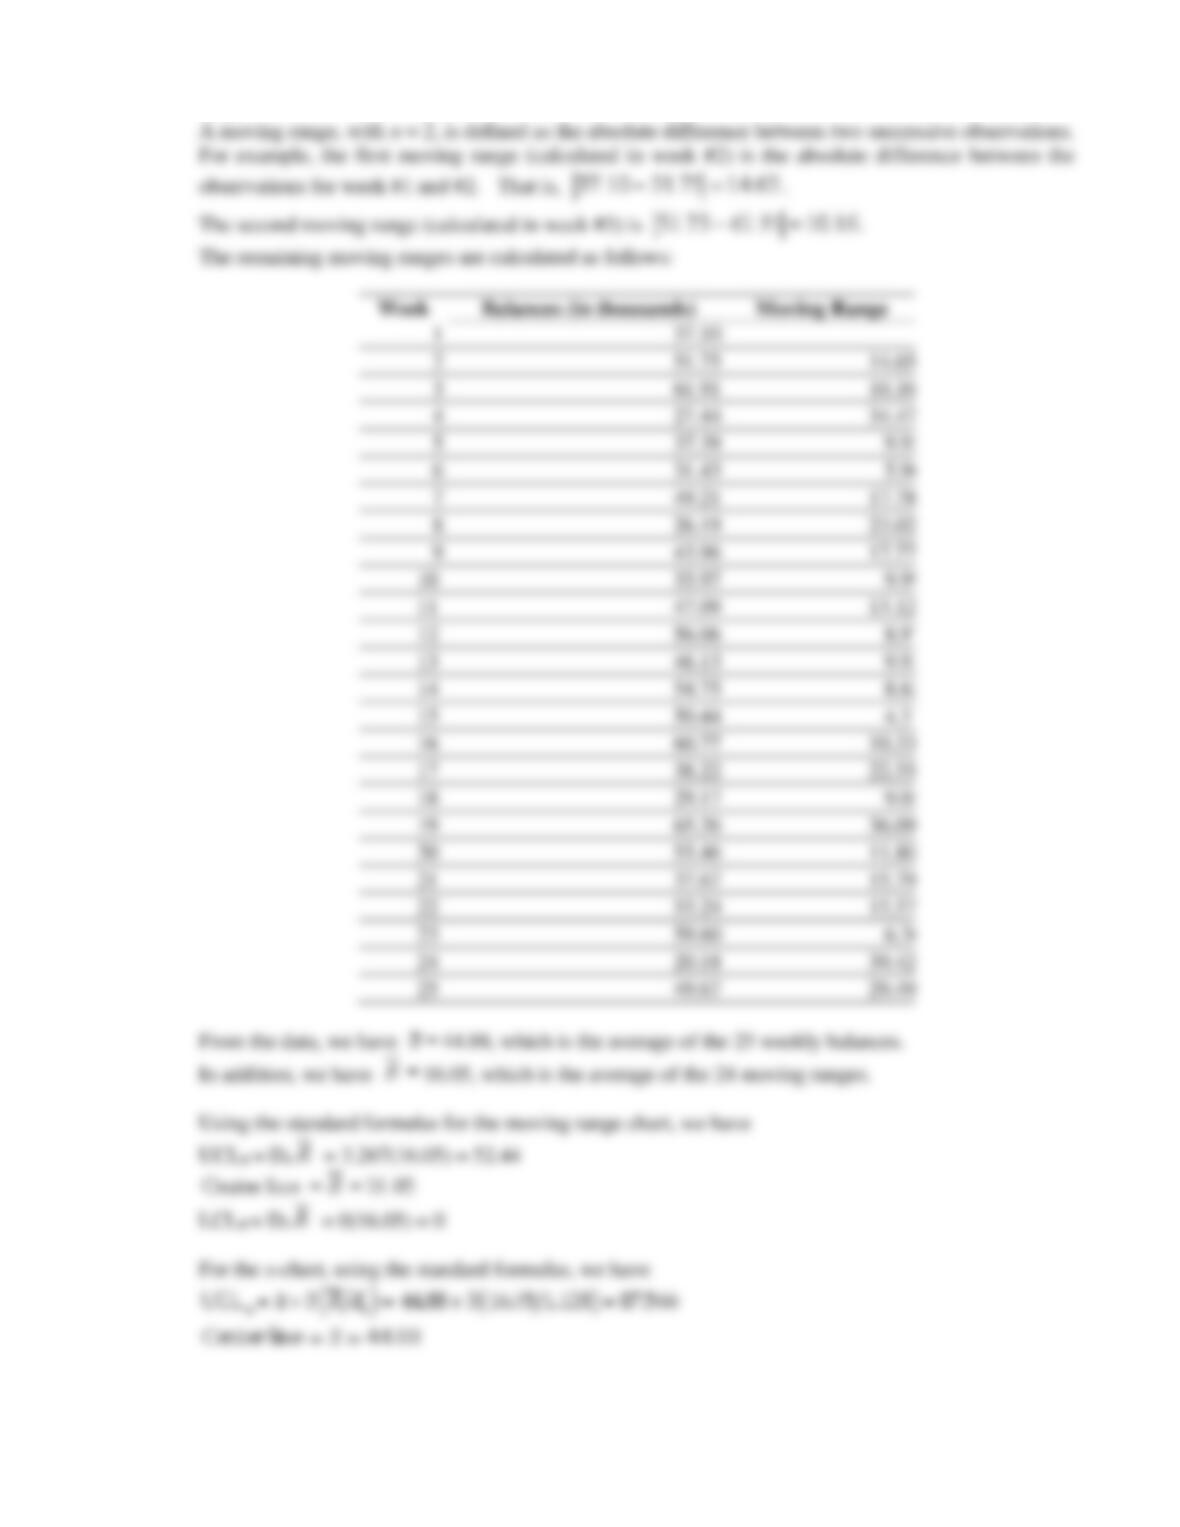
9. RM Industries wishes to monitor its end-of-week accounts receivable balance. To do so, the
end-of-week balances for the previous 25 weeks were recorded and are shown below. Establish an
x-chart and a moving range (using n = 2) chart for this process.
Week
Balances (in thousands)
Week
Balances (in thousands)
1
37.10
14
54.75
2
51.75
15
50.44
3
61.91
16
60.77
4
27.44
17
38.22
5
37.39
18
29.17
6
31.43
19
65.26
7
49.21
20
53.46
8
26.19
21
37.67
9
43.96
22
53.24
10
33.97
23
59.60
11
47.09
24
20.18
12
56.06
25
49.67
13
46.13
ANS:
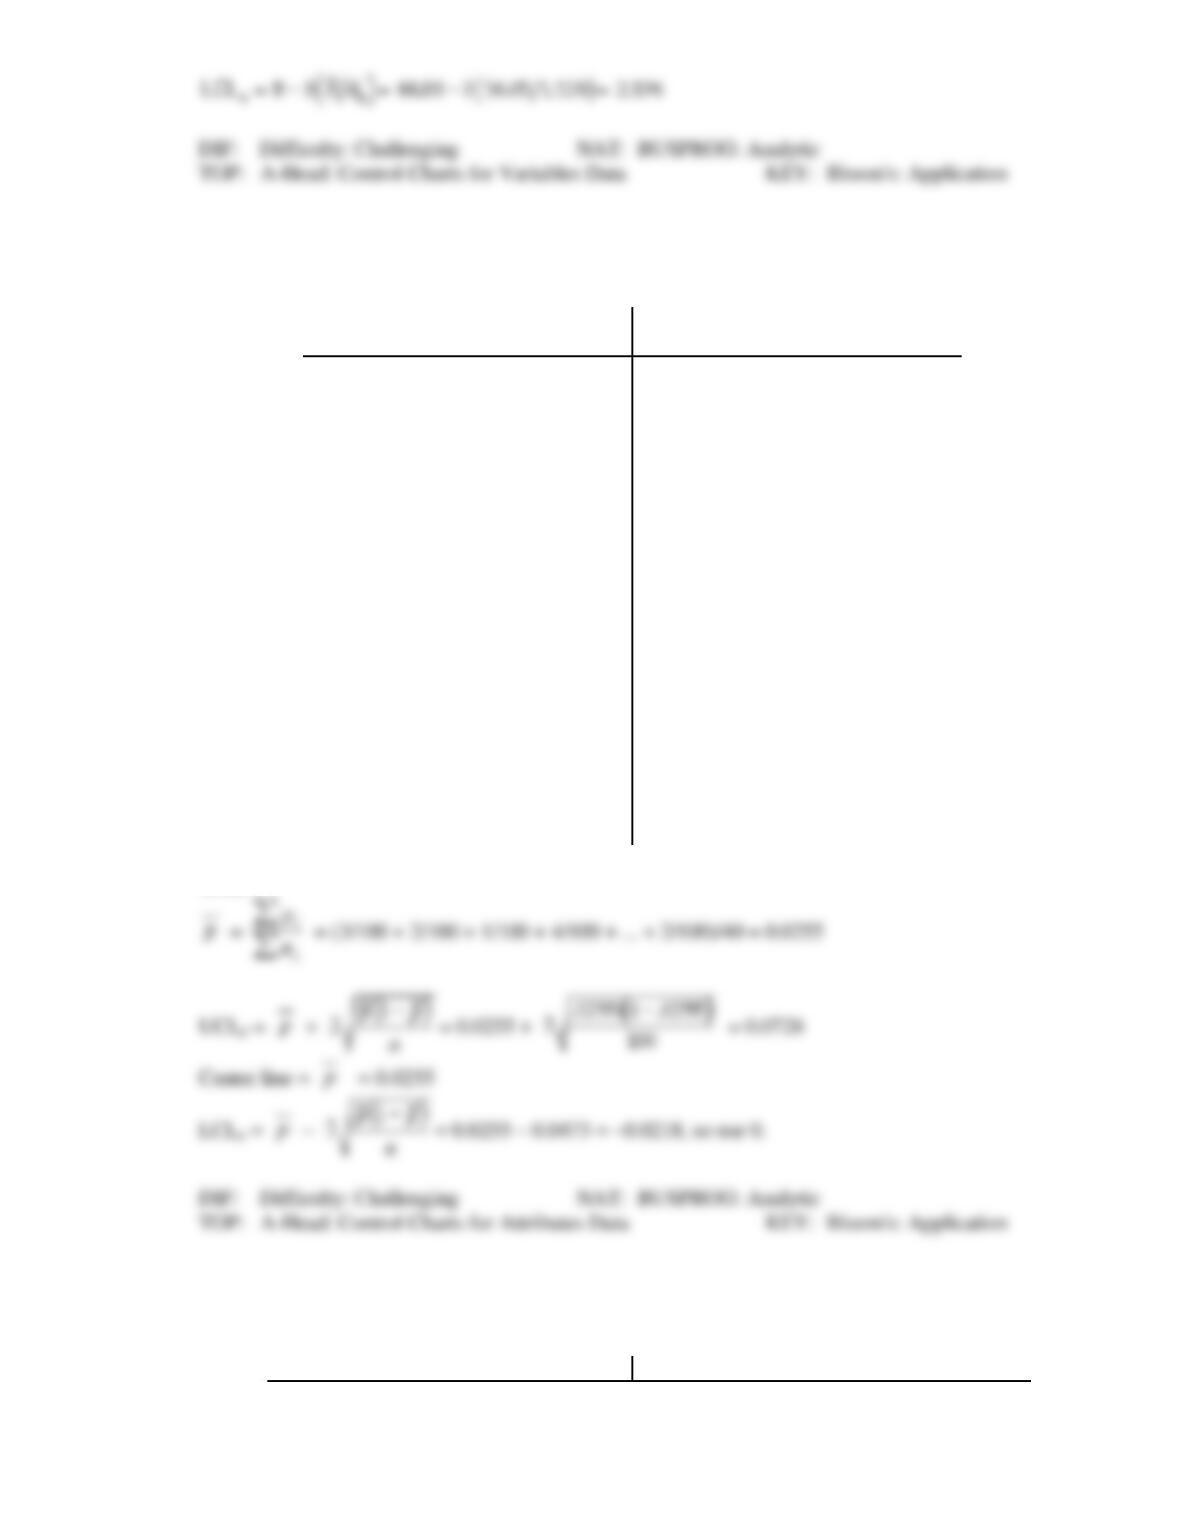
10. A quality engineer took 40 samples of 100 transistors each from the output of an assembly line. Each
transistor was tested and the number of defectives in each sample is recorded in the table below.
Determine the control chart limits for a p-chart.
Sample
Number
Defective
Sample
Number
Defective
1
3
21
1
2
2
22
2
3
1
23
2
4
4
24
3
5
0
25
4
6
2
26
1
7
0
27
2
8
5
28
4
9
1
29
0
10
2
30
4
11
2
31
3
12
1
32
2
13
3
33
4
14
3
34
2
15
4
35
1
16
5
36
1
17
3
37
3
18
3
38
4
19
1
39
4
20
8
40
2
ANS:
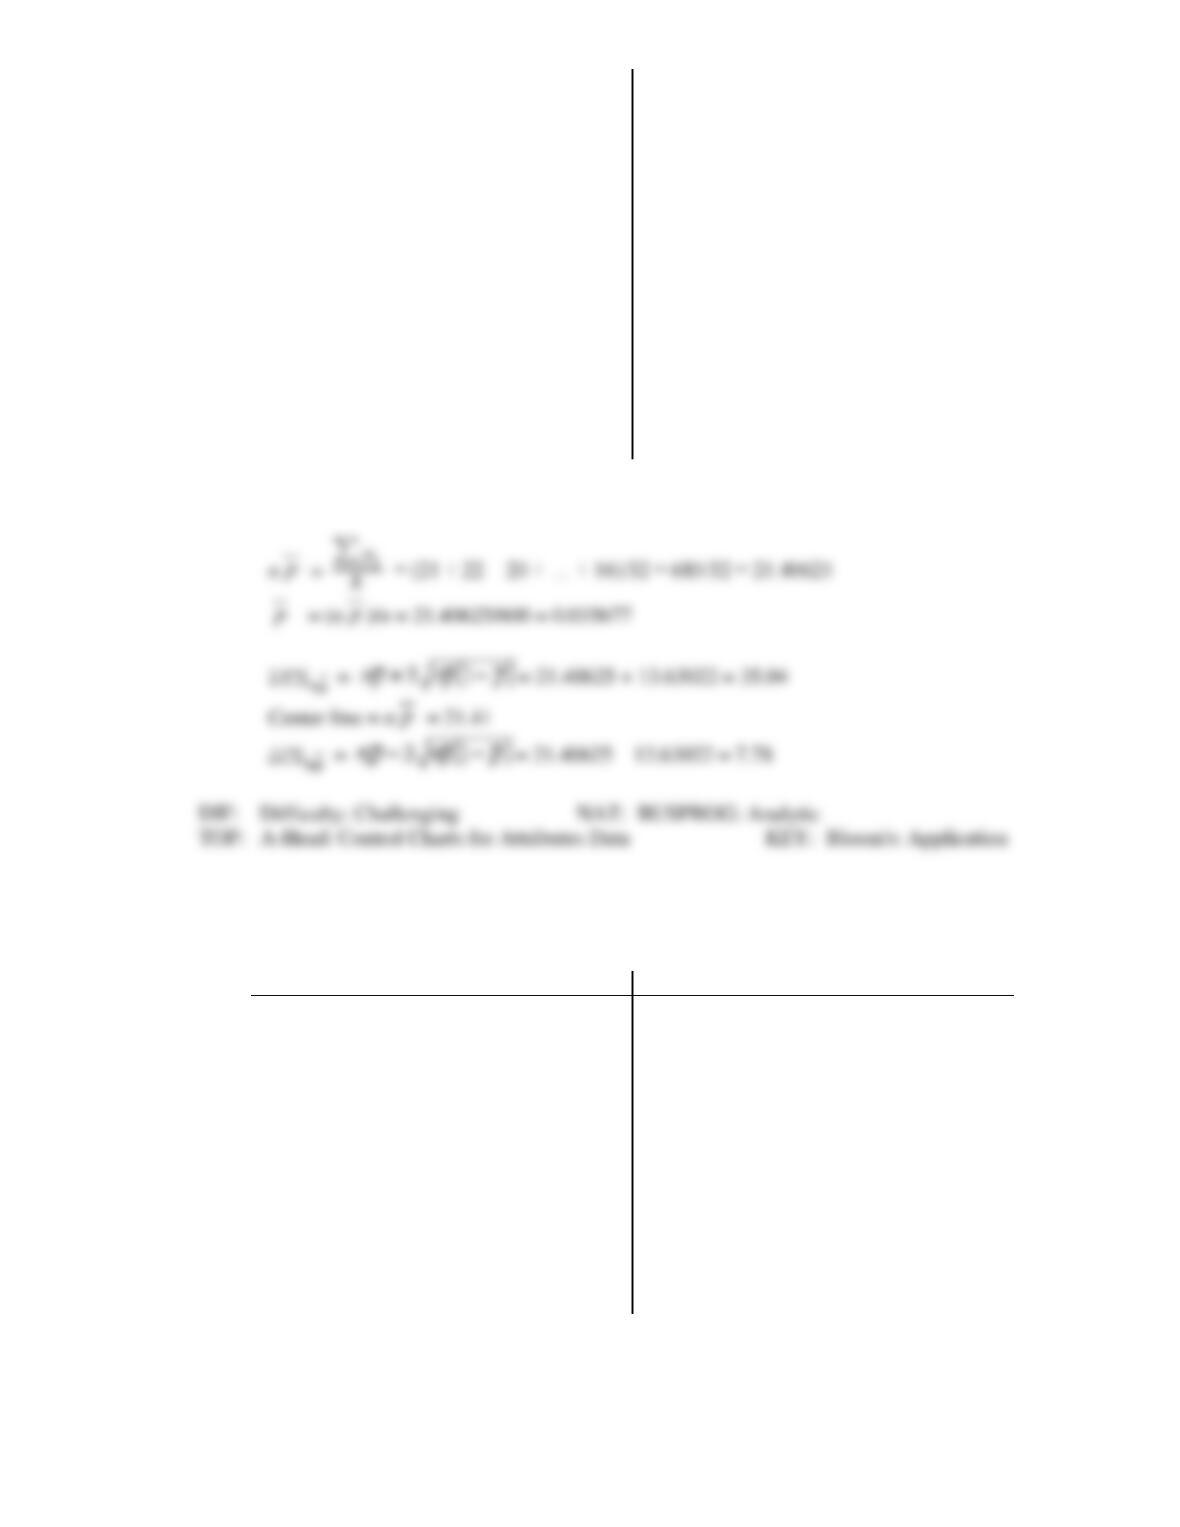
11. A bank recently took 32 random samples of size 600 to determine the accuracy of its customer records.
A customer record was considered to be nonconforming if any portion of the record was left blank.
The sample data are presented below. Determine the control limits for an np–chart.
Sample
Number Nonconforming
Sample
Number Nonconforming
1
21
17
20
2
22
18
16
3
20
19
11
4
21
20
24
5
23
21
25
6
39
22
21
7
18
23
23
8
24
24
20
9
20
25
24
10
22
26
28
11
19
27
21
12
23
28
19
13
22
29
15
14
29
30
22
15
17
31
24
16
16
32
16
ANS:
12. Coils of synthetic rope are monitored for defects. Each coil contains 1,200 feet of rope. 26 coils were
selected and the number of defects found in each coil is presented below. Identify an appropriate
control chart and determine the chart’s control limits.
Sample
Number of Defects
Sample
Number of Defects
1
1
14
0
2
3
15
5
3
4
16
4
4
2
17
2
5
4
18
3
6
2
19
0
7
0
20
3
8
3
21
4
9
2
22
3
10
2
23
1
11
1
24
2
12
4
25
0
13
3
26
3
ANS:
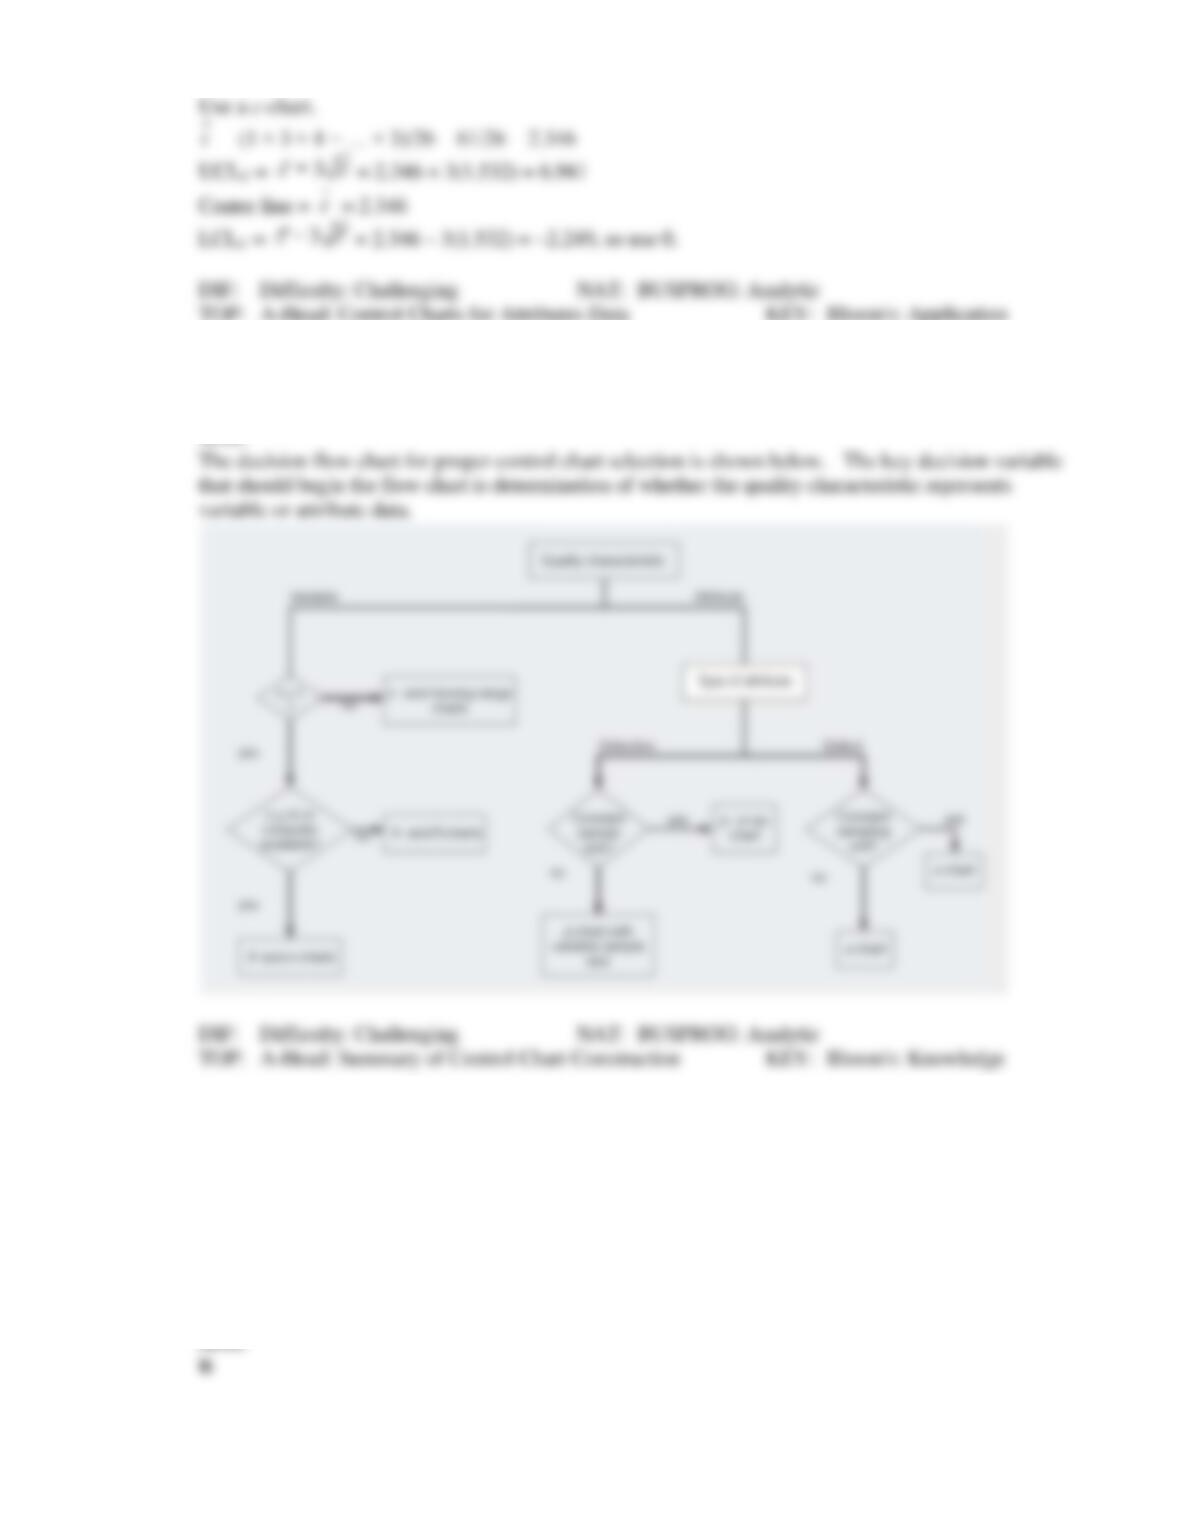
13. Construct a flow chart that illustrates the decision process for selecting the appropriate control chart(s)
for monitoring a given process.
ANS:
CASE
1. To ensure consistent quality, Kroger Company initiated a _____ that began by collecting voice of the
customer data using focus groups.
a. Quality Assurance Committee
b. Lean Six Sigma project
c. sampling strategy
d. new production process
2. What is the conclusion Kroger company arrived at after initiating the Lean Six Sigma project?
3. Kroger Company uses a specification book that describes the _____ of all products carried by the
company.
a. prices
b. sales
c. qualification standards
d. quantity
4. What is a Kroger Quality Score?
5. Discuss the different devices that the quality assurance inspectors at Kroger use to help conduct the
quality control process.
6. Explain the inspection procedure at Kroger when batches of products arrive at the Distribution Center?
7. Explain the different stages involved in the manufacturing of individual syringes at the Midwest
pharmaceutical company.
8. Discuss the problem associated with the tacked syringes at the final production step.
ANS:
9. In an attempt to solve the problem of tacked syringes, statistical consultants recommended _____ for
the purpose of improving the tacking operation.
a. ANOVA
b. pre-control
c. measurement system evaluation
d. Statistical Process Control
10. What were the upper and lower specification limits desired for the syringe assembly process?
11. Operators at the final stage of the syringe assembly process chose 35 consecutive observations for a
capability study and arrived at an estimated minimum process capability index of:
a. 1.01.
b. 0.97.
c. 1.03.
d. 0.99.
12. State the conclusion drawn by the operators in the capability study of the tacking operation.
13. How was the -chart interpreted by the second shift operators of the syringe assembly process, after
the machine had been adjusted thrice by the technician? How did the statistical consultants interpret it?
ANS:
14. What were the conclusions drawn by the statistical consultants using the R-chart?
15. What did the statistical consultants recommend to the managers of the pharmaceutical company, after
the maintenance technician explained the reason for the increased length of the syringes? Was it
implemented? What was the final result?