Operations Management, 12e (Heizer/Render/Munson)
Chapter 8 Location Strategies
Section 1 The Strategic Importance of Location
1) FedEx chose Memphis, Tennessee, for its central location, or “hub,” primarily because of the incentives
offered by the city of Memphis and the state of Tennessee.
2) FedEx chose Memphis, Tennessee, as its U.S. hub because:
A) the city is in the center of the United States, geographically.
B) the airport has relatively few hours of bad weather closures.
C) it needed a means to reach cities to which it did not have direct flights.
D) the firm believed that a hub system was superior to traditional city-to-city flight scheduling.
E) All of the above are true.
3) Which of the following statements regarding FedEx is TRUE?
A) Its hub in Memphis, Tennessee, was selected because of its low cost.
B) Memphis, Tennessee, is the only hub in the company’s global flight network.
C) FedEx believes the hub system helps reduce mishandling and delays due to better controls.
D) FedEx uses a hub system in the United States, but a city-to-city network in other countries.
E) Memphis is FedEx’s only hub airport in the United States.
4) Industrial location analysis typically attempts to:
A) minimize costs.
B) maximize sales.
C) focus more on human resources.
D) avoid countries with strict environmental regulations.
E) ignore exchange rates and currency risks.
5) A location decision for an appliance manufacturer would tend to have what type of focus?
A) cost focus
B) focus on finding very highly skilled technicians
C) revenue focus
D) environmental focus
E) education focus
6) A location decision for a traditional department store (e.g., Macy’s) would tend to have what type of
focus?
A) cost focus
B) labor focus
C) revenue focus
D) environmental focus
E) education focus
7) Location decisions are often being based on which of the following?
A) ports and rivers
B) rail hubs
C) interstate highways
D) airports
E) all of the above
8) FedEx schedules its aircraft using a(n) ________ system, which it credits with reducing package
mishandling and delay in transit.
9) Why does FedEx use a central hub airline network, rather than a “point–to-point” network? Describe
FedEx’s approach to choosing its superhub.
10) State the fundamental objective of a firm’s location strategy. How is this basic objective carried out by
industrial or goods-producing firms; how does that differ for service firms?
Section 2 Factors That Affect Location Decisions
1) Lists have been developed that rank countries on issues such as “competitiveness” and “corruption.”
2) The ratio of labor cost per day to productivity, in units per day, is the labor cost per unit.
3) For a location decision, labor productivity may be important in isolation, but low wage rates are a more
important criterion.
4) Unfavorable exchange rates can offset other savings in a location decision.
5) An example of an intangible cost, as it relates to location decisions, is the quality of education.
6) In location decisions, intangible costs are easier to measure than tangible costs.
7) Location decisions are based on many things, including costs, revenues, incentives, attitudes, and
intangibles, but not on ethical considerations.
8) Manufacturers may want to locate close to their customers if the transportation of finished goods is
expensive or difficult.
9) One reason for a firm locating near its competitors is the presence of a major resource it needs.
10) Why is Northern Mexico used as a cluster for electronics firms?
A) high traffic flows
B) venture capitalists located nearby
C) natural resources of land and climate
D) NAFTA
E) high per capita GDP
11) Among the following choices, an operations manager might best evaluate political risk of a country
by looking at which type of country ranking?
A) based on competitiveness
B) based on cost of doing business
C) based on corruption
D) based on magnitude of government social programs
E) based on average duration between presidential/prime minister elections
12) ________ and currency risks are to key country success factors as land costs and ________ are to key
region success factors.
A) Cultural issues; zoning restrictions
B) Exchange rates; environmental impact
C) Labor cost; proximity to customers
D) Land costs; air and rail systems
E) All of the above are accurate relationships.
13) Which of the following workers is the most productive?
A) $50 wages, 10 parts produced
B) $10 wages, 1 part produced
C) $30 wages, 5 parts produced
D) $100 wages, 21 parts produced
E) $500 wages, 100 parts produced
14) A employee produces 15 parts during a shift in which he made $90. What is the labor content of the
product?
A) $90
B) $5
C) $6
D) $0.167
E) $1,350
15) The reason fast food restaurants often are found in close proximity to each other is:
A) they enjoy competition.
B) location clustering near high traffic flows.
C) low cost.
D) availability of skilled labor.
E) all of the above.
16) Currency risk is based on what assumption?
A) Firms that do not continuously innovate will lose market share.
B) Values of foreign currencies continually rise and fall in most countries.
C) Changing product lines by reacting to every current trend may alienate the customer base.
D) The value of one dollar today is greater than the value of one dollar to be received one year from now.
E) The U.S. stock market fluctuates daily.
17) Governmental attitudes toward issues such as private property, intellectual property, zoning,
pollution, and employment stability may change over time. What is the term associated with this
phenomenon?
A) bureaucratic risk
B) political risk
C) legislative risk
D) judicial risk
E) democratic risk
18) Globalization of the location decision is the result of all EXCEPT which of the following?
A) market economics
B) higher quality of labor overseas
C) ease of capital flow between countries
D) high differences in labor costs
E) more rapid, reliable travel and shipping
19) In location planning, environmental regulations, cost and availability of utilities, and taxes are:
A) global factors.
B) country factors.
C) regional/community factors.
D) site-related factors.
E) none of the above.
20) Which of the following is usually NOT one of the top considerations in choosing a country for a
facility location?
A) availability of labor and labor productivity
B) exchange rates
C) attitude of governmental units
D) zoning regulations
E) location of markets
21) When making a location decision at the country level, which of these would be considered?
A) corporate desires
B) land/construction costs
C) air, rail, highway, waterway systems
D) zoning restrictions
E) location of markets
22) Which of these factors would be considered when making a location decision at the
region/community level?
A) government rules, attitudes, stability, incentives
B) cultural and economic issues
C) zoning restrictions
D) environmental impact issues
E) proximity to raw materials and customers
23) When making a location decision at the region/community level, which of these would be considered?
A) government rules, attitudes, stability, incentives
B) cultural and economic issues
C) cost and availability of utilities
D) zoning restrictions
E) air, rail, highway, waterway systems
24) Which of these factors would be considered when making a location decision at the site level?
A) government rules, attitudes, stability, incentives
B) cultural and economic issues
C) zoning regulations
D) cost and availability of utilities
E) proximity to raw materials and customers
25) Tangible costs include which of the following?
A) climatic conditions
B) availability of public transportation
C) taxes
D) quality and attitude of prospective employees
E) zoning regulations
26) Intangible costs include which of the following?
A) quality of prospective employees
B) quality of education
C) availability of public transportation
D) all of the above
E) none of the above
27) Which of the following statements regarding “proximity” in the location decision is FALSE?
A) Service organizations find that proximity to market is the most critical primary location factor.
B) Manufacturers want to be near customers when their product is bulky, heavy, or fragile.
C) Perishability of raw materials is a good reason for manufacturers to locate near the supplier, not the
customer.
D) Reduction in bulk is a good reason for a manufacturer to locate near the supplier.
E) Clustering among fast food chains occurs because they need to be near their labor supply.
28) Which of the following is the best example of the proximity rule that, for service firms, proximity to
market is the most important location factor?
A) Soft drinks are bottled in many local plants, where carbonated water is added to proprietary syrups
that may have been shipped long distances.
B) Few people will travel out of state for a routine haircut.
C) Patients will travel very long distances to have their hernia surgeries performed at Shouldice Hospital.
D) Furniture makers choose to locate near the source of good hardwoods, even though it means locating
near other furniture manufacturers.
E) Metal refiners (smelters) locate near mines to accomplish significant weight reduction near the metal’s
source.
29) ________ costs are readily identifiable and can be measured with precision.
30) Political risk, cultural issues, and exchange rates are among those ________ that affect which country
will be selected for a location decision.
31) Labor cost per unit is also referred to as ________.
32) ________ occurs when competing companies locate near each other because of a critical mass of
information, talent, venture capital, or natural resources.
33) Identify five factors that have fostered globalization.
34) Identify five factors that affect location decisions at the site level.
35) What is the role of labor productivity in location decisions?
36) What is the impact of exchange rates on location decisions?
37) Why is “quality of life” an element of intangible costs associated with location decisions? Provide an
example as part of your discussion.
38) “Proximity” or closeness implies that a firm should locate “close” to something. What are the three
kinds of proximity described in the text? What are the basic conditions under which each is appropriate?
What kinds of firms are likely to use each of these?
39) What is it called when competing companies locate next to each other? Why do they do this?
Section 3 Methods of Evaluating Location Alternatives
1) The graphic approach to locational cost-volume analysis displays the range of volume over which each
location is preferable.
2) The factor-rating method can consider both tangible and intangible costs.
3) The center-of-gravity method finds the location of a centralized facility, such as a distribution center,
that will maximize the organization’s revenue.
4) The transportation model calculates an optimal shipping system between a central facility and several
outlying customers.
5) Which of the following statements regarding the center–of-gravity method is FALSE?
A) It is designed to minimize the maximum possible travel distance to any of the locations.
B) The optimal x– and y-coordinates are calculated separately.
C) The optimal solution is unconstrained, so it could suggest a location in the middle of a body of water.
D) The weights used are the quantity of goods moved to or from each location.
E) The origin of the coordinate system and the scale used are arbitrary, just as long as the relative
distances are correctly represented.
6) Community attitudes, zoning restrictions, and quality of labor force are likely to be considered in
which of the following location decision methods?
A) transportation method
B) locational cost-volume analysis
C) center-of-gravity method
D) simulation
E) factor-rating method
7) Which of the following methods best considers intangible costs related to a location decision?
A) crossover methods
B) locational cost-volume analysis
C) factor-rating method
D) the transportation method
E) center-of-gravity method
8) Evaluating location alternatives by comparing their composite (weighted–average) scores involves
which of the following?
A) factor-rating analysis
B) cost-volume analysis
C) transportation model analysis
D) linear regression analysis
E) crossover analysis
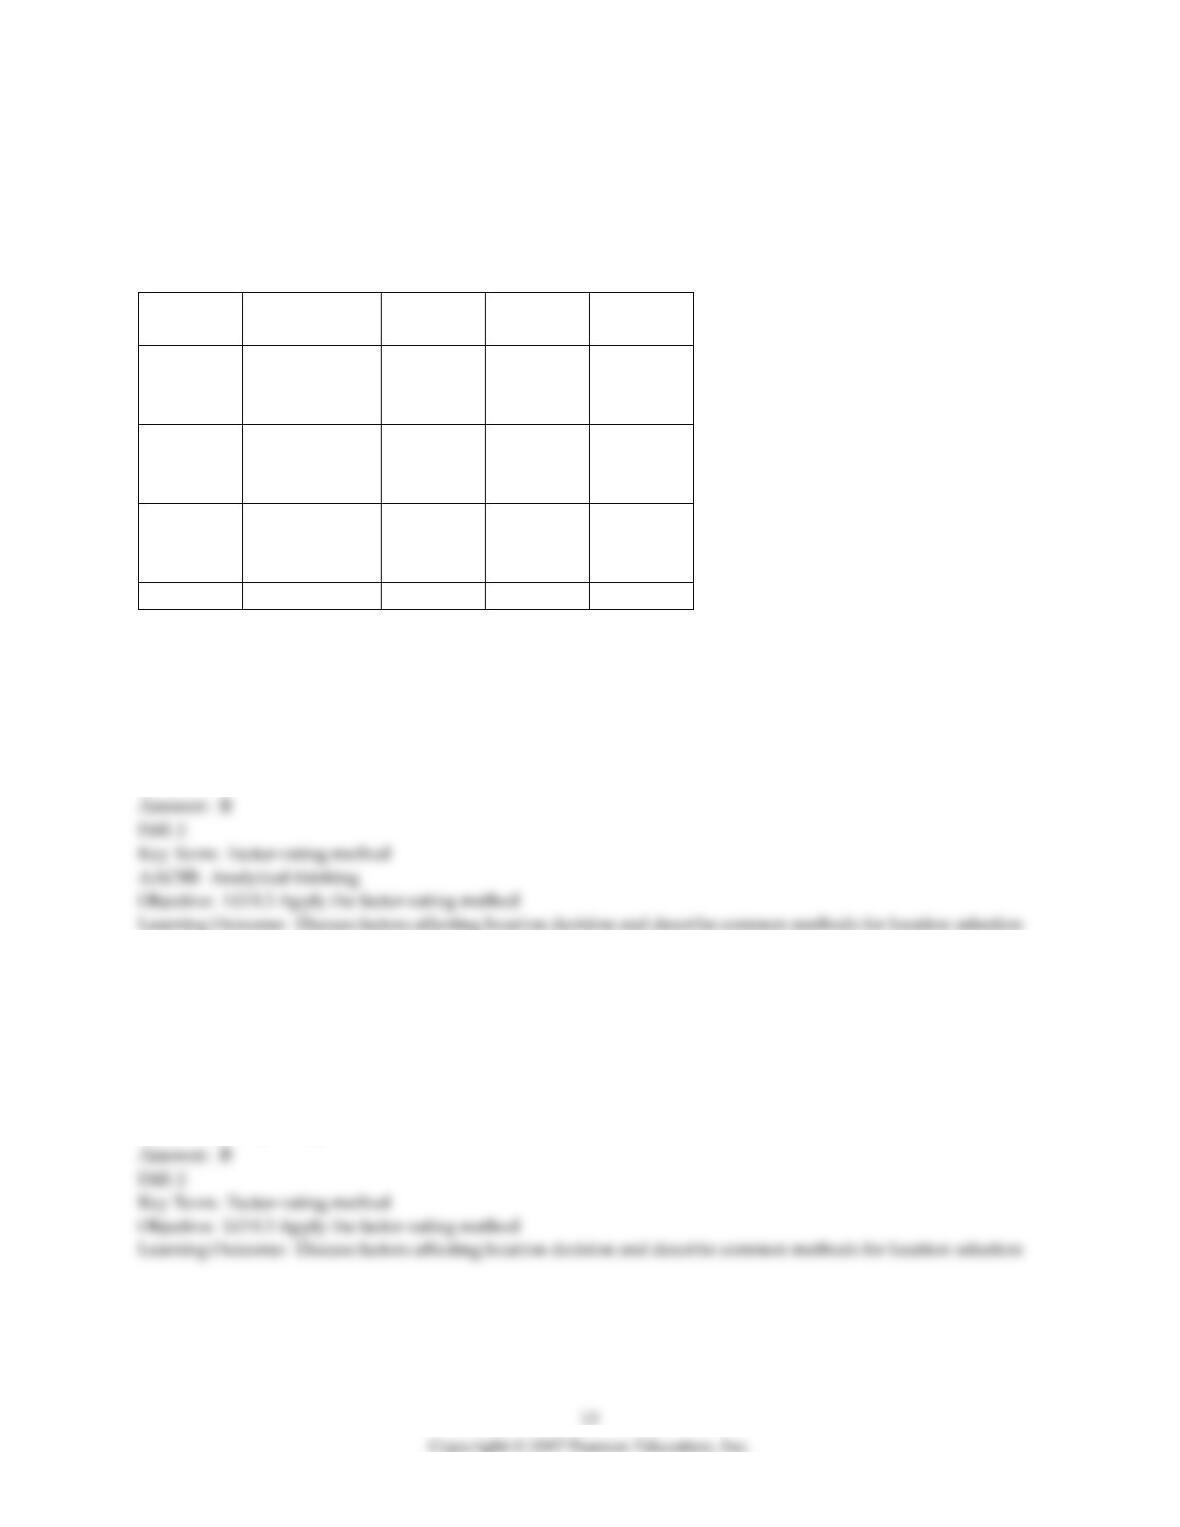
9) A clothing chain is considering two different locations for a new retail outlet. They have identified the
four factors listed in the following table as the basis for evaluation, and have assigned weights as shown.
The manager has rated each location on each factor, on a 100-point basis, as shown under the respective
columns for Barclay and Chester.
Factor
Factor
Description
Weight
Barclay
Chester
1
Average
community
income
.40
30
20
2
Community
growth
potential
.25
40
30
3
Availability of
public
transportation
.15
20
20
4
Labor cost
.20
10
30
What is the score for Chester?
A) 10.00
B) 24.50
C) 25.75
D) 27.00
E) 100.00
10) Which of the following is an approach to location analysis that includes both qualitative and
quantitative considerations?
A) locational cost-volume analysis
B) factor-rating method
C) transportation model
D) center-of–gravity method
E) make-or–buy analysis
11) On the crossover chart where the costs of two or more location alternatives have been plotted, the
quantity at which two cost curves cross is the quantity where:
A) fixed costs are equal for two alternative locations.
B) variable costs are equal for two alternative locations.
C) total costs are equal for all alternative locations.
D) fixed costs equal variable costs for one location.
E) total costs are equal for two alternative locations.
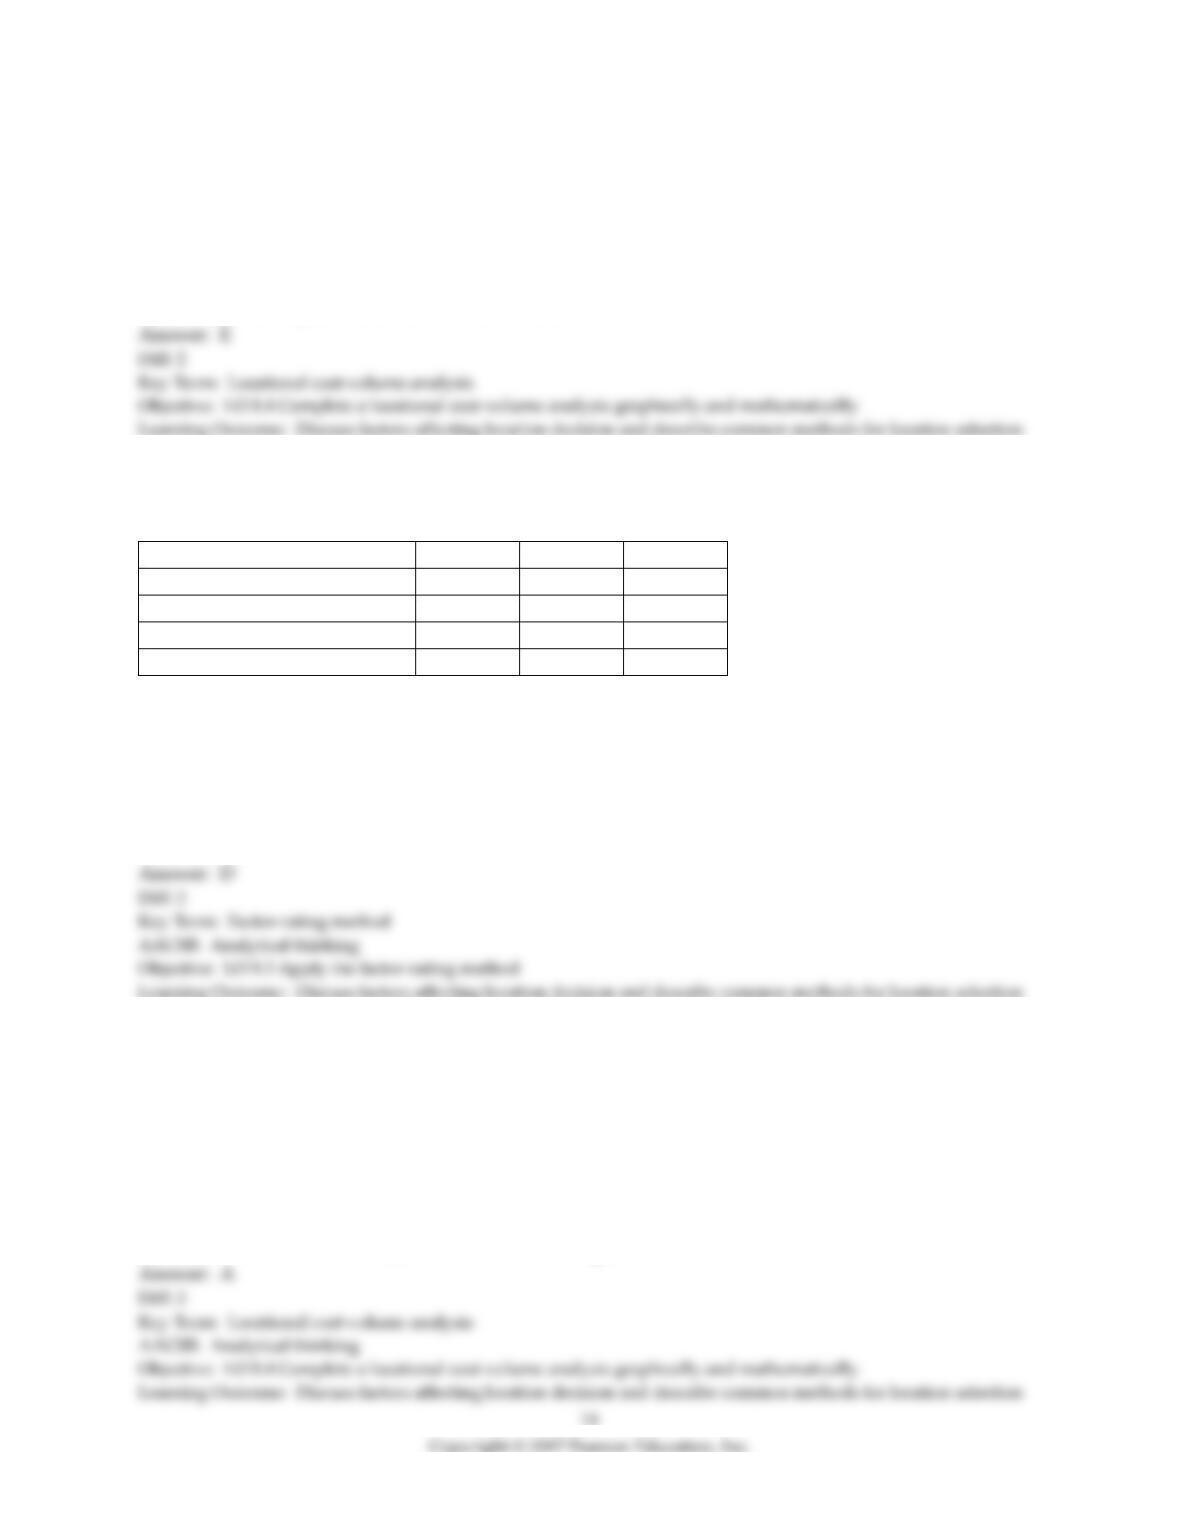
12) A full-service restaurant is considering opening a new facility in a specific city. The table below shows
its ratings of four factors at each of two potential sites.
Factor
Weight
Gary Mall
Belt Line
Affluence of local population
.20
30
30
Traffic flow
.40
50
20
Parking availability
.20
30
40
Growth potential
.20
10
30
The score for Gary Mall is ________ and the score for Belt Line is ________.
A) 120; 120
B) 22; 24
C) 18; 120
D) 34; 28
E) none of the above
13) A firm is considering two location alternatives. At location A, fixed costs would be $4,000,000 per
year, and variable costs $0.30 per unit. At alternative B, fixed costs would be $3,600,000 per year, with
variable costs of $0.35 per unit. If annual demand is expected to be 10 million units, which plant offers the
lowest total cost?
A) Plant A, because it is cheaper than Plant B for all volumes over 8,000,000 units.
B) Plant B, because it is cheaper than Plant A for all volumes over 8,000,000 units.
C) Plant A, because it is cheaper than Plant B for all volumes.
D) Plant B, because it has the lower variable cost per unit.
E) Neither Plant A nor Plant B, because the crossover point is at 10 million units.
14) The center–of-gravity method is used primarily to determine what type of locations?
A) service locations
B) manufacturing locations
C) distribution center locations
D) supplier locations
E) call center locations
15) A regional bookstore chain wants to build a distribution center that is centrally located for its eight
retail outlets. It will most likely employ which of the following tools of analysis?
A) assembly line balancing
B) load-distance analysis
C) center-of-gravity method
D) linear programming
E) locational cost-volume analysis
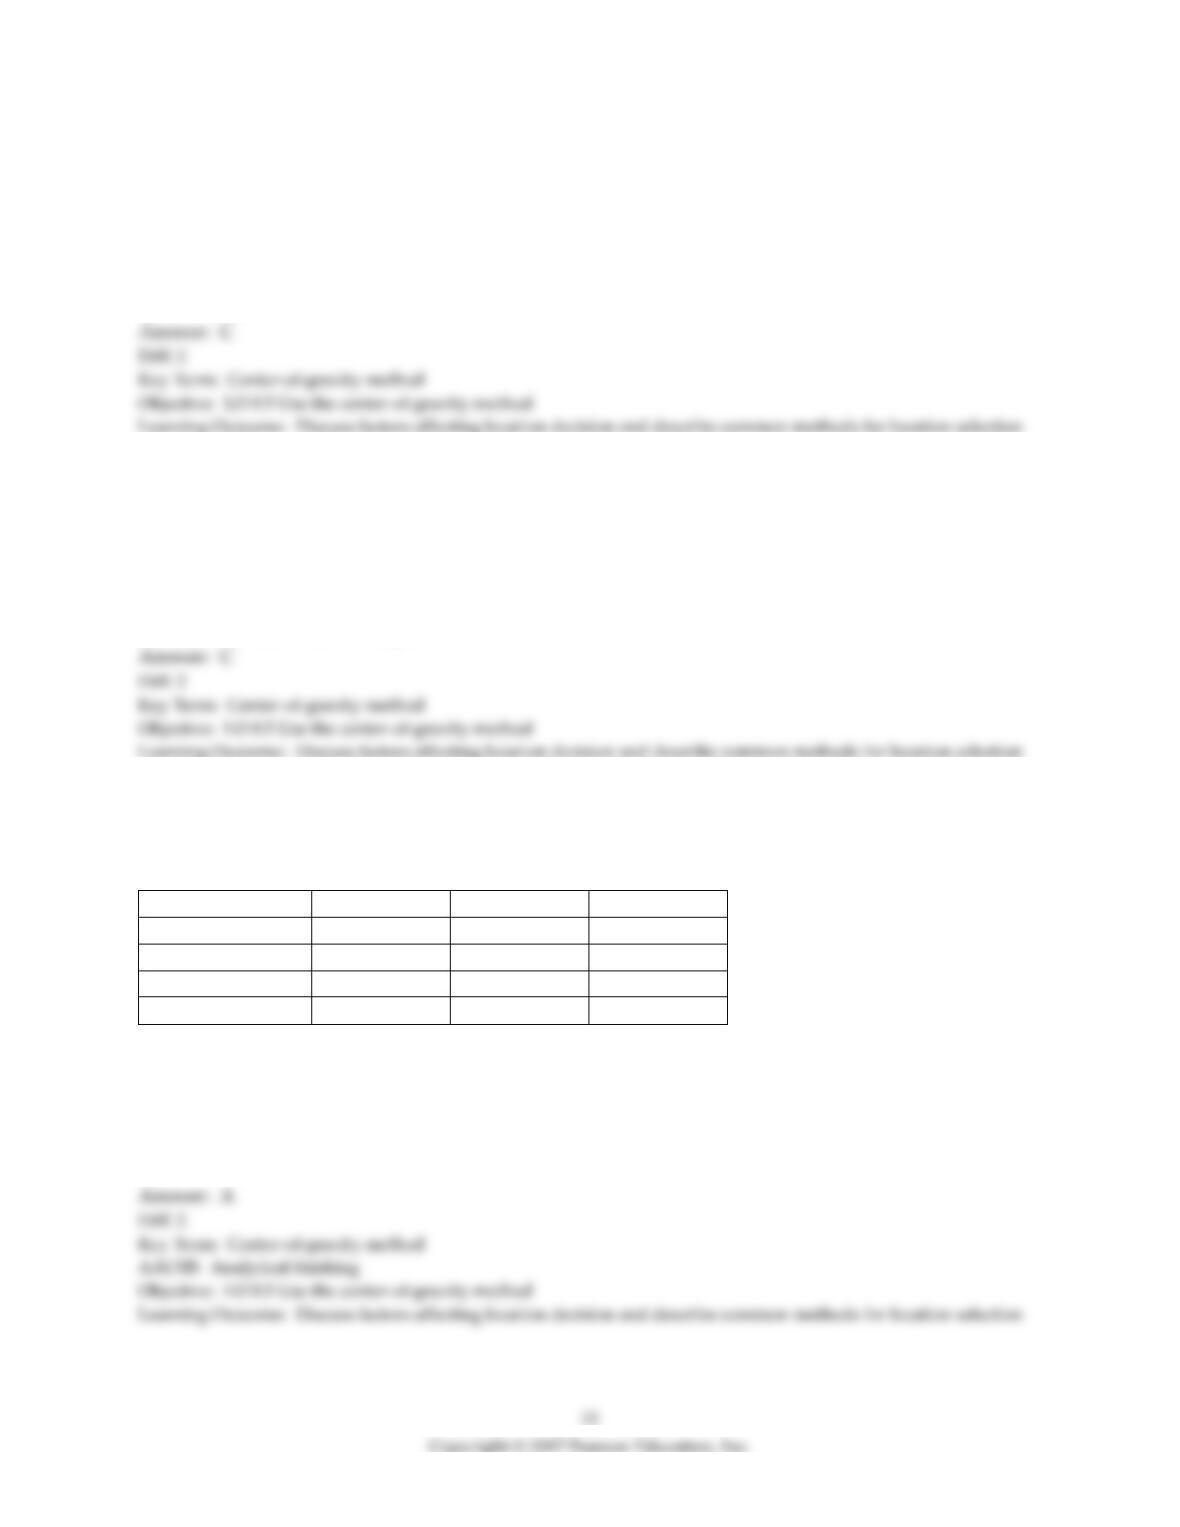
16) East Texas Seasonings is preparing to build one processing center to serve its four sources of
seasonings. The four source locations are at coordinates shown below. Also, the volume from each source
is provided. What is the center of gravity?
X-coordinate
Y-coordinate
Volume
Athens, Texas
30
30
150
Beaumont, Texas
20
10
350
Carthage, Texas
10
70
100
Denton, Texas
50
50
200
A) X = 28.125; Y = 31.25
B) X = 22000; Y = 24000
C) X = 27.5; Y = 40
D) center of gravity = 28
E) X = 25; Y = 40
17) A county wants to build one centrally-located processing facility to serve the county’s four recycling
drop-off locations. The four drop-offs have characteristics as given in the table below. What is the
approximate center of gravity of these four locations?
Location
X-coordinate
Y-coordinate
Tonnage
Drop-off point A
1
8
10
Drop-off point B
6
7
35
Drop-off point C
6
2
25
Drop-off point D
4
7
50
A) (4.75, 6.04)
B) (17, 24)
C) (33.5, 135.4)
D) (6, 4.25)
E) (570, 725)
18) Production and transportation costs are always considered in which of the following location decision
methods?
A) traffic counts
B) transportation model
C) purchasing power
D) proximity of markets
E) clustering
19) The transportation model, when applied to location analysis:
A) minimizes total fixed costs.
B) minimizes total production and transportation costs.
C) minimizes total transportation costs.
D) maximizes revenues.
E) minimizes the movement of goods.
20) The ________ method is popular because a wide variety of factors, from education to recreation to
labor skills, can be objectively included.
21) The ________ is a mathematical technique used for finding the best location for a single distribution
point that services several stores or areas.
22) The ________ is used to determine the best pattern of shipments from several points of supply to
several points of demand.
23) Identify the four major quantitative methods for solving location problems.
24) What are the advantages and disadvantages of the use of the factor-rating method?
25) What kinds of location decisions are appropriate for the use of locational cost-volume analysis? Write
a brief paragraph explaining how the method can assist an operations manager in choosing among
alternative sites in making a location decision.
26) What kinds of location decisions are appropriate for the use of center–of–gravity analysis? What
variable is being optimized in this analysis?
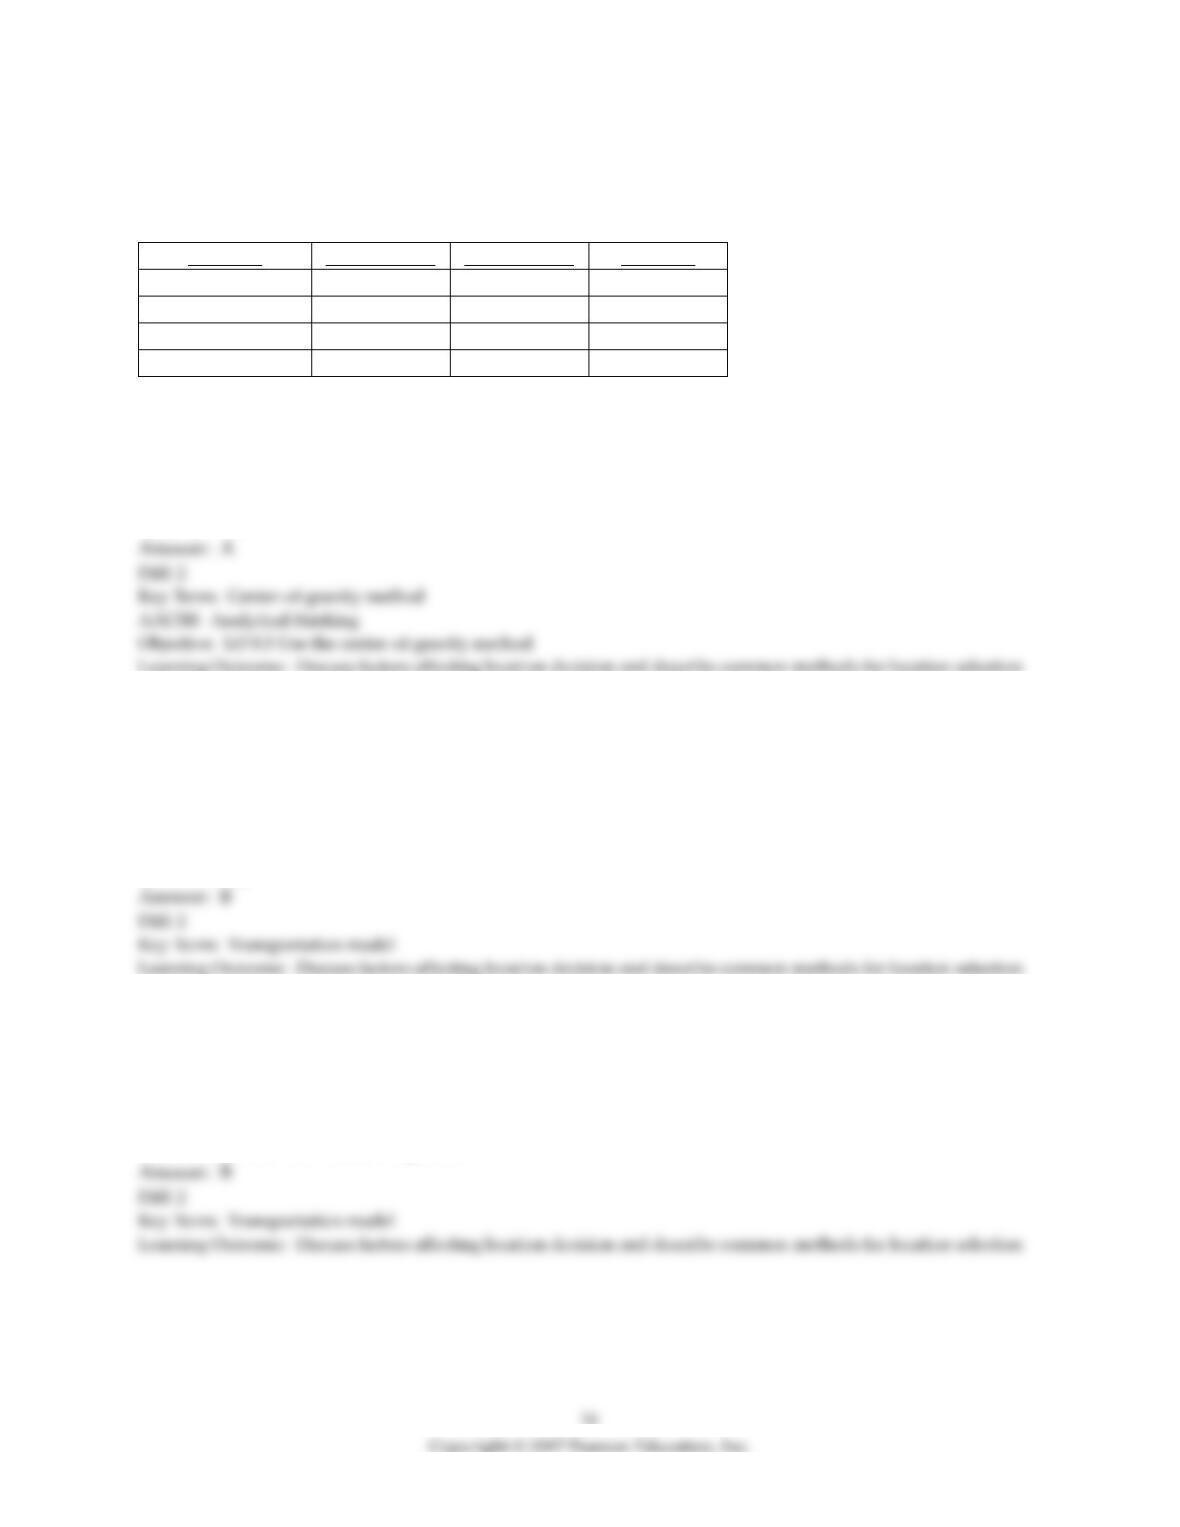
27) A manufacturing company preparing to build a new plant is considering three potential locations for
it. The fixed and variable costs for the three alternative locations are presented below.
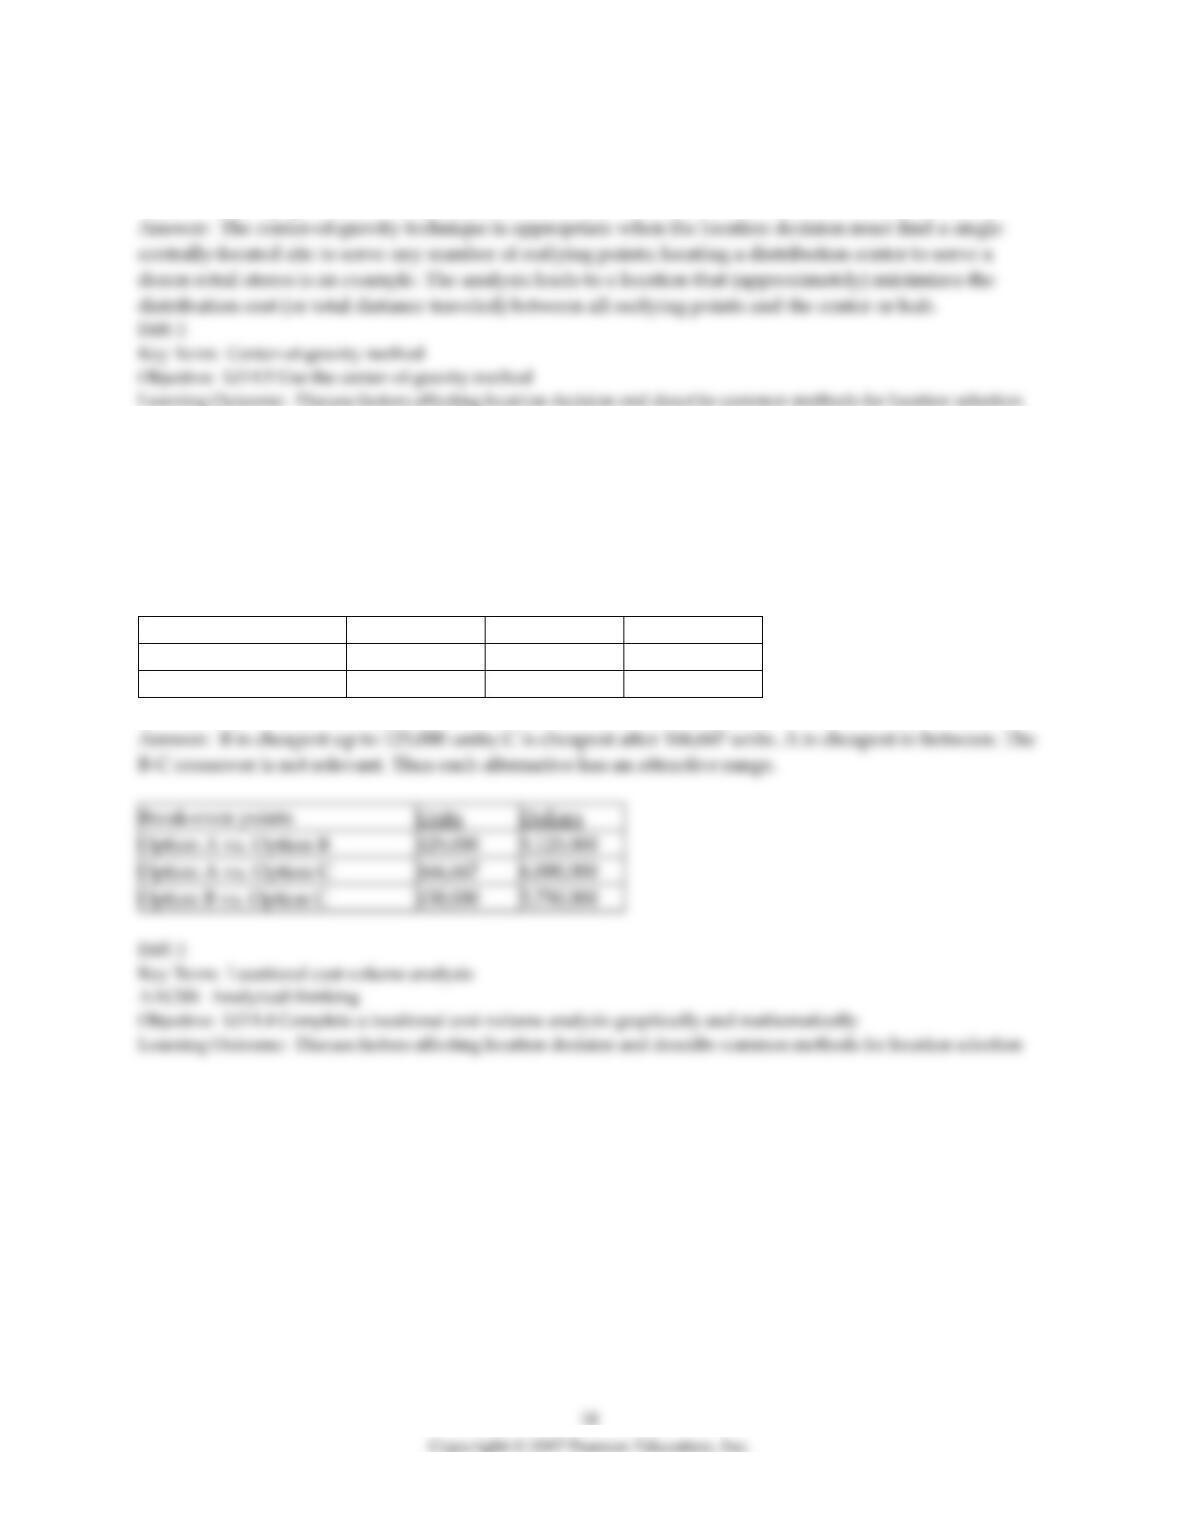
a. Complete a numeric locational cost-volume analysis.
b. Indicate over what range each of the alternatives A, B, C is the low-cost choice.
c. Is any alternative never preferred? Explain.
Costs
A
B
C
Fixed ($)
2,500,000
2,000,000
3,500,000
Variable ($ per unit)
21
25
15
Break-even points
Units
Dollars
Option A vs. Option B
125,000
5,125,000
Option A vs. Option C
166,667
6,000,000
Option B vs. Option C
150,000
5,750,000
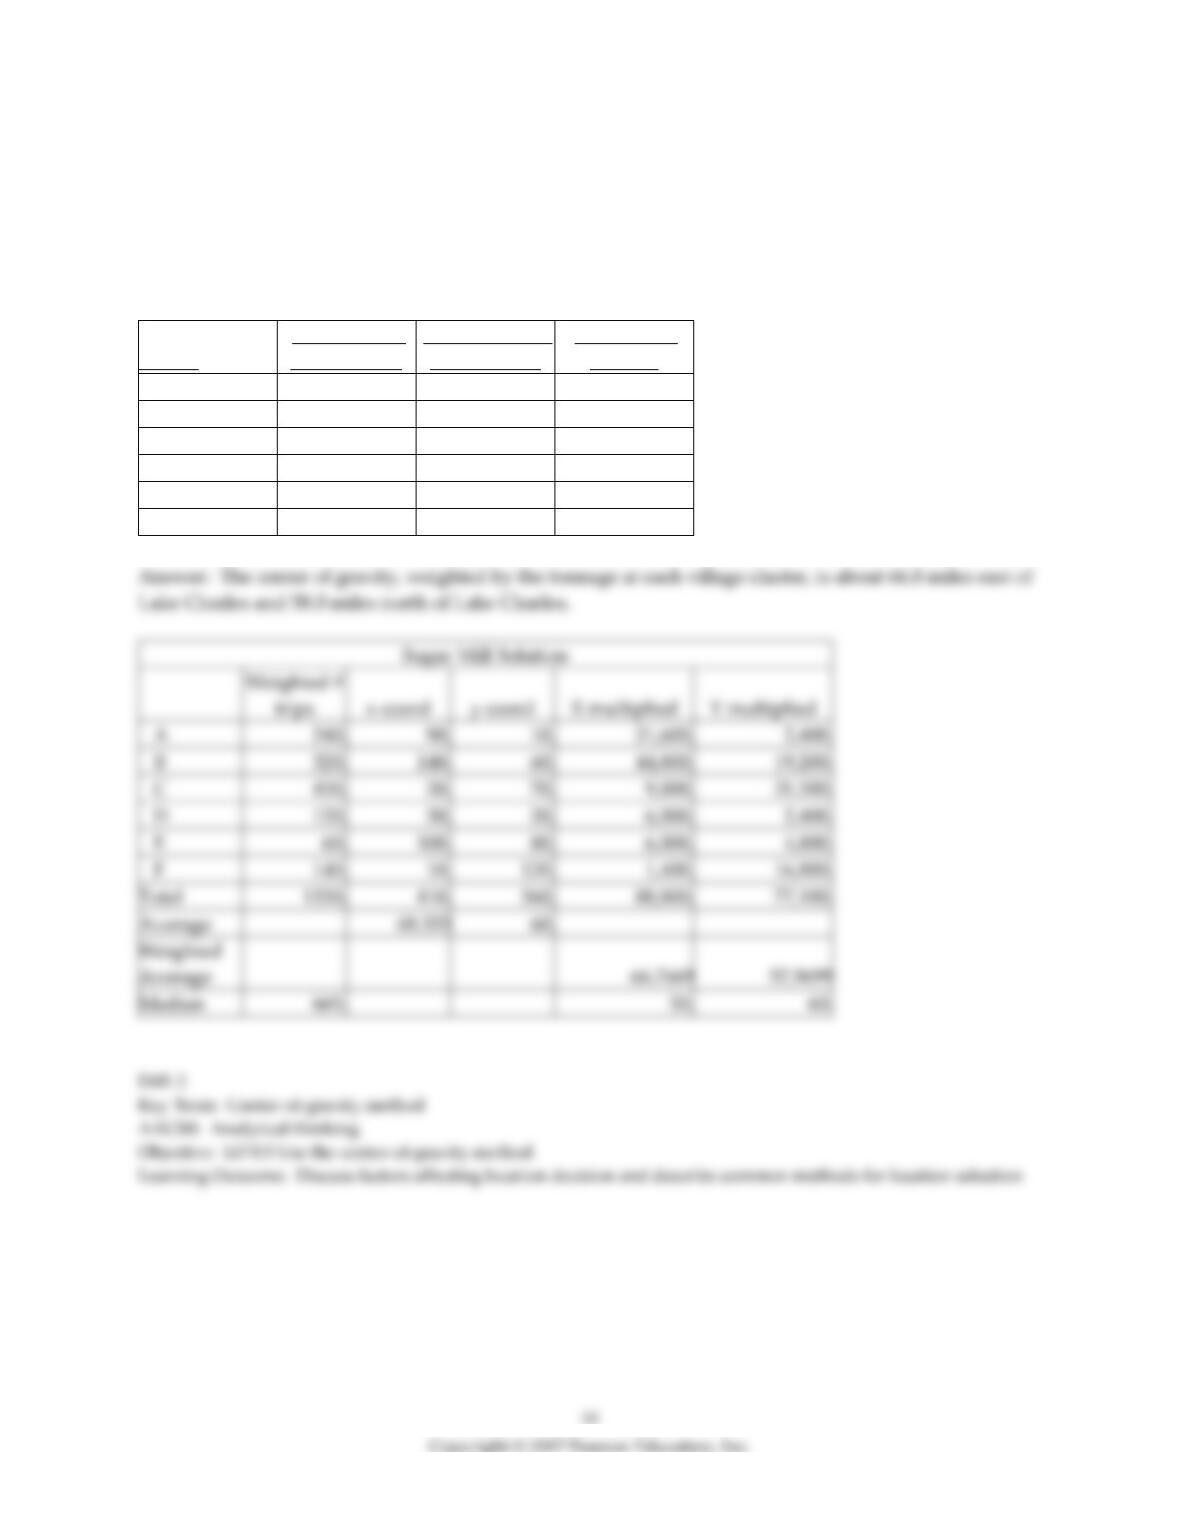
28) A farmers’ cooperative association plans to build a new sugar mill in Southwestern Louisiana. The
primary objective of the mill is to provide the farmers with a place to take their crop for processing that
will reduce their transportation costs. The members of the co-op believe that the center-of-gravity method
is appropriate for this objective. While there are over 200 sugar cane farms in the region, they are tightly
clustered around six villages. Using the data below, use the center-of-gravity method to calculate the
coordinates of the best location for this mill. All mileage references use the city of Lake Charles as (0,0).
Village
Miles East of
Lake Charles
Miles North of
Lake Charles
Sugar Cane
tonnage
Arceneaux
90
10
240,000
Boudreaux
140
60
320,000
Cancienne
20
70
450,000
Darbonne
50
20
120,000
Evangeline
100
80
60,000
Fontenot
10
120
140,000
Total
1330.
Average
Average
Median
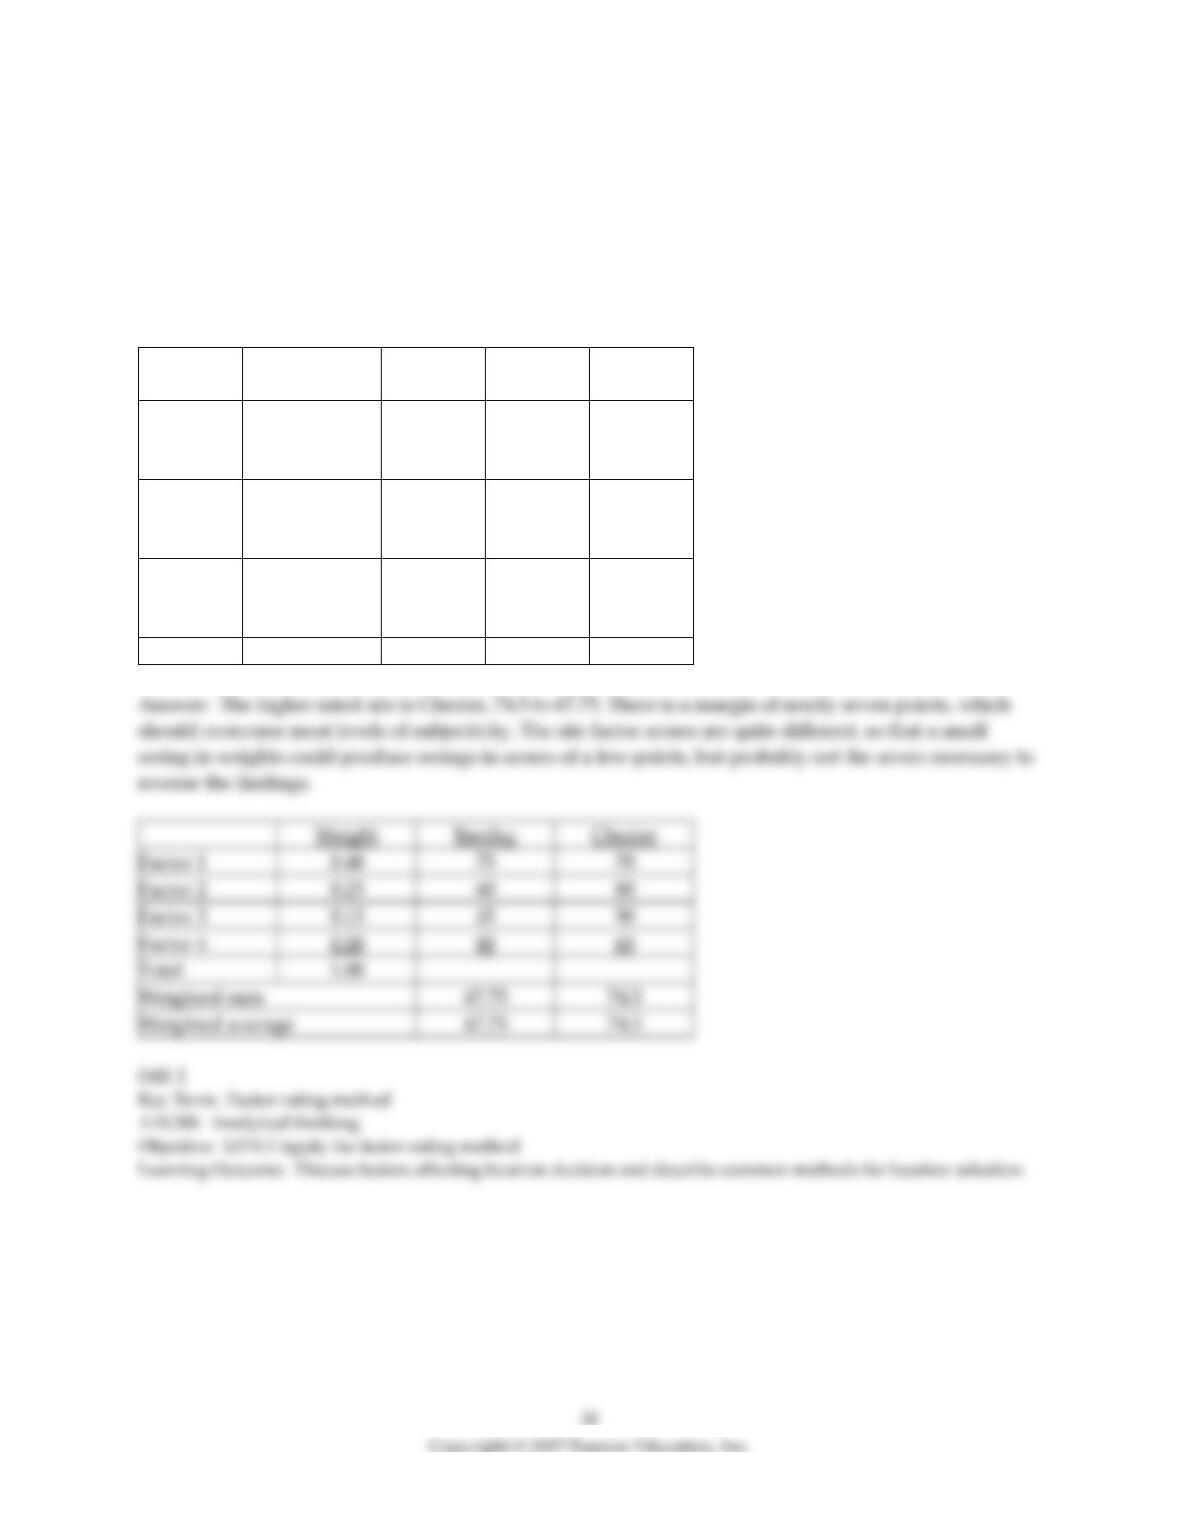
29) A clothing chain is considering two different locations for a new retail outlet. The organization has
identified the four factors listed in the following table as the basis for evaluation, and it has assigned
weights as shown. The manager has rated each location on each factor, on a 100-point basis (higher scores
are better), as shown under the respective columns for Barclay and Chester.
a. Calculate the composite score for each alternative location.
b. Which site should be chosen?
c. Are you concerned about the sensitivity and subjectivity of this solution? Comment.
Factor
Factor
Description
Weight
Barclay
Chester
1
Average
community
income
.40
75
70
2
Community
growth
potential
.25
60
80
3
Availability of
public
transportation
.15
45
90
4
Labor cost
.20
80
60
Factor 1
Factor 2
Factor 3
Factor 4
Total
Weighted sum
67.75
Weighted average
67.75