CHAPTER 7
FORECASTING
TRUE/FALSE QUESTIONS
1. If one uses a stationary linear forecasting model, the
forecast for period t + 1 will not necessarily be the same as the
2. Autocorrelation measures only how the value in one time period
3. The “weights” in the weighted moving average method are
unequal and typically decrease with the age of the observation.
4. In exponential smoothing, if the smoothing constant, alpha, is
1, you will get the same forecast as obtainable using the last
5. In exponential smoothing, if the smoothing constant, alpha, is
6. All four measures of forecast error, MSE, MAD, MAPE, and LAD,
7. In exponential smoothing, the initial forecast must be derived
8. If a time series is believed to exhibit non-linear trend, one
should use Holt’s exponential smoothing technique on the original
9. In the multiple regression approach to forecasting models with
trend and seasonal effects, there are as many dummy variables
10. A business experiencing stationary demand does not need
11. In a stationary forecasting model, the value of the time
series for a specific period equals the unchanging mean value of the
12. For a moving average, the more past data used, the better.
13. If positive autocorrelation exists, the exponential smoothing
constant should be close to zero to track changes in the time series
14. Linear trend forecasting models cannot be applied to a time
15. Multiple regression can be used for models built on multiple

MULTIPLE CHOICE QUESTIONS
1. The “weights” in the weighted moving average need not:
a. be non-negative.
b. sum to 1.
c. give the most recent value the least weight.
d. all be unequal.
2. Time series analysis:
a. attempts to use historic values to forecast future
values.
b. does not involve regression analysis.
c. eliminates autocorrelation.
d. assumes random variation is zero.
3. A stationary forecasting model is appropriate for a time
series which exhibits primarily:
a. trend.
b. cyclical influences.
c. seasonal components.
d. random variation.
4. If the value of a variable at time t + 1 is partly determined
by its value at time t, this is called:
a. collinearity.
b. time series.
c. autocorrelation.
d. covariance.
5. Suppose that sales of a certain item for the months of January
through April were as follows: January – 50, February – 80, March –
70, and April – 60. Using a three month simple moving average, the
forecast for May would be:
a. 60.
b. 65.
c. 70.
d. 80.
6. RDN’s sales of cable modem in San Mateo, California, for the
months of January through April were as follows: January – 50,

February – 80, March – 70, and April – 60. Suppose exponential
smoothing is used with a smoothing constant, alpha, of .20. If the
forecast for January was 50, the forecast for May would be
approximately:
a. 58.
b. 59.
c. 60.
d. 63.
7. In the exponential smoothing (ES) technique, the value of
alpha, the smoothing constant:
a. may assume any non-negative value.
b. determines the forecasting model’s responsiveness to
abrupt changes.
c. typically is at the higher end in the range of possible
values.
d. is preset by the analyst and not subject to validity
testing.
8. As the smoothing constant, alpha, is reduced:
a. the forecasts are more sensitive to trend influences.
b. the weights given to prior periods’ data become more
uniform.
c. cyclical/seasonal factors are more easily discernible.
d. the computational complexity of forecasting increases.
9. June forecast: 71. June actual: 68. Alpha = 1.0. July’s
exponentially smoothed forecast is:
a. 68.
b. 71.
c. 70.7.
d. 68.3.
10. In situations where forecast errors are to be weighed in
proportion to their magnitude, the preferred performance evaluator
would most likely be:
a. MSE.
b. MAD.
c. MAPE.
d. LAD.
11. If it is suspected that the major influence in a stationary

time series is random variation, the preferable forecasting
technique would be the:
a. classical decomposition.
b. moving average method.
c. Holt’s linear exponential smoothing technique.
d. linear regression.
12. Holt’s linear exponential smoothing technique for forecasting
time series with trend:
a. results in separate forecasts for level (L) and trend
(T).
b. is relevant only for non-linear trend cases.
c. gives equal weight to all data points employed.
d. requires the retention of a large number of data points.
13. Selecting a forecasting technique for which the largest
absolute deviation is minimized is similar to which decision
analysis approach?
a. Maximin.
b. Minimax.
c. Minimax regret.
d. Maximax.
14. Which of the following is a qualitative technique in which a
forecast is selected based on the likelihood of the assumptions
used?
a. Scenario writing.
b. Delphi technique.
c. Multiple regression.
d. Box-Jenkins method.
15. Phil Johnston rides his bicycle to deliver newspapers to his
neighborhood. Some customers take weekend trips and put their news
delivery on hold. This is an example of:
a. long term trend.
b. seasonal variation.
c. cyclical variation.
d. random effects.
16. Phil Johnston’s newspaper route includes a new housing
development. As families move in, his business increases. This is
an example of:

a. long term trend.
b. seasonal variation.
c. cyclical variation.
d. random effects.
17. In January, Phil Johnston’s newspaper route added two
customers who used to subscribe to the evening paper. In February,
Phil lost a customer who decided to get his news off the internet.
This is an example of:
a. long term trend.
b. seasonal variation.
c. cyclical variation.
d. random effects.
18. For a month following a presidential illness, very few homes
were sold. Afterwards, the realty business returned to normal
levels. This is an example of:
a. long term trend.
b. seasonal variation.
c. cyclical variation.
d. random effects.
19. What is not involved in the initial form hypothesis step of
the time series forecasting process?
a. Graphing.
b. Statistical verification of the hypothesis.
c. Calculating the value of parameters.
d. Gathering data.
20. How can cyclical components of a time series be identified?
a. Autocorrelation test.
b. Graphically.
c. Linear regression.
d. Cyclical effects cannot be detected.
SHORT ANSWER QUESTIONS
1. What are the key issues in determining which forecasting
technique to use for a stationary time series?
2. One of the measures for evaluating forecast errors is the Mean
Squared Error (MSE), in which differences between forecasted and
actual values are squared. Why is this a desirable trait?
3. Given below are the monthly actual sales of Wangdoodles for
December of one year and the first six months of the following year.
Also given are three sets of forecast numbers:
F(1): the last period technique.
F(2): a three-month weighted moving average, with weights of: 50%
for the most recent month; 35% for the previous month; and 15%
for the month before that.
F(3): an exponentially smoothed average with = 0.20.
Month Actual F(1) F(2) F(3)
Dec 251
Jan 255 251 259 260
Feb 279 255 257 259
Mar 267 279 262 262
Apr 287 267 267 263
May 263 287 278 267
Jun 270 263 272 266
A. Fill in July’s forecasted sales, using each of the three
forecasting techniques.
B. Which of the three forecasting methods do you prefer? Why?
4. What are the three steps in the time series forecasting
process?
5. How do you use the p-value and the significance (or
confidence) level to check for trend in a time series?
6. When a stationary model is used, the forecast for the next
time period is also the forecast for all future time periods. If
the model is accurate, what could cause future forecasts to change?
7. What value of makes exponential smoothing equivalent to a
moving average based on 4 periods of data?
8. What parameters does the modeler have to select for a moving
average, a weighted moving average, and exponential smoothing?
9. Identify four key issues in the selection of a forecasting
technique for a stationary time series.
10. Define classical decomposition.
11. What is the Box-Jenkins method?
12. What are the advantages of the Last Period technique for a
stationary time series?
FORMULATION/SOLUTION/ANALYSIS QUESTIONS
1. Consider the following time series representing monthly sales
of dishwashers at Big Boys Appliances over the past twelve months:
Month Sales Month Sales Month Sales
January 24 May 33 September 28
February 27 June 29 October 30
March 22 July 26 November 29
April 24 August 25 December 26
A. What is the forecast over the next six months assuming Big
Boys uses a four month simple moving average?
B. If Big Boys is interested in selecting the technique which
minimizes mean squared error, should it use a three month or a four
month simple moving average.
C. If Big Boys is interested in selecting the technique which
minimizes the mean absolute deviation, should it use a four month
moving average with weights of .4, .3, .2, and .1 or exponential
smoothing with a smoothing constant of .2?
D. Determine the optimal smoothing constant Big Boys should use
if it wishes to use exponential smoothing and wants to minimize the
mean squared error.
2. Consider the following time series representing home satellite
dish installations by Big Boys Appliances over the past twelve
months:
Month Installations Month Installations Month Installations
January 14 May 22 Sept. 38
February 19 June 29 October 30
March 22 July 33 November 29
April 25 August 35 December 42
A. Using linear regression, determine the forecast for the
upcoming six months.
B. Using Holt’s method, determine the forecast for the upcoming
six months. Assume that a smoothing constant of .40 is used for the
time series level and a smoothing constant of .20 is used for the
C. Which technique, linear regression or Holt’s using the
smoothing constants given in part B, gives the lower mean squared
error?
D. Why should the result you found in part C not surprise you?
3. The quarterly revenue (in $1,000’s) at the Dew Drop Inn over
the past three years has been:
Year
1 2 3
1 32 38 40
Quarter 2 42 44 48
3 28 39 45
4 66 62 72
A. Using the classical decomposition method, forecast the
quarterly revenues for year 4.
B. Using the additive model approach, forecast the quarterly
4. The quarterly earnings per share for a consumer goods producer
over the past four years has been:
Year
1 2 3 4
1 $.33 $.43 $.54 $.59
Quarter 2 $.35 $.40 $.52 $.62
3 $.37 $.45 $.56 $.64
4 $.42 $.48 $.55 $.66
A. Does the data appear to exhibit autocorrelation of lag 4?
B. Which technique do you think would be more appropriate for
C. Select a forecasting technique that you feel would be
appropriate, and forecast the quarterly earnings per share in year
5. Explain why you selected this method.
5. Weekly sales of Maytag Neptune washing machines over the past
sixteen weeks at Pacific Sales Appliance have been as follows:
Week Sales Week Sales Week Sales Week Sales
1 6 5 8 9 11 13 14
2 8 6 10 10 15 14 17
3 5 7 12 11 12 15 16
4 9 8 9 12 14 16 14
A. Would you conclude that the time series exhibits trend?
B. If the answer to part A. is no, use exponential smoothing to
forecast sales in week 17; if the answer to part A is yes, use
Holt’s method to forecast sales in week 17. In either case,
6. Weekly sales of Maytag Neptune washing machines over the past
sixteen weeks at Pacific Sales Appliance have been as follows:
Week Sales Week Sales Week Sales Week Sales
1 6 5 8 9 11 13 14
2 8 6 10 10 15 14 17
3 5 7 12 11 12 15 16
4 9 8 9 12 14 16 14
Using linear regression, forecast the weekly sales in week 30.
7. Daily bread sales at Steve’s SuperValue for the past four
weeks have been as follows:
Week
1 2 3 4
Monday 110 90 124 110
Tuesday 125 115 106 132
Wednesday 140 169 154 148
Thursday 126 120 136 122
Friday 144 136 150 148
Saturday 210 196 225 204
Sunday 80 95 87 100
The manager of the SuperValue does the forecasting of weekly bread
sales by dividing the week into three periods: Monday – Friday,
Saturday, and Sunday. The average daily Monday – Friday sales
during the four week period was as follows:

8. Daily sandwich sales at Cosmo’s Sub Shop for the past four
weeks have been as follows:
Week
1 2 3 4
Monday 110 90 124 110
Tuesday 125 115 106 132
Wednesday 140 169 154 148
Thursday 126 120 136 122
Friday 144 136 150 148
A. Suppose the manager uses exponential smoothing to forecast
future sandwich sales. What is the optimal smoothing constant if
the smoothing constant is selected to minimize the mean squared
error?
B. Suppose the smoothing constant found in part A is used to
perform the forecasting. What is the forecast for the average daily
sandwich sales in week 6?
C. Suppose the smoothing constant found in part A is used to
perform the forecasting. What is the largest absolute deviation
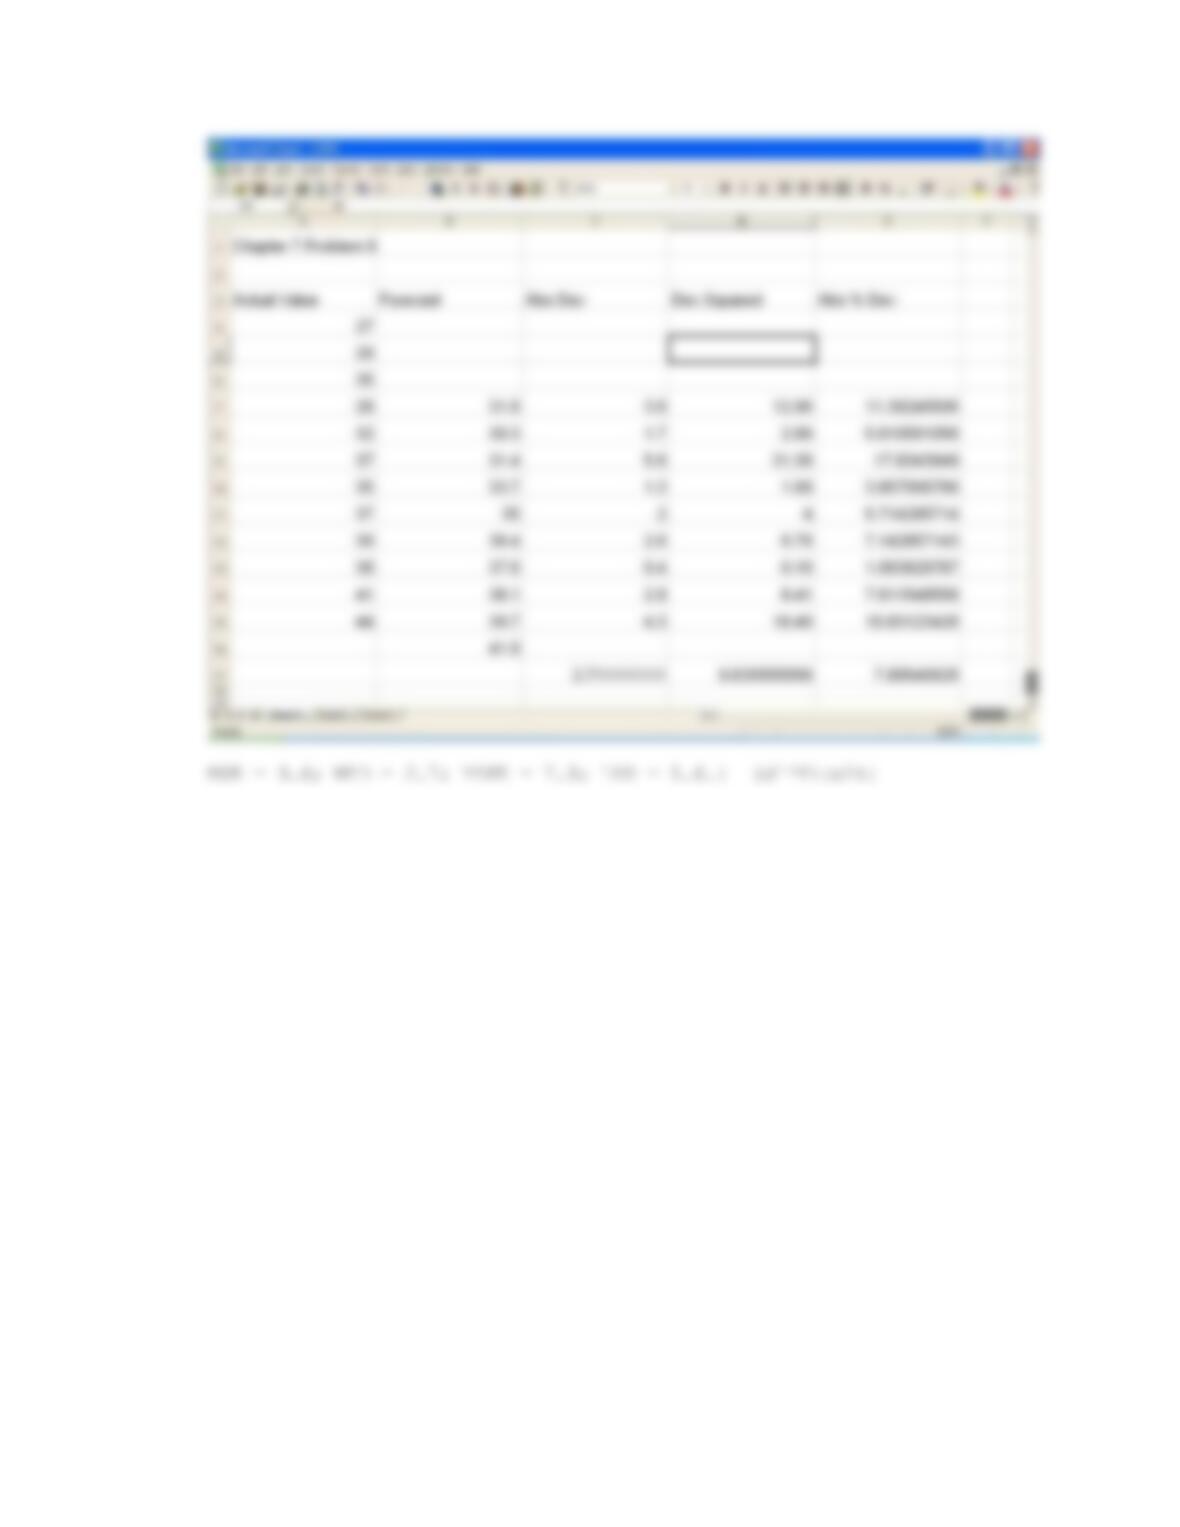
9. Below is a chart of potholes repaired in Sunnyside Township.
Year
Potholes
Year
Potholes
1990
27
1996
35
1991
29
1997
37
1992
35
1998
39
1993
28
1999
38
1994
32
2000
41
1995
37
2001
44
A. Using a three period weighted moving average with weights of
B. Compute MSE, MAD, MAPE, and LAD.
(
10. Below is a record of the number of individuals signed up by
the Army recruiting office in the Hyde Park section of Chicago.
January
8
May
17
September
13
February
12
June
16
October
16
March
15
July
21
November
12
April
11
August
7
December
11
A. Using Excel’s linear regression, forecast the expected total
for the next two months and generate Excel’s summary output.
(