
Name:
Class:
Date:
chapter 6
Copyright Cengage Learning. Powered by Cognero.
Page 1
Indicate whether the statement is true or false.
1. The Histogram tool provides the basic statistical measures of location, dispersion, and shape.
a.
True
b.
False
2. Two events are independent if they have no outcomes in common.
a.
True
b.
False
3. The median specifies the middle value when the data are arranged from smallest to largest.
a.
True
b.
False
4. The square of the correlation coefficient is called the coefficient of determination.
a.
True
b.
False
5. Products are boxed in groups of 25. Drawing a sample of boxes and inspecting all units in the boxes selected is an
example of systematic sampling.
a.
True
b.
False
6. In general, an experiment with m factors at k levels would have km combinations.
a.
True
b.
False
7. When interactions are present in an experiment, main effects have little meaning.
a.
True
b.
False
8. The Data Validation Toolpak in Microsoft Excel for Windows provides many procedures for conducting statistical
analyses.
a.
True
b.
False
9. Distributions with values of coefficient of kurtosis (CK) greater than 3 are more peaked with less dispersion.
a.
True
b.
False
10. The number of defects observed in a sample is an example of a continuous random variable.
a.
True
b.
False
11. In hypothesis testing, the null hypothesis, H0, is assumed to be false in the absence of contradictory data.
a.
True
Name:
Class:
Date:
chapter 6
Copyright Cengage Learning. Powered by Cognero.
Page 2
b.
False
12. The Poisson distribution is closely related to the binomial distribution.
a.
True
b.
False
13. The collection of all possible outcomes of an experiment is called an event.
a.
True
b.
False
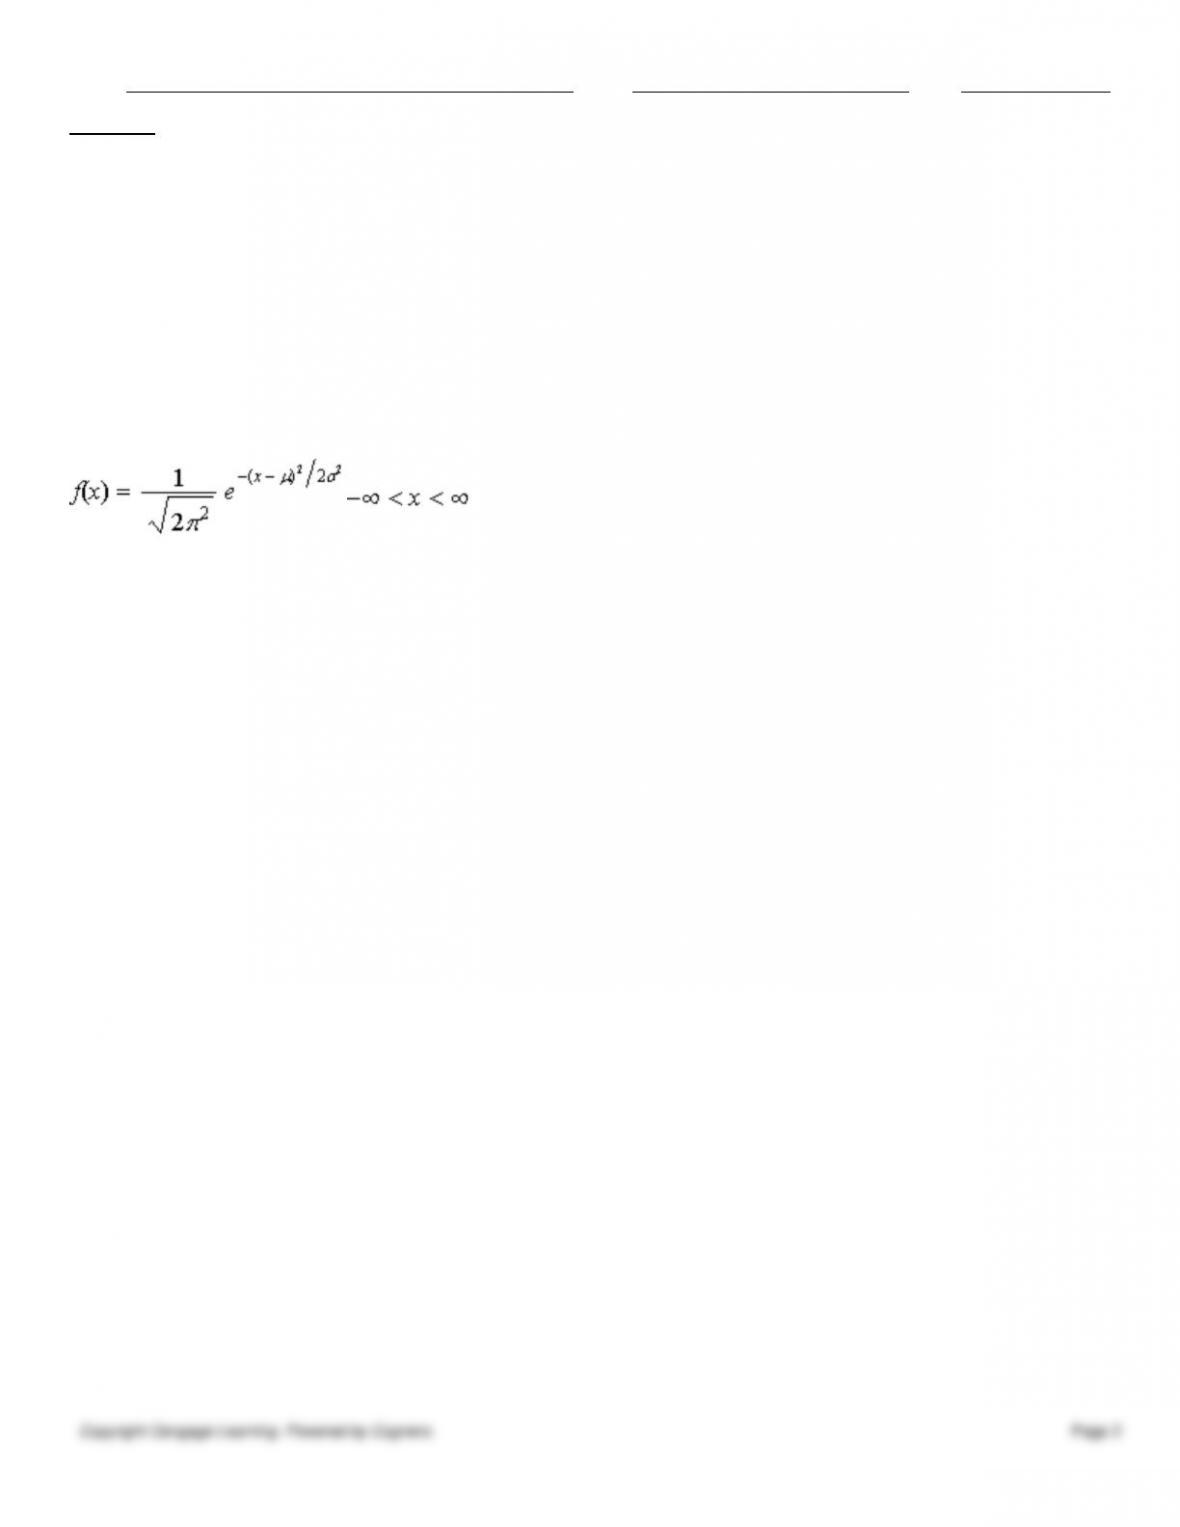
14. The probability density function for the normal distribution is
.
a.
True
b.
False
15. The variance is the simplest measure of dispersion and is computed as the difference between the maximum value and
the minimum value in the data set.
a.
True
b.
False
16. As the sample size increases, the standard error of the mean increases, all else being held constant.
a.
True
b.
False
17. A frequency distribution is a table that shows the number of observations in each of several nonoverlapping groups.
a.
True
b.
False
18. A random variable is a numerical description of the outcome of an experiment.
a.
True
b.
False
19. The sum of the probabilities over all possible outcomes must be between 0 and 1.
a.
True
b.
False
20. Statistics is a science concerned with the collection, organization, analysis, interpretation, and presentation of data.
a.
True
b.
False
21. A confidence interval is an interval estimate of a population parameter that also specifies the likelihood that the
interval contains the true population parameter.
a.
True

Name:
Class:
Date:
chapter 6
Copyright Cengage Learning. Powered by Cognero.
Page 3
b.
False
22. All else being equal, as the confidence level increases, the confidence interval becomes larger
to provide higher levels of assurance that the interval contains the true population parameter.
a.
True
b.
False
23. Probability is the likelihood that an outcome occurs.
a.
True
b.
False
24. One of the major disadvantages of the Histogram tool is that the results are not dynamically linked to the data.
a.
True
b.
False
25. Correlation is a measure of a linear relationship between two variables, X and Y, and is measured by the (population)
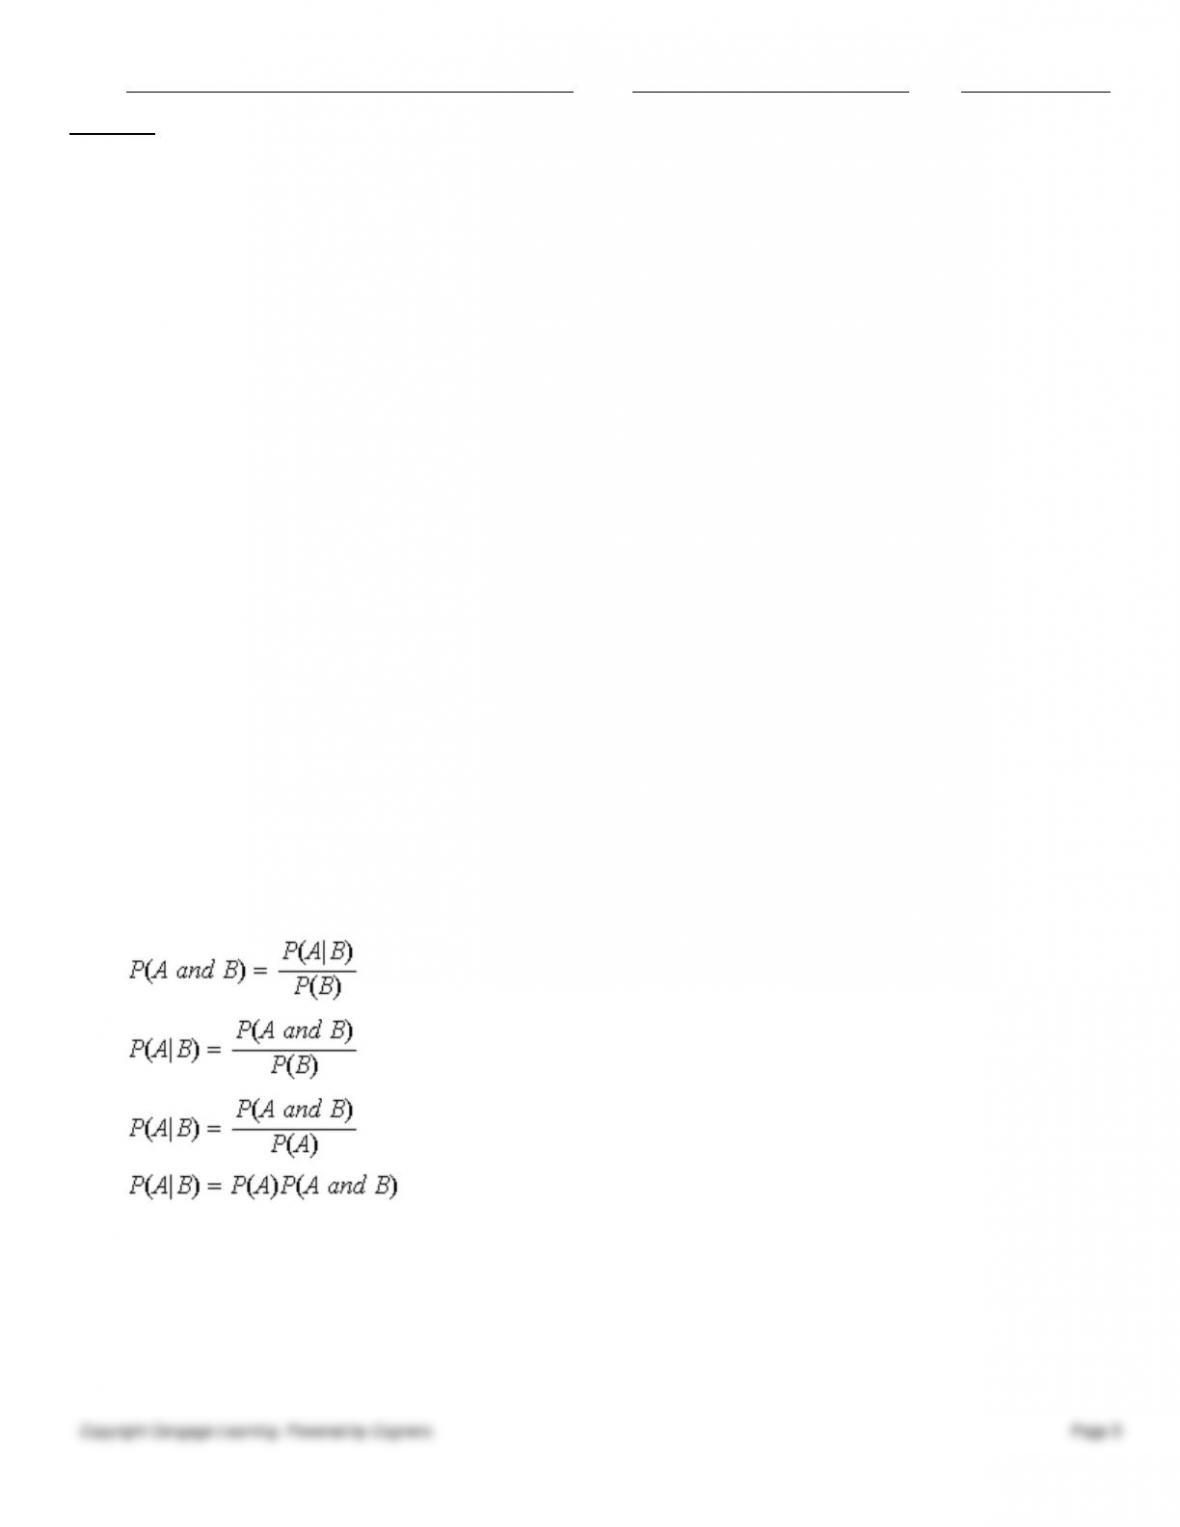
correlation coefficient.
a.
True
b.
False
26. Often, positively skewed data can be transformed to a normal distribution by using a mathematical transformation
such as taking logarithms.
a.
True
b.
False
Indicate the answer choice that best completes the statement or answers the question.
27. An experiment that evaluates the effect of two temperatures (100 and 200 degrees F) and two reaction times (45 and
95 minutes) on process yield has _____ possible combinations to test.
a.
two
b.
four
c.
six
d.
eight
28. Which of the following constitutes an approach to reducing sampling error?
a.
Providing statistical training to workers at all organizational levels
b.
Using user-friendly software for data analysis and visualization
c.
Taking a larger sample from the population
d.
Planning the sampling study carefully
29. _____ involve(s) drawing inferences about two contrasting propositions relating to the value of a population
parameter, one of which is assumed to be true in the absence of contradictory data.
a.
Probability distributions
b.
Hypothesis testing
c.
Descriptive statistics
d.
Predictive statistics

Name:
Class:
Date:
chapter 6
Copyright Cengage Learning. Powered by Cognero.
Page 4
30. A typical group is selected from the population, and a random sample is taken from within the group. This is an
example of _____ sampling.
a.
simple random
b.
cluster
c.
stratified
d.
judgment
31. A sample of size 16 is randomly selected from a population of size 90. What is the standard error of the mean if the
population standard deviation equals 20?
a.
2.11
b.
4.16
c.
4.56
d.
5.00
32. A testing engineer in a light bulb factory is planning a study to estimate the average life of a large shipment of light
bulbs. The engineer wants to estimate the average life within plus or minus 16 hours with 95 percent confidence.
Assuming a process standard deviation of 90 hours, what is the sample size for this study?
a.
7
b.
43
c.
58
d.
122
33. The collection of all possible outcomes of an experiment is called the
a.
event.
b.
population.
c.
random variable.
d.
sample space.
34. Which of the following requires the opinion of an expert to determine the location and characteristics of a definable
sample group?
a.
Judgment sample
b.
Simple random sample
c.
Systematic sample
d.
Stratified sample
35. _____ is the process of drawing conclusions about unknown characteristics of a population from which data were
taken.
a.
Descriptive statistics
b.
Regression analysis
c.
Statistical inference
d.
Correlation analysis
36. A perfume bottle is designed to have a capacity of 15 ounces. There is variation in the bottle manufacturing process.
Based on historical data, let’s suppose that the bottle capacity can be reasonably modeled by a normal distribution with a
mean of 15 ounces and a standard deviation of 0.2 ounces. What proportion of these bottles will have a capacity between
Name:
Class:
Date:
chapter 6
Copyright Cengage Learning. Powered by Cognero.
Page 5
14.7 and 15.1 ounces?
a.
0.3830
b.
0.6247
c.
0.8664
d.
0.9876
37. _____ is a test or series of tests that enables the experimenter to compare two or more methods to determine which is
better or determine levels of controllable factors to optimize the yield of a process or minimize the variability of a
response variable.
a.
A designed experiment
b.
Hypothesis testing
c.
Kurtosis
d.
Regression
38. To improve the quality of the wave soldering process at the Hewlett-Packard India, Ltd., plant through design of
experiments (DOE), _____ factors at _____ levels were selected?
a.
seven; two
b.
six; three
c.
seven; three
d.
three; two
39. Partitioning a population into hierarchical groups or levels and selecting a sample from each group is known as
a.
simple random sampling.
b.
stratified sampling.
c.
systematic sampling.
d.
cluster sampling.
40. The conditional probability of an event A given that event B is known to have occurred is given by
a.
.
b.
.
c.
.
d.
.
41. The sampling method where every item in the population has an equal probability of being selected is called
a.
simple random sampling.
b.
cluster sampling.
c.
systematic sampling.
d.
judgment sampling.

Name:
Class:
Date:
chapter 6
Copyright Cengage Learning. Powered by Cognero.
Page 6
42. In which of the following companies was a high level of soldering defects observed, necessitating 100 percent
inspection for all circuit boards?
a.
GE Fanuc Company
b.
Hewlett-Packard India, Ltd.
c.
Branch-Smith, Inc.
d.
Berton Card Company
43. If a normal random variable has a mean = _____ and a standard deviation = _____, it is called a standard normal
distribution.
a.
1; 0
b.
1; 1
c.
0; 0
d.
0; 1
44. A _____ is defined over one or more intervals of real numbers.
a.
sample space
b.
probability distribution
c.
discrete random variable
d.
continuous random variable
45. Given here is a set of sample data: 12.0, 18.3, 29.6, 14.3, and 27.8. The sample standard deviation for these data is
equal to
a.
62.895.
b.
7.093.
c.
7.931.
d.
50.316.
46. In a designed experiment, a(n) _____ measures the difference that a factor has on the response.
a.
main effect
b.
factorial
c.
treatment
d.
interaction
47. Any sampling procedure can result in _____ types of errors.
a.
two
b.
three
c.
four
d.
five
48. Which of the following is NOT a tool for descriptive statistics?
a.
Frequency distribution
b.
Regression analysis
c.
Proportion
d.
Histogram

Name:
Class:
Date:
chapter 6
Copyright Cengage Learning. Powered by Cognero.
Page 7
49. Suppose that a scatter diagram depicts a relationship between two variables that can be summarized by a straight line.
The correlation coefficient is computed and results in a value of –0.73. Which of the following statements is NOT true?
a.
There is a linear relationship between the two variables.
b.
In general, an increase in one variable is associated with an increase in the other variable.
c.
In general, an increase in one variable is associated with a decrease in the other variable.
d.
Even though the correlation coefficient is less than zero, it still communicates the strength of the linear
relationship.
50. One of the most common types of experimental designs in which all combinations of levels of each factor are
considered is called a(n) _____ experiment.
a.
combination
b.
factorial
c.
interaction
d.
simple
51. _____ is a methodology for drawing conclusions about equality of means of multiple populations.
a.
Quality analysis
b.
Correlation analysis
c.
Analysis of variance
d.
Regression analysis
52. A _____ is a function that assigns a numerical value to every possible outcome in a sample space.
a.
probability distribution
b.
population parameter
c.
sample statistic
d.
random variable
53. The rejection region is chosen so that the probability of the test statistic falling into it, if H0 is true, is
a.
.
b.
.
c.
.
d.
.
54. If random samples are not used, _____ may be introduced.
a.
quality control
b.
bias
c.
testing
d.
probability
55. In regression analysis, the _____ measures the proportion of the variation in the dependent variable that is explained
by the independent variable(s).
a.
coefficient of correlation
b.
F statistic
c.
coefficient of determination

Name:
Class:
Date:
chapter 6
Copyright Cengage Learning. Powered by Cognero.
Page 8
d.
regression equation
56. In ANOVA, by dividing the mean square between groups by the mean square within groups, a(n) _____ statistic is
computed.
a.
t
b.
z
c.
F
d.
R2
57. A government report gives a 99 percent confidence interval for the proportion of welfare recipients who have been
receiving welfare benefits for more than five years to be 21 percent ± 4.5 percent. Which of the following intervals could
NOT be a 95 percent confidence interval for the proportion of welfare recipients who have been receiving welfare benefits
for more than five years?
a.
21 percent ± 4.2 percent
b.
21 percent ± 3.76 percent
c.
21 percent ± 3.9 percent
d.
21 percent ± 4.8 percent
58. A manager at a local manufacturing company has been monitoring the output of one of the machines used to
manufacture chromium shells. Past data indicate that if the machine is functioning properly, the length of the shells
produced by this machine can be modeled as being normally distributed with a mean of 118 cm and a standard deviation
of 6.3 cm. Suppose 10 shells produced by this machine are randomly selected. What is the probability that the average
length of these 10 shells will be between 116 and 120 cm when the machine is operating properly?
a.
0.2709
b.
0.2943
c.
0.6826
d.
0.9656
59. The manufacture of discrete parts often calls for the use of different statistical tools from those used in the processing
industries. Which of the following designed experiments on computer models would NOT be required?
a.
Finite element analysis and computational fluid dynamics
b.
Tolerance stack-up analyses
c.
Traceability studies
d.
Redesign of the billing process
60. Any sampling procedure can result in two types of errors: _____ error and _____ error.
a.
sampling; systematic
b.
simple; conditional
c.
random; measurement
d.
standard; variable
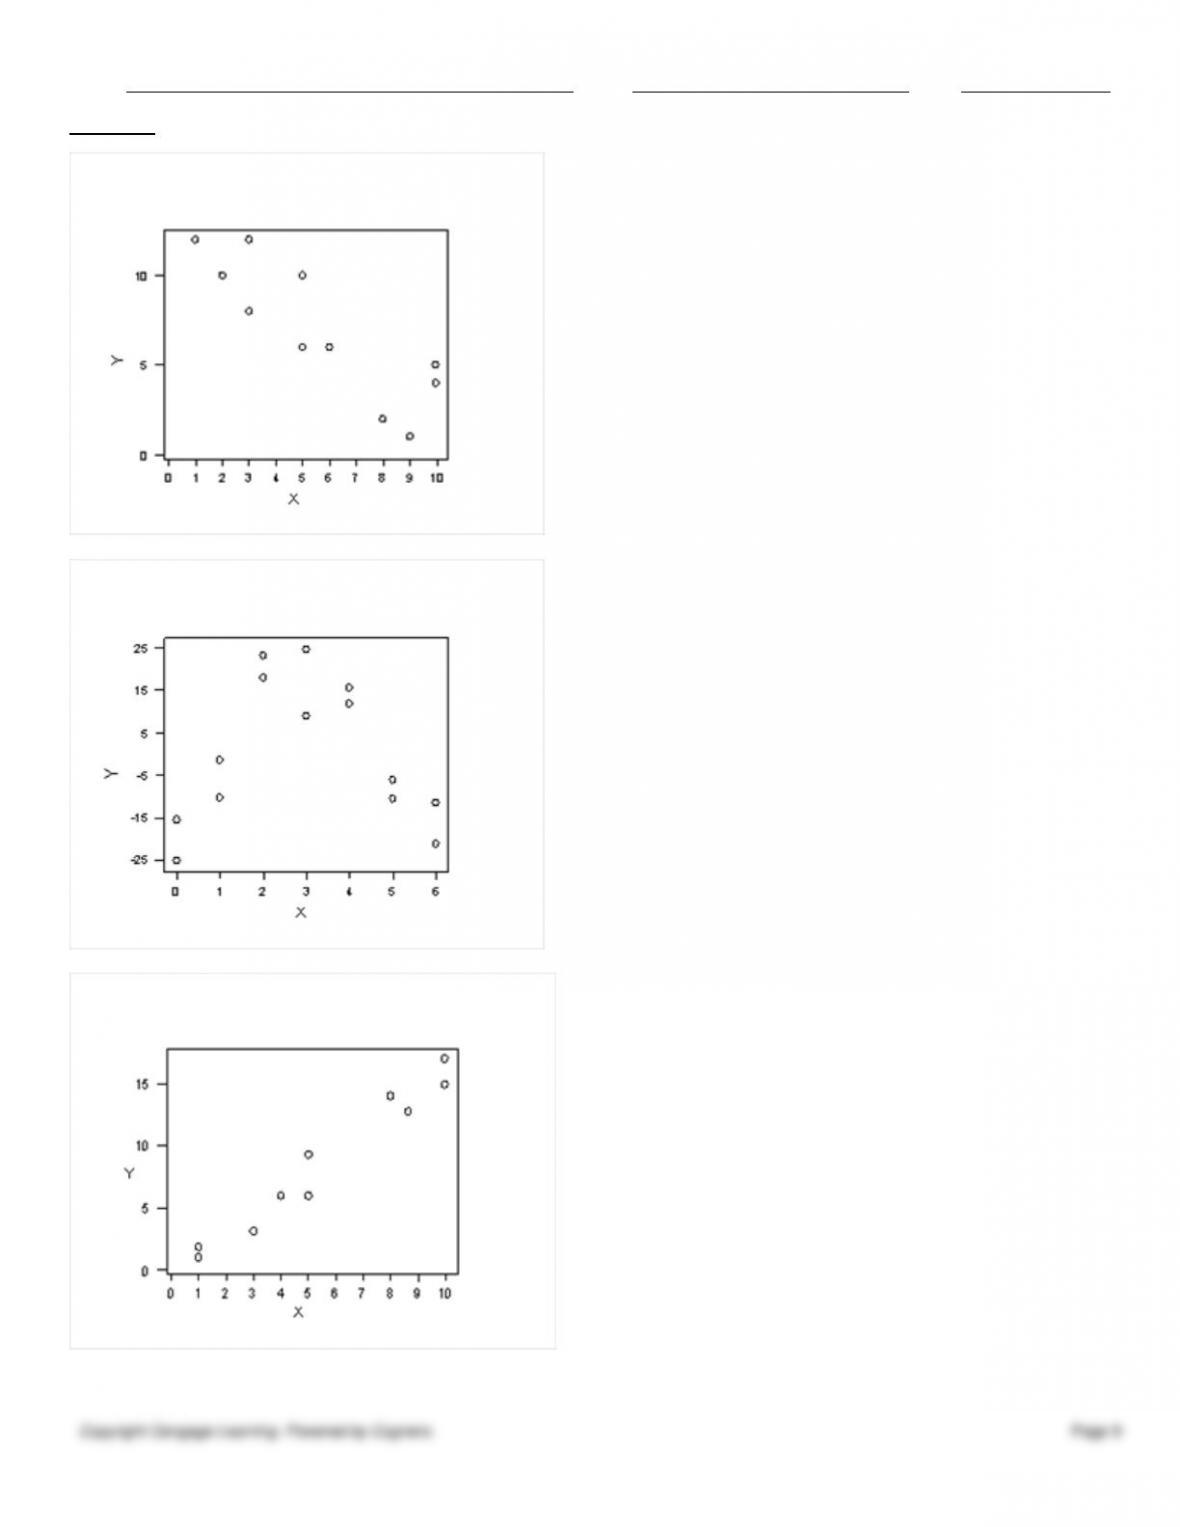
61. Three scatter diagrams are given below. Which of the diagrams present data that can be described by a linear
relationship and, therefore, justifiably summarized by the correlation coefficient?
Plot A
Name:
Class:
Date:
chapter 6
Copyright Cengage Learning. Powered by Cognero.
Page 9
Plot B
Plot C
a.
Plot A
b.
Plot B

Name:
Class:
Date:
chapter 6
Copyright Cengage Learning. Powered by Cognero.
Page 10
c.
Plot A and Plot B
d.
Plot A and Plot C
62. The approximation to a normal distribution can be assumed for sample sizes of
a.
15.
b.
20.
c.
25.
d.
30 or more.
63. Using _____ at the Hewlett-Packard India, Ltd., plant, it was observed that bath temperature, wave height, and omega
had a significant effect on the soldering defects.
a.
hypothesis testing
b.
cluster sampling
c.
descriptive statistics
d.
analysis of variance
64. The _____ distribution models the time between randomly occurring events.
a.
exponential
b.
Poisson
c.
normal
d.
binomial
65. Calculating the average value of five sample measurements of a door width is an example of
a.
descriptive statistics.
b.
hypothesis testing.
c.
regression analysis.
d.
design of experiments.
66. The component of statistical methodology that includes the collection, organization, and summarization of data is
called
a.
probability distribution.
b.
descriptive statistics.
c.
statistical inference.
d.
predictive statistics.
67. The _____ measures the degree of asymmetry of observations around the mean.
a.
coefficient of correlation
b.
coefficient of skewness
c.
coefficient of kurtosis
d.
coefficient of determination
68. Statistical methods help managers make sense of data and gain insight about the
a.
ability of using statistics and quality tools in daily work.
b.
nature of variation in all processes.

Name:
Class:
Date:
chapter 6
Copyright Cengage Learning. Powered by Cognero.
Page 11
c.
nature of variation in the processes they manage.
d.
technology used for data analysis and visualization.
69. Group width =
a.
(UL – LL)/Number of Groups.
b.
Number of Groups/(UL – LL).
c.
(UL + LL)/Number of Groups.
d.
(UL – LL)(Number of Groups).
70. Which of the following is NOT part of the major goal of a typical application of a statistics plan?
a.
Assess manufacturing capability and stability
b.
Monitor the process—often using control charts—to signal significant changes, to identify and remove special
causes of variation, and to provide the path to permanent improvement
c.
Evaluate and remove measurement bias and quantify and reduce measurement variability through gauge
repeatability and reproducibility studies
d.
Help develop optimum servicing
71. Everything else remaining constant, when the sample size increases, the variance
a.
decreases.
b.
increases.
c.
is unaffected.
d.
could increase or decrease.
72. Based on historical data, the diameter of a ball bearing is normally distributed with a mean of 0.527 cm and a standard
deviation of 0.008 cm. Suppose that a sample of 18 ball bearings is randomly selected from a very large lot. What is the
probability that the average diameter of a sampled ball bearing is greater than 0.530 cm?
a.
0.2324
b.
0.4938
c.
0.5062
d.
0.0559
73. Which of the following is NOT a type of sampling scheme?
a.
Stratified sampling
b.
Judgment sampling
c.
Cluster sampling
d.
Biased sampling
74. In a factorial experiment, each combination of different levels of the factor is called a(n)
a.
main effect.
b.
response.
c.
treatment.
d.
interaction.
75. A _____ is a subset of objects taken from the _____.
a.
population; sample

Name:
Class:
Date:
chapter 6
Copyright Cengage Learning. Powered by Cognero.
Page 12
b.
cluster; strata
c.
sample; population
d.
sample space; experiment
76. A travel article researcher randomly sampled 250 adult residents of Illinois and asked each resident if he or she
planned to vacation outside of Illinois this coming summer. Fifty-six of these adults responded that they plan to vacation
outside of Illinois. What is the 95 percent confidence interval for the population proportion of adult residents of Illinois
who plan to vacation outside of Illinois this coming summer?
a.
(0.178, 0.318)
b.
(0.246, 0.250)
c.
(0.172, 0.276)
d.
(0.142, 0.354)
77. What are the typical soldering defects in a wave soldering process of a PCA-Encoder?
78. Discuss the use of statistics in process improvement.
79. Many new industries—such as bioinformatics, medical imaging, and nanotechnology—are emerging as part of a long
list of industries that employ statistics. Give some examples of such industries.
80. A Printed Circuit Assembly-Encoder (PCA-Encoder) is a critical component for the base carriage assembly for a
printer. The PCA-Encoder is produced by putting the electronic components on printed circuit boards (panels) that contain
eight small boards, and then soldering the components using a wave soldering process. What are the aspects of the wave
soldering process that might affect the resulting quality of the PCA-Encoders?
81. At the Hewlett-Packard India, Ltd., plant, a study was undertaken to optimize the wave soldering process to reduce
defects. Briefly explain how the experiment was conducted.
82. How did fault-free mass production and the systems manufactured for the defense effort during World War II further
the use of statistical methods?
83. What are some of the applications of statistics used in quality?
84. List the steps involved in a hypothesis test.
85. What is a sampling distribution? State the sampling distributions of and p for finite populations.
86. Briefly discuss the relationship between exponential distribution and Poisson distribution and include an example.
87. What rules apply to calculating probabilities of events?
88. The times (in minutes) required by a sample of 15 students to complete a class assignment are as follows:
45, 42, 56, 54, 40, 37, 39, 45, 49, 43, 45, 50, 49, 55, 48

Name:
Class:
Date:
chapter 6
Copyright Cengage Learning. Powered by Cognero.
Page 13
Use Excel functions and calculate the mean, median, mode, range, sample variance, and sample standard deviation.
89. Define binomial and Poisson distributions, and state their probability functions.
90. In Excel’s Histogram tool, how are bins defined?
91. What is probability? What are its characteristics?
92. A manager was assigned the task of investigating the error in payments for routine purchases made by the purchasing
department. The manager randomly selected 12 payments, investigated them thoroughly, and determined the payment
error for each of these payments. The payment error was defined as the difference between the amount paid and what
should have been paid. The payment errors determined for these selected payments were as follows:
$17
$25
$14
–$10
$20
$40
$35
$30
$28
$22
$15
$16
a. What is the 95 percent confidence interval for the population mean payment error?
b. Suppose a recent company report inferred that the mean payment error may be running as high as $25. That led the
manager to test the null hypothesis that the population mean payment error is equal to $25 versus the alternative that the
population mean payment error is not equal to $25. Using a level of significance equal to 0.01, perform this hypothesis
test.
c. Suppose another manager used these same data to test the null hypothesis that the population mean payment error is
less than or equal to $15 versus the alternative that the population mean payment error is greater than $15. What is the test
statistic for this hypothesis testing situation? What is the critical value at a level of significance equal to 0.01? What is the
conclusion?
Name:
Class:
Date:
chapter 6
Copyright Cengage Learning. Powered by Cognero.
Page 14
Answer Key
Name:
Class:
Date:
chapter 6
Name:
Class:
Date:
chapter 6
Copyright Cengage Learning. Powered by Cognero.
Page 16
52. d
53. b
54. b
55. c
56. c
57. d
58. c
59. d
60. a
61. d
62. d
63. d
64. a
65. a
66. b
67. b
68. c
69. a
70. d
71. a
72. d
73. d
74. c
75. c
76. c
Name:
Class:
Date:
chapter 6
Name:
Class:
Date:
chapter 6
Poisson Distribution:
The Poisson distribution is used to calculate the number of occurrences of an event over a specified interval of time or
Sampling distribution of :
When using simple random sampling, the expected value of is the population mean .
The standard deviation of (often called the standard error of the mean) is given by the formula,
for finite populations.
Sampling distribution of p:
The expected value of p is , the population proportion.
The standard deviation of p is, for finite populations.
86. The exponential distribution is related to the Poisson distribution: if the distribution of the time between events is
exponential, then the number of events occurring during an interval of time is Poisson.
For example, if the average time between the arrivals of customers in a department store is exponential with a mean of 2
minutes, then the average number of arrivals per minute is Poisson with a mean of 1/2 arrivals/minute.
87. The following rules apply to calculating probabilities of events:
Rule 1: The probability of any event is the sum of the probabilities of the outcomes that compose that event.
Rule 2: The probability of the complement of any event A is P(Ac) = 1 – P(A).
Rule 3: If events A and B are mutually exclusive, then P(A or B) = P(A) + P(B).
Rule 4: If two events A and B are not mutually exclusive, then P(A or B) = P(A) + P(B) – P(A and B). Here, (A and B)
represents the intersection of events A and B; that is, all outcomes belonging to both A and B.
88. Using Excel functions,
Mean = AVERAGE(45, 42, 56, …, 48) = 46.47
Median = MEDIAN(45, 42, 56, …, 48) = 45
Mode = MODE.SNGL(45, 42, 56, …, 48) = 45
Range = MAX(45, 42, 56, ..., 48) – MIN(45, 42, 56, …, 48) = 19
Sample variance = VAR.S(45, 42, 56, …, 48) = 33.84
Sample standard deviation = STDEV.S(45, 42, 56, …, 48) = 5.82
89. Binomial Distribution:
The binomial distribution describes the probability of obtaining exactly x “successes” in a sequence of n identical
experiments, called trials.
Name:
Class:
Date:
chapter 6
Copyright Cengage Learning. Powered by Cognero.
Page 19
space. The Poisson probability distribution is given by the following formula:
where = expected value or average number of occurrences, x = 0, 1, 2, 3,… , and e = 2.71828, a constant.
90. For discrete values, a column of these values is set up in the spreadsheet for the bin range and specified in the Bin
Range field. For numerical data that have many different discrete values with little repetition or are continuous, bins are
defined by specifying:
1. the number of bins.
2. the width of each bin.
3. the upper and lower limits of each bin.
It is important to remember that the bins may not overlap so that each value is counted in exactly one group. The bins
should be defined after examining the range of the data. Generally, between 5 to 15 bins should be chosen, and the range
of each should be of equal width.
91. Probability is the likelihood that an outcome occurs.
Suppose we label the n outcomes in a sample space as O1, O2, …, On, where Oi represents the ith outcome in the sample
space. Let P(Oi) be the probability associated with the outcome Oi. Then:
• The probability associated with any outcome must be between 0 and 1, or for each outcome Oi
• The sum of the probabilities over all possible outcomes must be 1.0, or P(O1) + P(O2) + … + P(On) = 1
92. a. The 95 percent confidence interval:
= 21 + 8.11 = (12.89, 29.11)
b. Computing the test statistic, we have
Since this is not less than the lower-tail critical value of –3.106, the manager would not reject the null hypothesis.
c. Computing the test statistic, we have
Since this is less than the upper-tail critical value of 2.718, the manager would not reject the null hypothesis.