24) Green Belts have:
A) more Six Sigma training than Black Belts but less Six Sigma training than Champions.
B) more Six Sigma training than Champions but less Six Sigma training than Team Members.
C) more Six Sigma training than Black Belts but less Six Sigma training than Master Black
Belts.
D) more Six Sigma training than Team Members but less Six Sigma training than Black Belts.
25) Which of these represent the Six Sigma process sequence to create a completely new
business process or product?
A) DMAIC
B) DMADV
C) 5W1H
D) WD40
26) Which of these elements is in the Six Sigma process sequence to create a completely new
business process or product but NOT in the Six Sigma process to improve an existing business
process?
A) Define
B) Derive
C) Design
D) Create
27) Which of these steps is NOT part of the Six Sigma process sequence?
A) Design
B) Measure
C) Analyze
D) Improve
28) When constructing a fishbone diagram, brainstorming takes place during the:
A) closed phase.
B) narrow phase.
C) wide phase.
D) open phase.
29) Which of the continuous improvement tools is used to conduct root-cause analysis?
A) statistical process control (SPC)
B) flow chart
C) Ishikawa diagram
D) Pareto chart
30) A professor assigns a massive homework set the first day of class that will be due the day the
students walk in to take their first exam of the semester. Over the weekend he grades the
homework and the exam papers and as he reviews the results, it occurs to him that students that
worked more of the 40 problems in the homework assignment appeared to be more successful on
the exam. Which of the continuous improvement tools would be most appropriate for displaying
this phenomenon?
A) statistical process control (SPC)
B) scatter plot
C) Ishikawa diagram
D) Pareto chart
31) Which two continuous improvement tools are most similar in appearance?
A) scatter plot and check sheet
B) Pareto chart and histogram
C) histogram and fishbone diagram
D) check sheet and fishbone diagram
32) Which of these continuous improvement tools would be best suited for showing all of the
steps required to change your major to operations management?
A) process map
B) cause-and-effect diagram
C) Pareto chart
D) scatter plot
33) ________ is a measure of process performance that is a ratio of output to inputs.
34) The elapsed time needed to complete a business process is called ________.
35) A(n) ________ is used to record how frequently a certain event occurs.
36) When an organization compares their processes to those of another firm outside their
industry, they are engaging in ________.
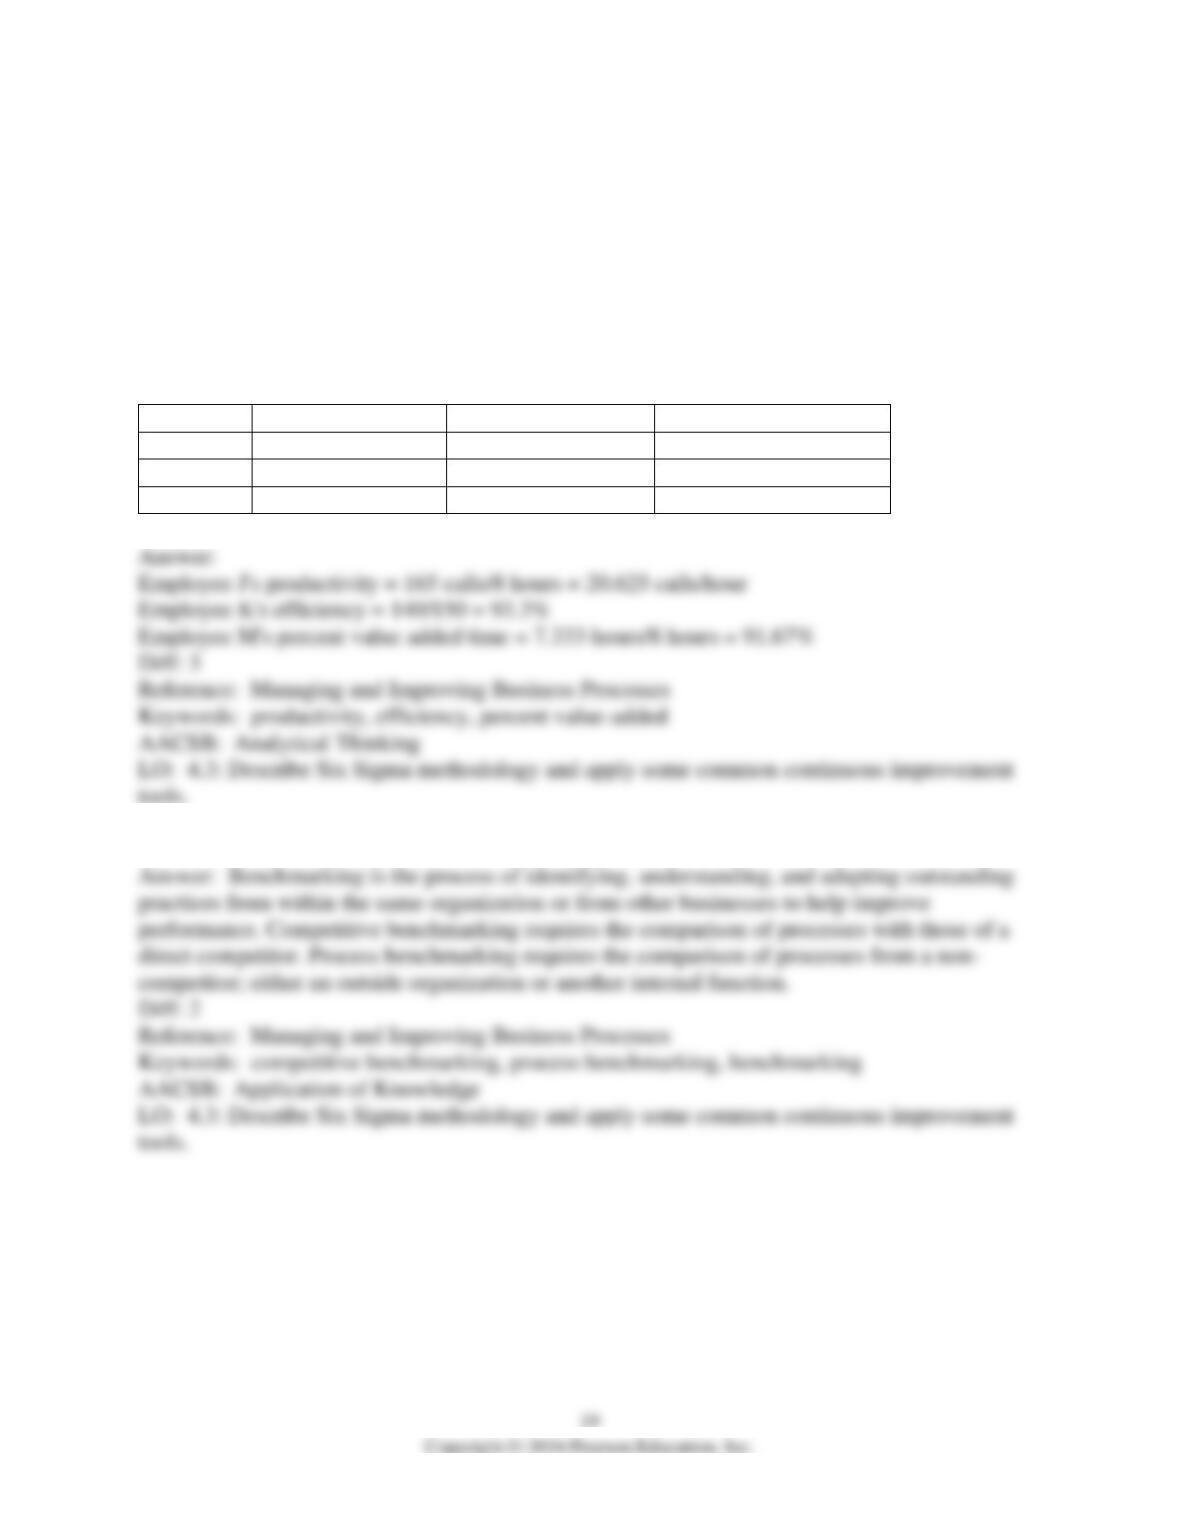
37) Lisa manages customer service representatives in a call center. The center’s computer system
tracks a number of metrics for each employee including the total number of customer calls they
complete, the amount of time the service representative spends talking to customers, and the total
time the service representative was clocked in each day. The work standard developed by the call
center is to complete 150 calls in an 8-hour shift. Answer the following questions using the
information provided in the table.
a. What is the productivity of employee J?
b. What is the efficiency of employee K?
c. What is the percent value added time for employee M?
Employee
# Calls Completed
Total Time on Calls
Total Time Clocked In
J
165
8 hours
8 hours
K
140
7 hours 30 minutes
8 hours
M
135
7 hours 20 minutes
8 hours
38) What is benchmarking and how do the two types differ?
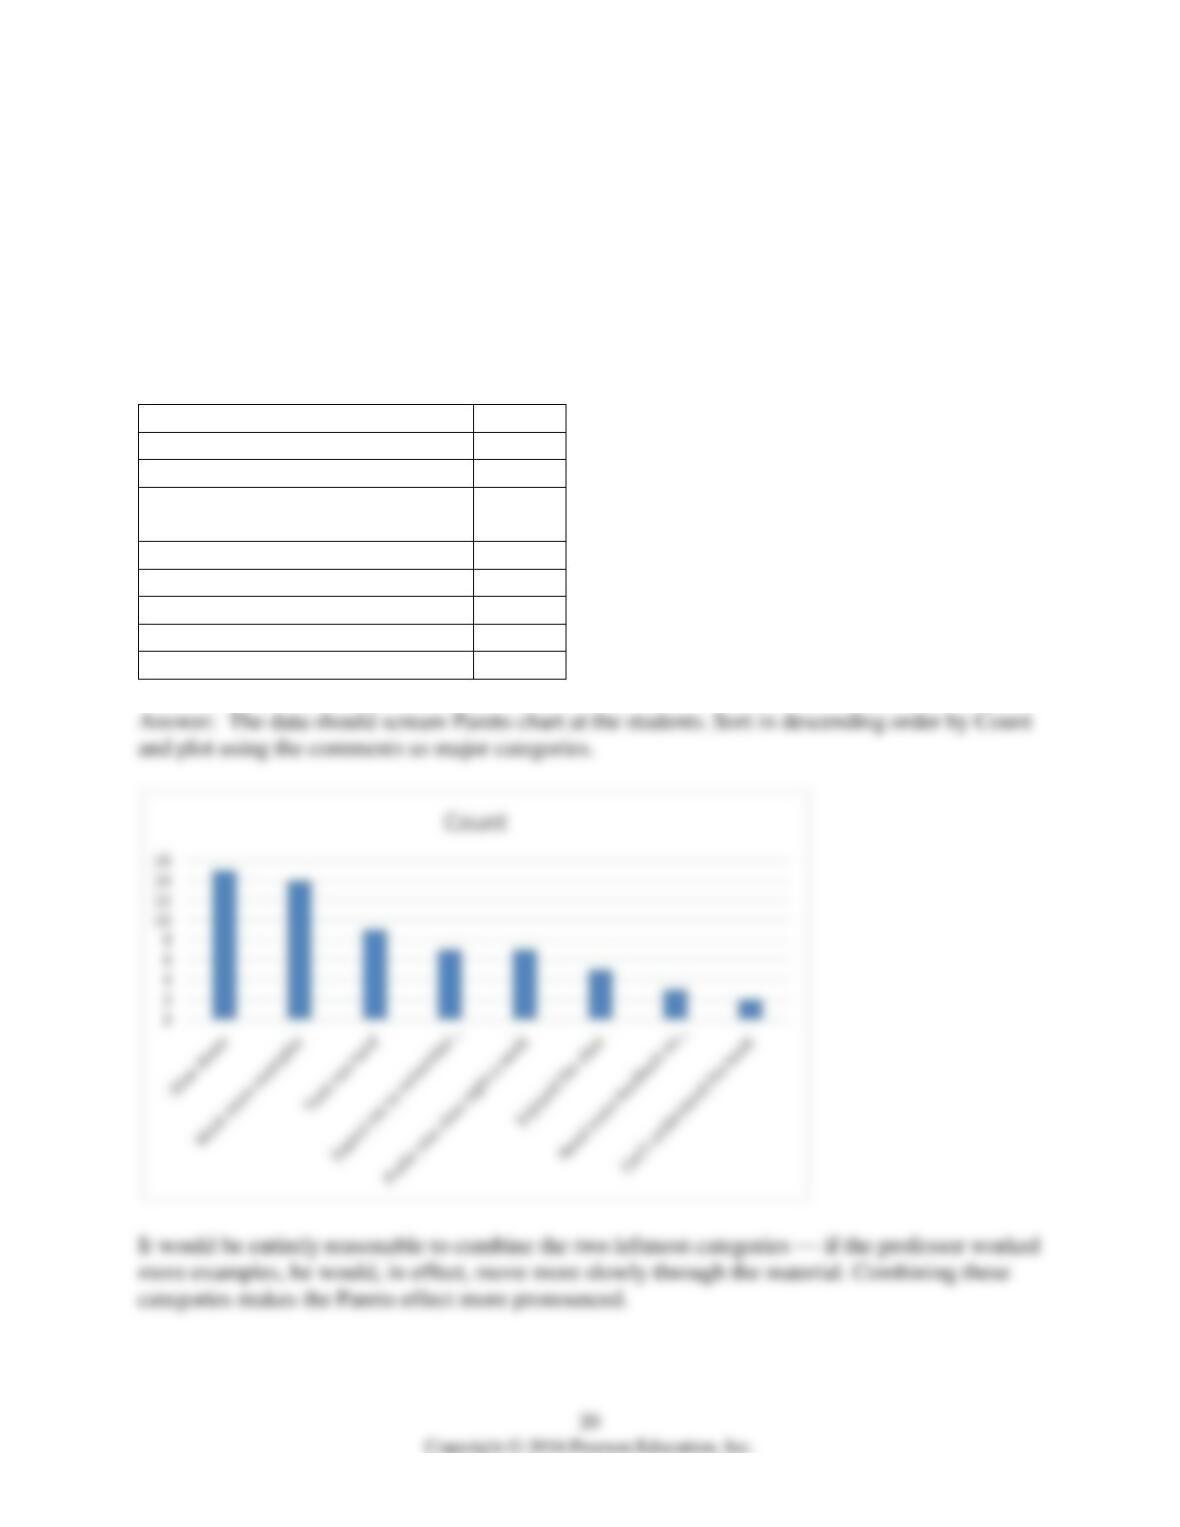
39) A tenured professor lights a cigar, cradles a snifter of brandy in his claw-like hand, and
reviews his student evaluations from the previous semester. The numbers were unspectacular,
but he beamed with pride as he read the comments. For the first time in a long time, no one
responded to the “What can the professor do to improve the course?” question with the classic
response “not teach it anymore.” There were a number of comments, and since he took his craft
seriously, he set about summarizing and organizing the comments into the alphabetical list you
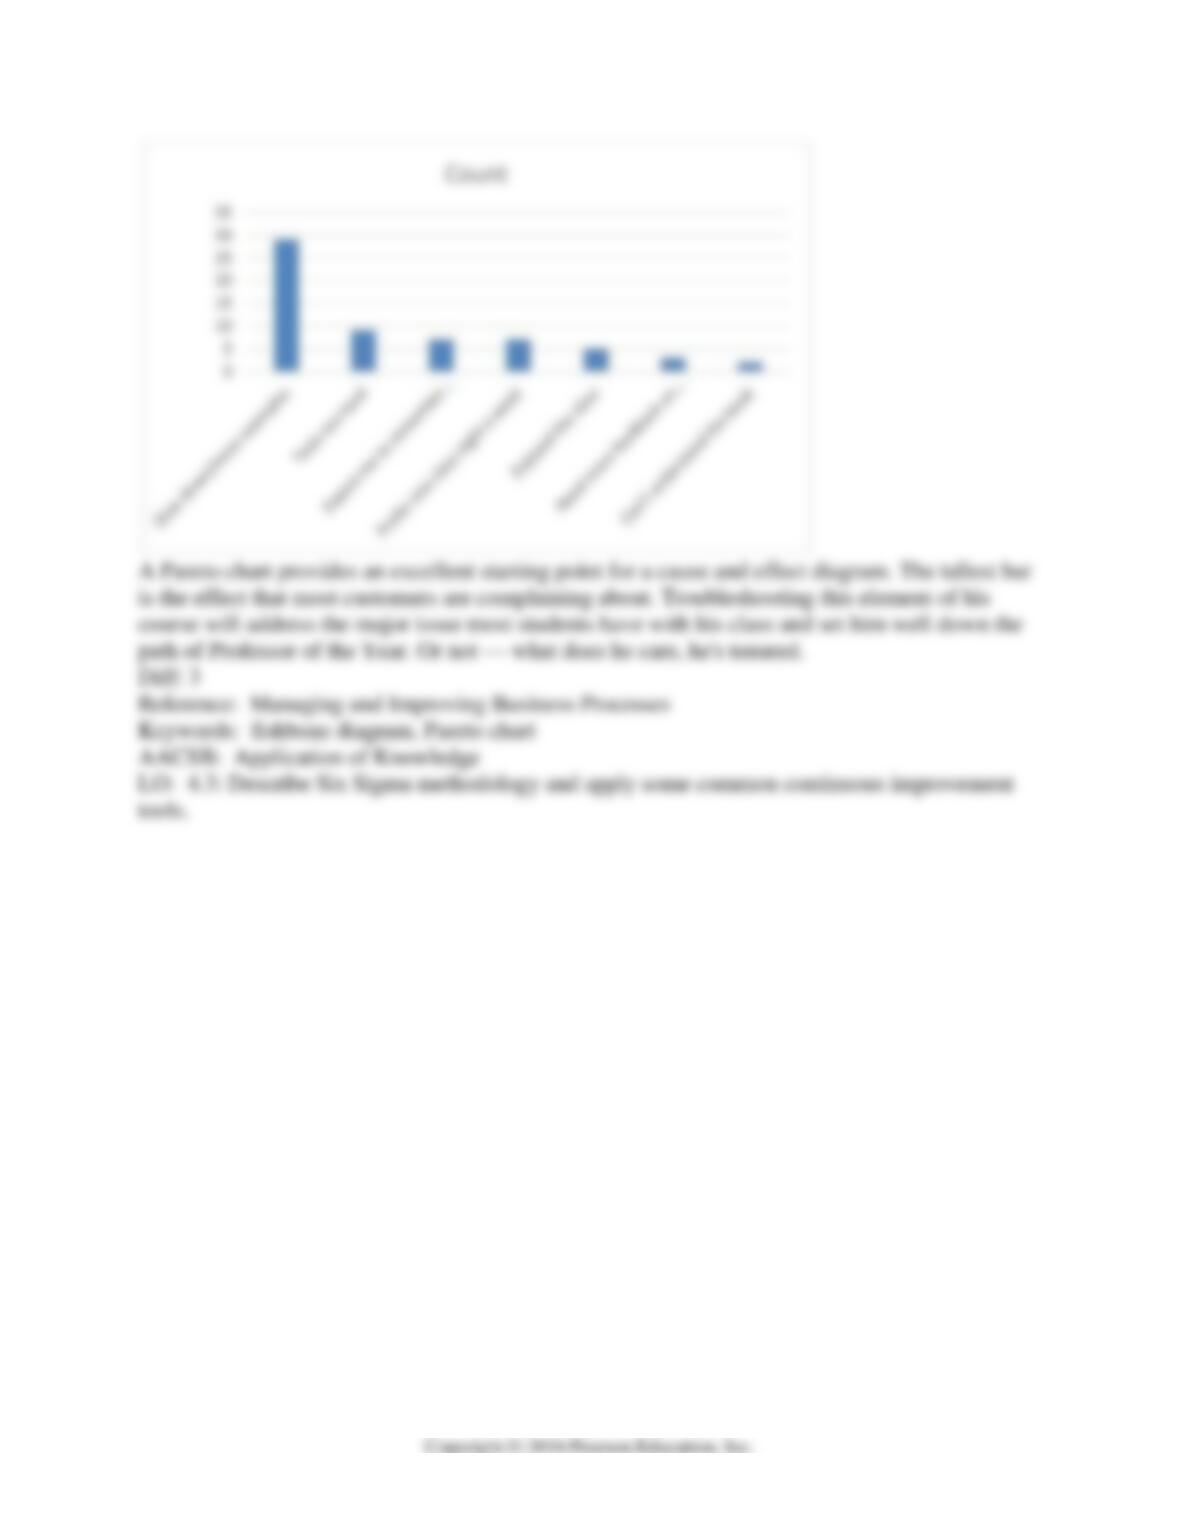
see here. Take this data and analyze it using the appropriate tool for continuous improvement.
Then recommend to the professor the next tool (out of the tools for continuous improvement)
that he should use to take the next step in this analysis.
Comment
Count
Can’t understand the book
2
Enjoyed the class
5
Expect me to remember
prerequisites
7
Need more feedback on homework
3
Prefer one class night a week
7
Slow down
15
Tests too hard
9
Work more examples
14
21

22
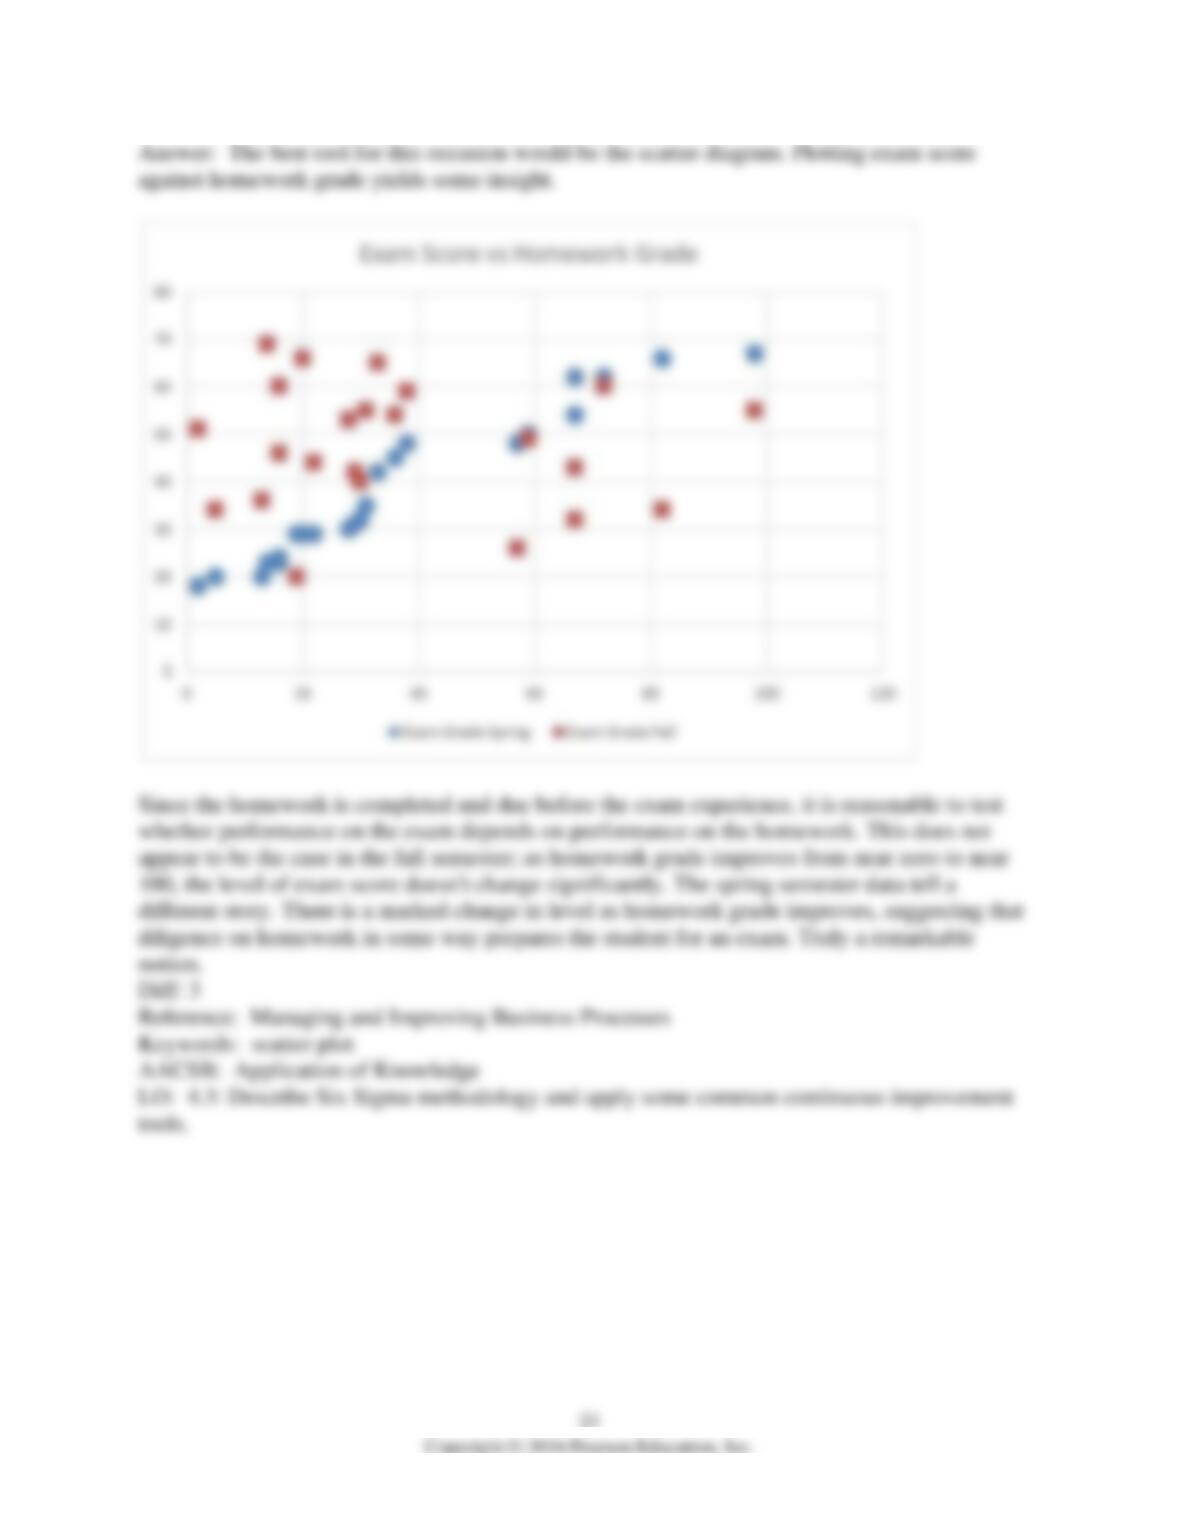
40) An assistant professor designs his fall semester class so that a major homework assignment is
due the day his students waltz into class to take their first exam. The results are mixed so he
rewrites his exam for the spring semester and repeats the process, again collecting a major
homework assignment on exam day and grading and returning both the homework assignments
and exams the following class meeting. Use an appropriate tool from the tools for continuous
improvement to analyze the data. What conclusions do you draw?
Homework grade
Exam Grade Spring
Exam Grade Fall
2
18
51
5
20
34
13
20
36
14
23
69
16
23
46
16
24
60
19
29
20
20
29
66
22
29
44
28
30
53
29
31
42
30
32
40
31
35
55
33
42
65
36
45
54
38
48
59
57
48
26
59
50
49
67
54
32
67
62
43
72
62
60
82
66
34
98
67
55
41) Describe the process of root cause analysis and include in your description the tools that it
uses.
42) Describe continuous improvement and business process reengineering and compare their
advantages and disadvantages in relation to each other.
Learning Objective 4-4
1) Level 1 of the SCOR model is organized around the five core management processes: plan,
source, make, deliver, and return.
2) One reason the SCOR model is widely accepted is its consistency. It mandates the same
information and physical flows for all products, regardless of the degree of customization.
3) The procedure of rethinking and radical redesign of business processes to achieve dramatic
organizational improvements is called:
A) competitive benchmarking.
B) continuous improvement.
C) process benchmarking.
D) business process reengineering.
4) Which of these SCOR model flows moves in the opposite direction from the others?
A) Plan
B) Return
C) Source
D) Make
5) Which of these statements about the SCOR model is best?
A) The SCOR model consists of four levels that describe supply chain processes in increasing
detail.
B) The core management processes of the model are Source, Collaborate, Operations, and
Return.
C) The model makes provisions for different levels of customization.
D) The process types detailed in level one are Planning, Execution, and Enable.
6) ________ is a process improvement philosophy that results in small, incremental changes
while ________ is a process improvement philosophy that results in dramatic organizational
changes.
7) Level two of the SCOR model divides SCM activities into _________.
8) ________ is the SCOR model process that addresses the movement of defective product from
the customer.
9) Briefly describe the five core management processes that comprise Level 1 of the SCOR
model.