2) The process design team at a manufacturer has broken an assembly process into eight basic steps, each
with a required time and predecessor as shown in the table. They work a 7 hour day and want to produce
at a rate of 360 units per day. What should their takt time be?
Task
Time (sec)
Predecessor
A
45
—
B
50
A
C
40
A
D
55
B, C
E
40
D
F
65
D
G
25
E
H
35
F, G
A) 70 seconds
B) 65 seconds
C) 52 seconds
D) 25 seconds
Use this scenario for the following question(s).
The process design team at a manufacturer has broken an assembly process into eight basic steps, each
with a required time, and predecessor as shown in the table. There are 8 productive hours available in a
day and the manufacturer wishes to produce 400 units. Use this information to answer the following
question(s).
Task
Time (sec)
Predecessor
J
45
—
K
50
J
L
40
J
M
55
K, L
N
40
M
O
65
M
P
25
N
R
35
O, P
3) Refer to the scenario above. What is the theoretical minimum number of stations?
A) four
B) five
C) six
D) seven
4) Refer to the scenario above. Operations managers and process engineers design a line that contains
seven stations. What is the percentage of idle time?
A) 21.9%
B) 14.3%
C) 25.6%
D) 17.8%
5) Refer to the scenario above. The manager assigns tasks to workstations and breaks ties using a longest
operation heuristic. That is, if two or three tasks could be assigned to a given station, the manager assigns
the longest task first and then fills in the remaining time at the workstation as completely as possible.
Using this approach, what task(s) would be assigned at the fourth station?
A) N, P
B) M
C) N, O
D) O, P
7) Refer to the scenario above. Without using more than one worker per station, what is the maximum
output achievable in the 7.5 hour work day?
A) 1000 units
B) 1800 units
C) 1258 units
D) 415 units
8) Refer to the scenario above. The process design team realizes that the potential spike in demand for
this device requires increased output. They elect to add a seventh worker to their production team at the
first station. What is the net effect of adding this worker?
A) Nothing–the output rate does not change.
B) The output rate increases by 20%.
C) The output rate increases by 10%.
D) The output rate increases by 5%.
9) Refer to the scenario above. What is the takt time?
A) 53.3 seconds
B) 67.5 seconds
C) 75.8 seconds
D) 90 seconds
10) Refer to the scenario above. The process engineer calculates the takt time and examines the task times
indicated in the table. He decides to use the minimum cycle time instead and have the workers leave
early each day once they have built 400 units. How much earlier would the workers leave?
A) 12 minutes and 53.3 seconds
B) 14 minutes and 20 seconds
C) 16 minutes and 40 seconds
D) 18 minutes and 15 seconds
11) Refer to the scenario above. What is the theoretical minimum number of stations that will be used if
the line is balanced using the appropriate takt time?
A) 3
B) 4
C) 5
D) 6
12) Refer to the scenario above. How many workstations must be added to increase the output rate to one
unit per minute?
A) 1
B) 2
C) 3
D) 4
13) The table depicts a production line that has been balanced with a takt time of 2 minutes. What is the
percent idle time of this balance?
Workstation
1
2
3
4
5
6
Task
A, B
C
D, E, F
G, H
I
J, K, L
Time (min)
1, 1
1.8
1, 0.5, 0.4
0.9, 0.8
1.8
0.5, 0.5, 0.6
A) 5%
B) 10%
C) 15%
D) Cannot be determined from the information provided.
14) The table depicts a production line that has been balanced with a takt time of 2 minutes. What is the
efficiency of this balance?
Workstation
1
2
3
4
5
6
Task
A, B
C
D, E, F
G, H
I
J, K, L
Time (min)
1, 1
1.8
1, 0.5, 0.4
0.9, 0.8
1.8
0.5, 0.5, 0.6
A) 82.5%
B) 85%
C) 87.5%
D) 90%
15) The table depicts an production line that has been balanced with a takt time of 2 minutes. Where
would you add a worker if you wanted to increase the output rate while keeping six work stations?
Workstation
1
2
3
4
5
6
Task
A, B
C
D, E, F
G, H
I
J, K, L
Time (min)
1, 1
1.8
1, 0.5, 0.4
0.9, 0.8
1.8
0.5, 0.5, 0.6
A) station 1
B) station 2
C) station 3
D) station 6
16) The table depicts a production line that has been balanced with a takt time of 2 minutes. If you could
hire another six workers, which of these systems would result in the highest output rate?
Workstation
1
2
3
4
5
6
Task
A, B
C
D, E, F
G, H
I
J, K, L
Time (min)
1, 1
1.8
1, 0.5, 0.4
0.9, 0.8
1.8
0.5, 0.5, 0.6
A) simply duplicating the existing line so you had two lines doing exactly the same thing
B) assigning one worker to each activity and creating a single twelve station production line
C) keeping the existing balance and assigning three workers to stations 1, two workers to station 2, two
workers to station 3, one worker to station 4, two workers to station 5, and two workers to station 6
D) you would be indifferent between alternatives A and B
Use this scenario for the following question(s).
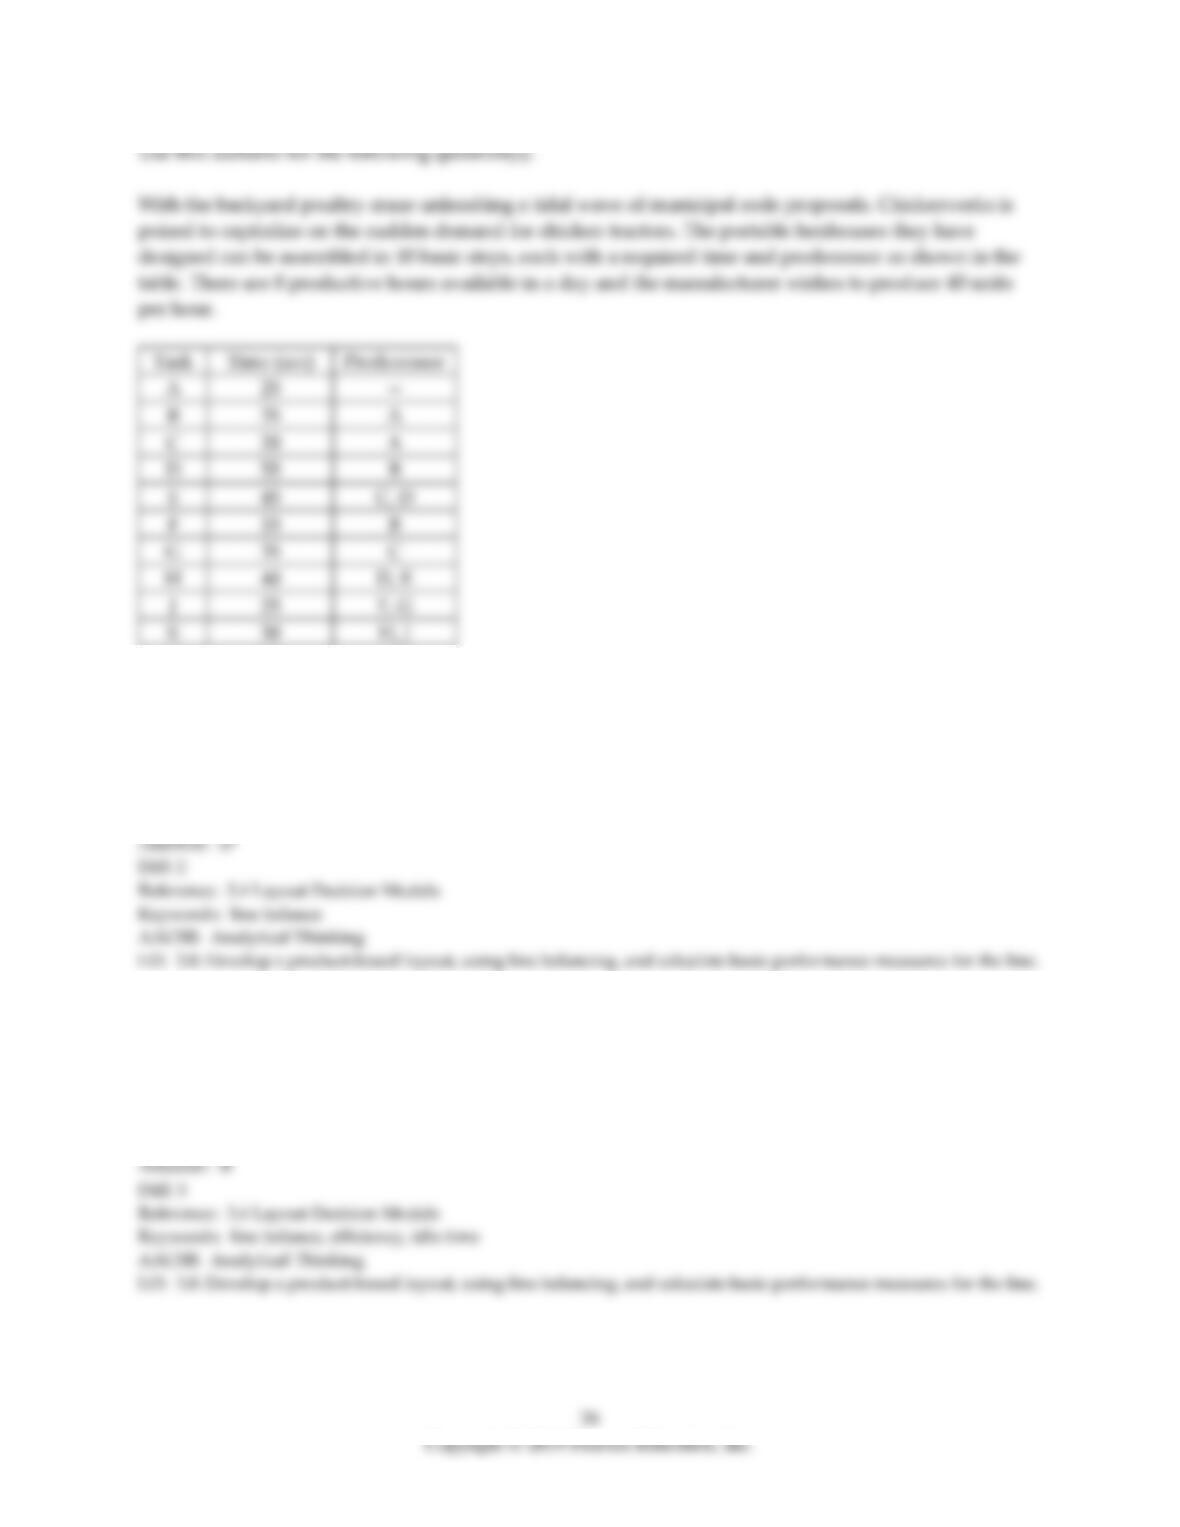
With the backyard poultry craze unleashing a tidal wave of municipal code proposals, Chickenverks is
poised to capitalize on the sudden demand for chicken tractors. The portable henhouses they have
designed can be assembled in 10 basic steps, each with a required time and predecessor as shown in the
table. There are 8 productive hours available in a day and the manufacturer wishes to produce 40 units
per hour.
Task
Time (sec)
Predecessor
A
25
—
B
35
A
C
20
A
D
55
B
E
45
C, D
F
15
B
G
35
C
H
40
D, E
J
25
F, G
K
30
H, J
17) Refer to the scenario above. Balance the line according to the longest operation rule. What is the
assignment for station 2?
A) B, C, F
B) E, H, F
C) C, D
D) D, G
18) Refer to the scenario above. Balance the line according to the longest operation rule. What is the
efficiency of your line balance?
A) 85.66%
B) 90.28%
C) 88.14%
D) 83.88%
19) Refer to the scenario above. What is the theoretical minimum number of stations needed?
A) 3
B) 4
C) 5
D) 6
20) When designers are considering the ways that a space may be laid out with functional departments:
A) they typically construct every possible physical layout.
B) they don’t construct every physical layout, but they do simulate every possible layout.
C) they usually look for a viable, but not optimal solution.
D) they assign layouts at random since it doesn’t pay to consider a good layout.
21) These three tables show the floor layout of 5 departments in an office building, the average number of
daily trips between each pair of offices, and the distance between each pair of offices. What is the total
cost of this layout if there is a $0.50 per foot transportation cost?
Average number of trips between departments
A
B
C
D
E
A
—
25
15
25
30
B
—
40
50
35
C
—
15
15
D
—
20
E
—
A
B
D
C
E
Distance between departments (feet)
A
B
C
D
E
A
—
20
25
40
45
B
—
5
20
25
C
—
25
20
D
—
5
E
—
A) $460.00
B) $2300.00
C) $3037.50
D) $4785.50
22) Cycle time is the sum of all of the task times.
23) Takt time sets the upper limit on the elapsed time between completion of successive items on a
production line.
24) Regardless of the number of tasks or their durations, a line balance that is 100% efficient is achievable
if CT = ΣTi.
25) The shorter the required takt time, the more workstations will be required to balance a production
line.
26) A manager deciding where six departments could be located in a six-room office building has over
500 possible arrangements.
27) The only way to ensure that a layout design is optimal is to try to evaluate literally every possible
layout and compute the total distance travelled.
28) The maximum allowable time between completions of successive units on the production line is the
________.
29) A collection of different departments must be visited by every new student on campus to take care of
registration, housing, books, and other campus services. The placement of these departments within the
university center is an example of a(n) ________ layout.
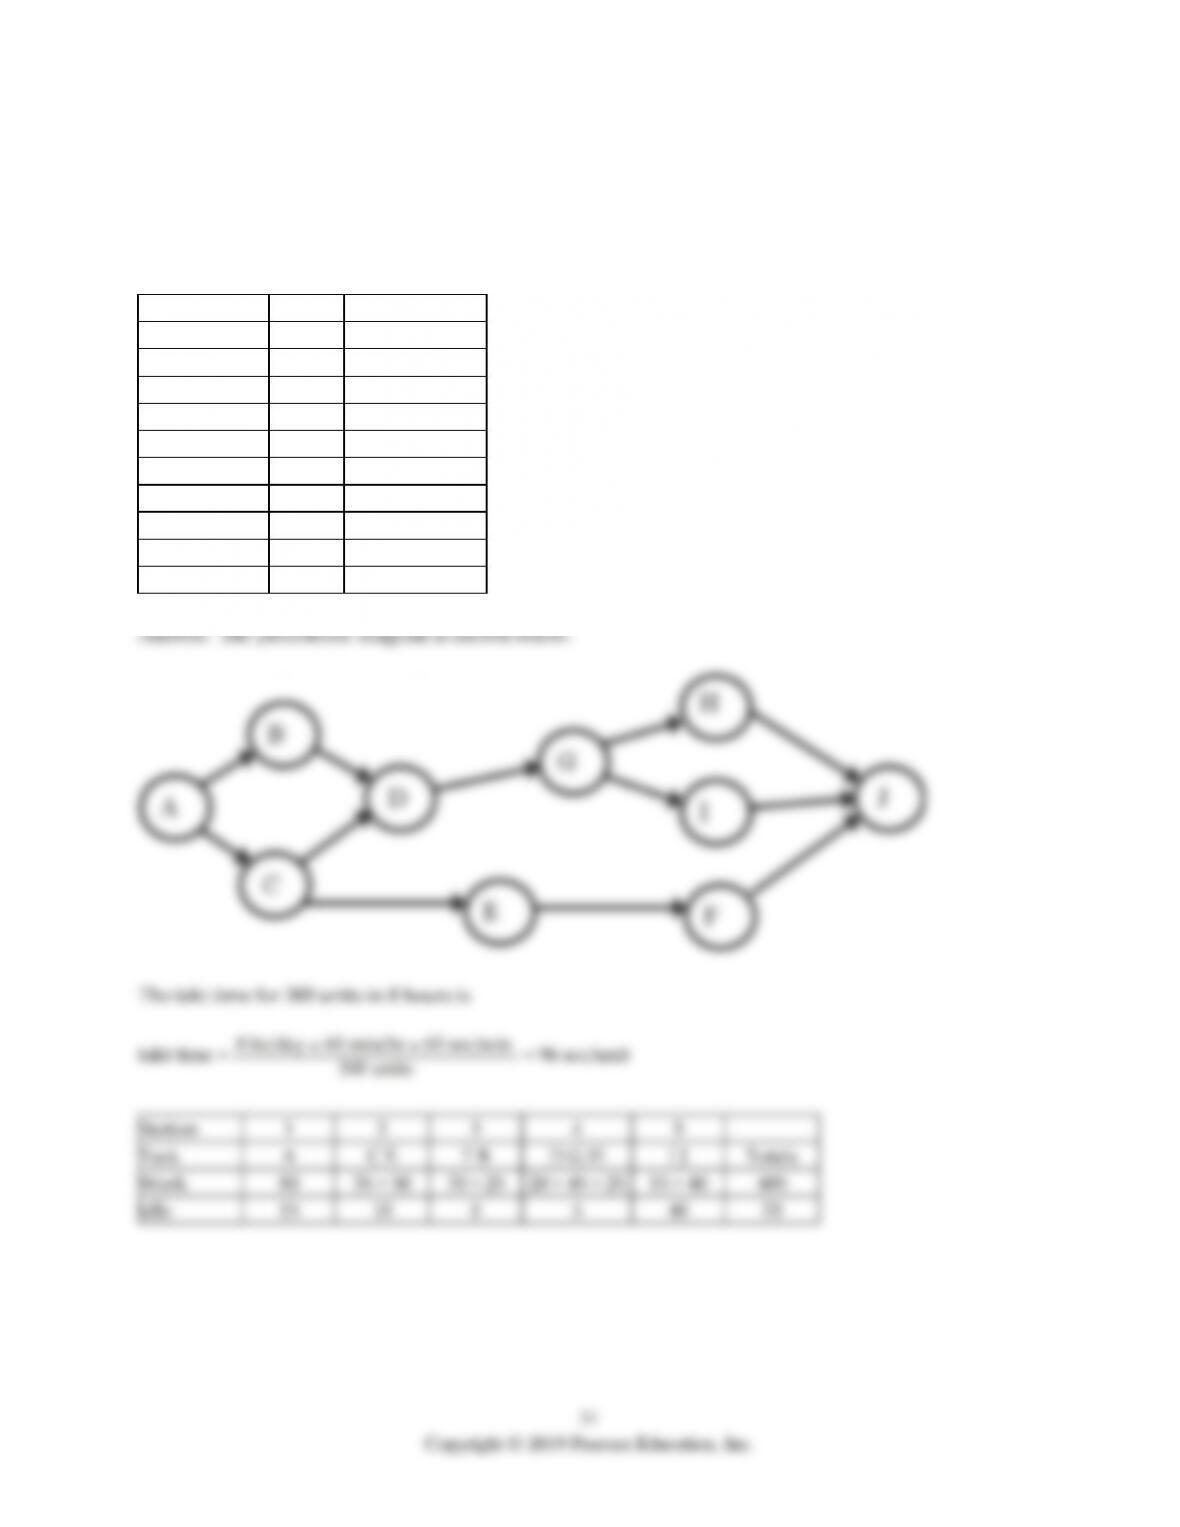
30) A manufacturer needs to produce 300 coffee pots per 8 hour day. The discrete tasks required to
produce a coffee pot have been identified, timed in seconds, and ordered as indicated in the table. Sketch
the precedence diagram and then assign tasks to workstations on the production line to achieve the
required level of output. Break ties by assigning the longest task first. Determine the efficiency delay of
your line balance.
Task
Time
Predecessors
A
80
—
B
25
A
C
35
A
D
20
B, C
E
50
C
F
70
E
G
45
D
H
25
G
I
15
G
J
40
F, H, I
32
Copyright © 2019 Pearson Education, Inc.
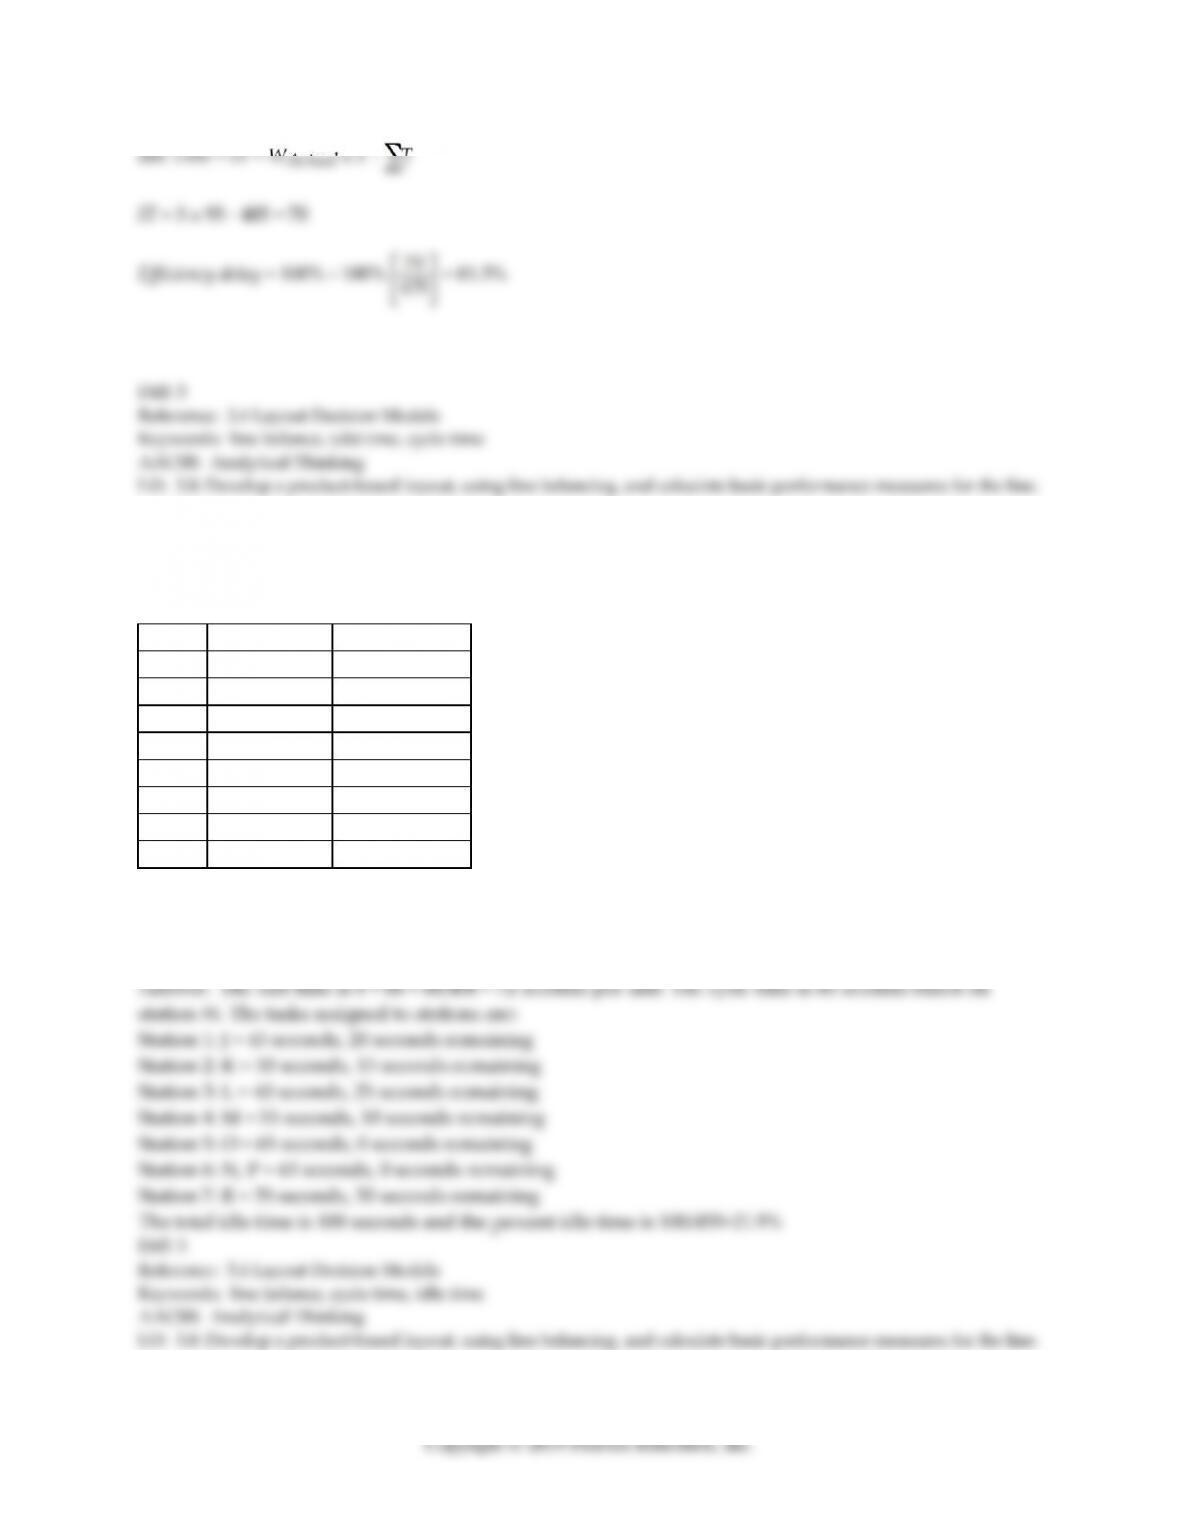
Idle Time = IT = CT –
IT = 5 x 95 – 405 = 70
Efficiency delay = 100% – 100% = 85.3%
Diff: 3
Reference: 3.4 Layout Decision Models
Keywords: line balance, takt time, cycle time
AACSB: Analytical Thinking
LO: 3.8: Develop a product-based layout, using line balancing, and calculate basic performance measures for the line.
31) The process design team at a manufacturer has broken an assembly process into eight basic steps,
each with a required time and predecessor as shown in the table. There are 8 productive hours available
in a day and the manufacturer wishes to produce 400 units using seven workers–one for each station.
Task
Time (sec)
Predecessor
J
45
—
K
50
J
L
40
J
M
55
K, L
N
40
M
O
65
M
P
25
N
R
35
O, P
Balance the line according to the longest operation rule and calculate the percent idle time. Using the
same arrangement of tasks at work stations, what is the greatest output that can be achieved in an eight–
hour day and what is the percent idle time of this design?
32) With the backyard poultry craze unleashing a tidal wave of municipal code proposals, Chickenverks
is poised to capitalize on the sudden demand for chicken tractors. The portable henhouses they have
designed can be assembled in 10 basic steps, each with a required time and predecessor as shown in the
table. There are 8 productive hours available in a day and the manufacturer wishes to produce 40 units
per hour.
Task
Time (sec)
Predecessor
A
25
—
B
35
A
C
20
A
D
55
B
E
45
C, D
F
15
B
G
35
C
H
40
D, E
J
25
F, G
K
30
H, J
Balance the line according to the longest operation rule and calculate the percent idle time. Using the
same arrangement of tasks at work stations, what is the greatest output that can be achieved in an eight–
hour day and what is the percent idle time of this design?
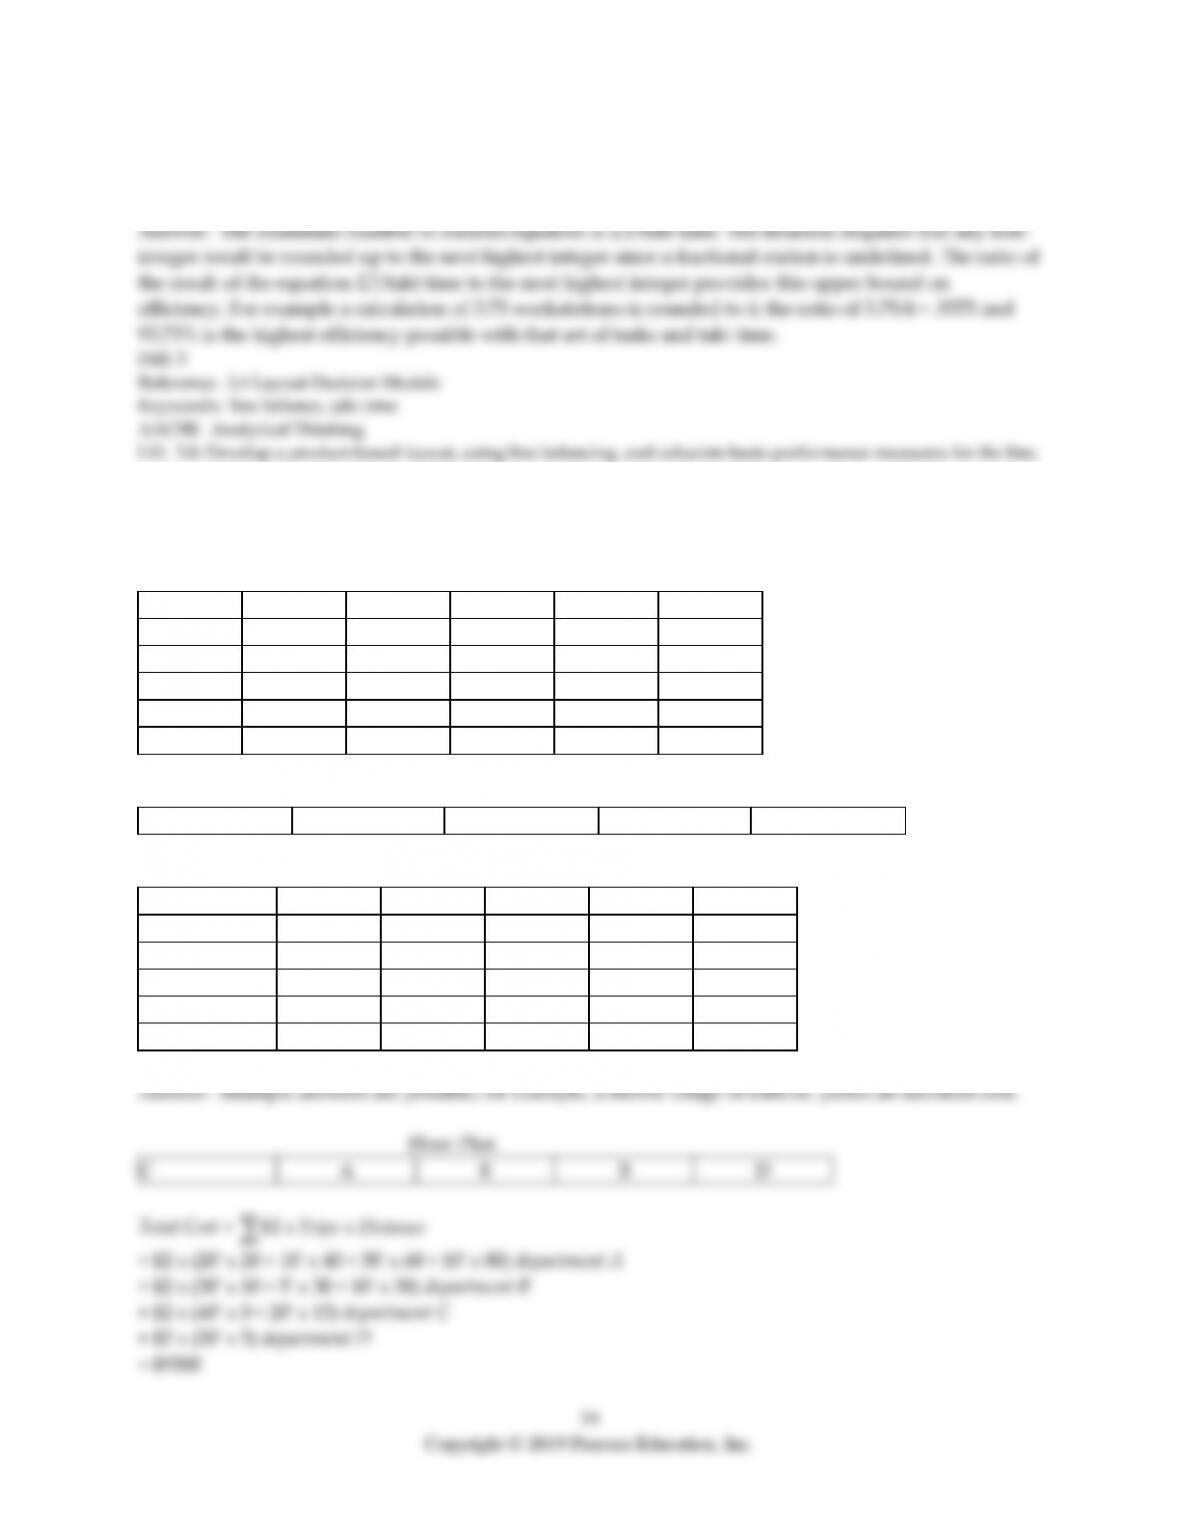
33) Consider any collection of tasks to be assigned to stations in a line balancing exercise. Use the
equation for determining the minimum number of stations to derive an upper bound on the efficiency of
the actual line balance for those same tasks.
34) What is the optimal location for these departments in the floor plan depicted if the transportation cost
is $2 per foot and the departments have a daily number of trips between each other as shown?
Daily Number of Trips Between Departments
A
B
C
D
E
A
—
20
40
60
80
B
—
10
30
50
C
—
0
15
D
—
5
E
—
Floor Plan
Office Space 1
Office Space 2
Office Space 3
Office Space 4
Office Space 5
Distance Between Offices
Office Space
1
2
3
4
5
1
—
10
20
30
40
2
—
10
20
30
3
—
10
20
4
—
5
5
—
C
A
E
B
D
Total Cost =
= $2 x (20′ x 20 + 10′ x 40 + 30′ x 60 + 10‘ x 80) department A
+ $2 x (30′ x 10 + 5′ x 30 + 10′ x 30) department B
+ $2 x (40′ x 0 + 20′ x 15) department C
+ $2 x (20′ x 5) department D
= $9500
35
Copyright © 2019 Pearson Education, Inc.
Diff: 3
Reference: 3.4 Layout Decision Models
Keywords: functional layout
AACSB: Analytical Thinking
LO: 3.9: Develop a functional layout based on total distance traveled.
35) What is the optimal location for these departments in the floor plan depicted if the departments have
a daily number of trips between each other as shown? The total number of trips is accounted for in the
table, so for example, the 16 trips between A and B are some combination of trips from A to B and from B
to A.
Daily Number of Trips Between Departments
A
B
C
D
E
F
G
H
I
A
—
16
18
9
3
9
10
3
14
B
—
4
12
2
10
19
4
16
C
—
18
3
8
8
0
10
D
—
3
14
1
5
7
E
—
1
17
15
12
F
—
19
15
4
G
—
8
17
H
—
14
I
—
Floor Plan
Office Space 1
Office Space 4
Office Space 7
Office Space 2
Office Space 5
Office Space 8
Office Space 3
Office Space 6
Office Space 9
Distance Between Offices
Office Space
1
2
3
4
5
6
7
8
9
1
—
10
20
10
14
22
20
22
28
2
—
10
14
10
14
22
20
22
3
—
22
14
10
28
22
20
4
—
10
20
10
14
22
5
—
10
14
10
14
6
—
22
14
10
7
—
10
20
8
—
10
9
—
Office Space 1=B
Office Space 4=G
Office Space 7=E
Office Space 2=A
Office Space 5=I
Office Space 8=H
Office Space 3=C
Office Space 6=D
Office Space 9=F
36
Copyright © 2019 Pearson Education, Inc.
The total movement with this arrangement is 4896.
Total Cost =
Diff: 3
Reference: 3.4 Layout Decision Models
Keywords: functional layout
AACSB: Analytical Thinking
LO: 3.9: Develop a functional layout based on total distance traveled.