Chapter 03 – Forecasting
98. Current information on _________ can have a significant impact on forecast accuracy:
99. A managerial approach toward forecasting which seeks to actively influence demand is:
Chapter 03 – Forecasting
100. Customer service levels can be improved by better:
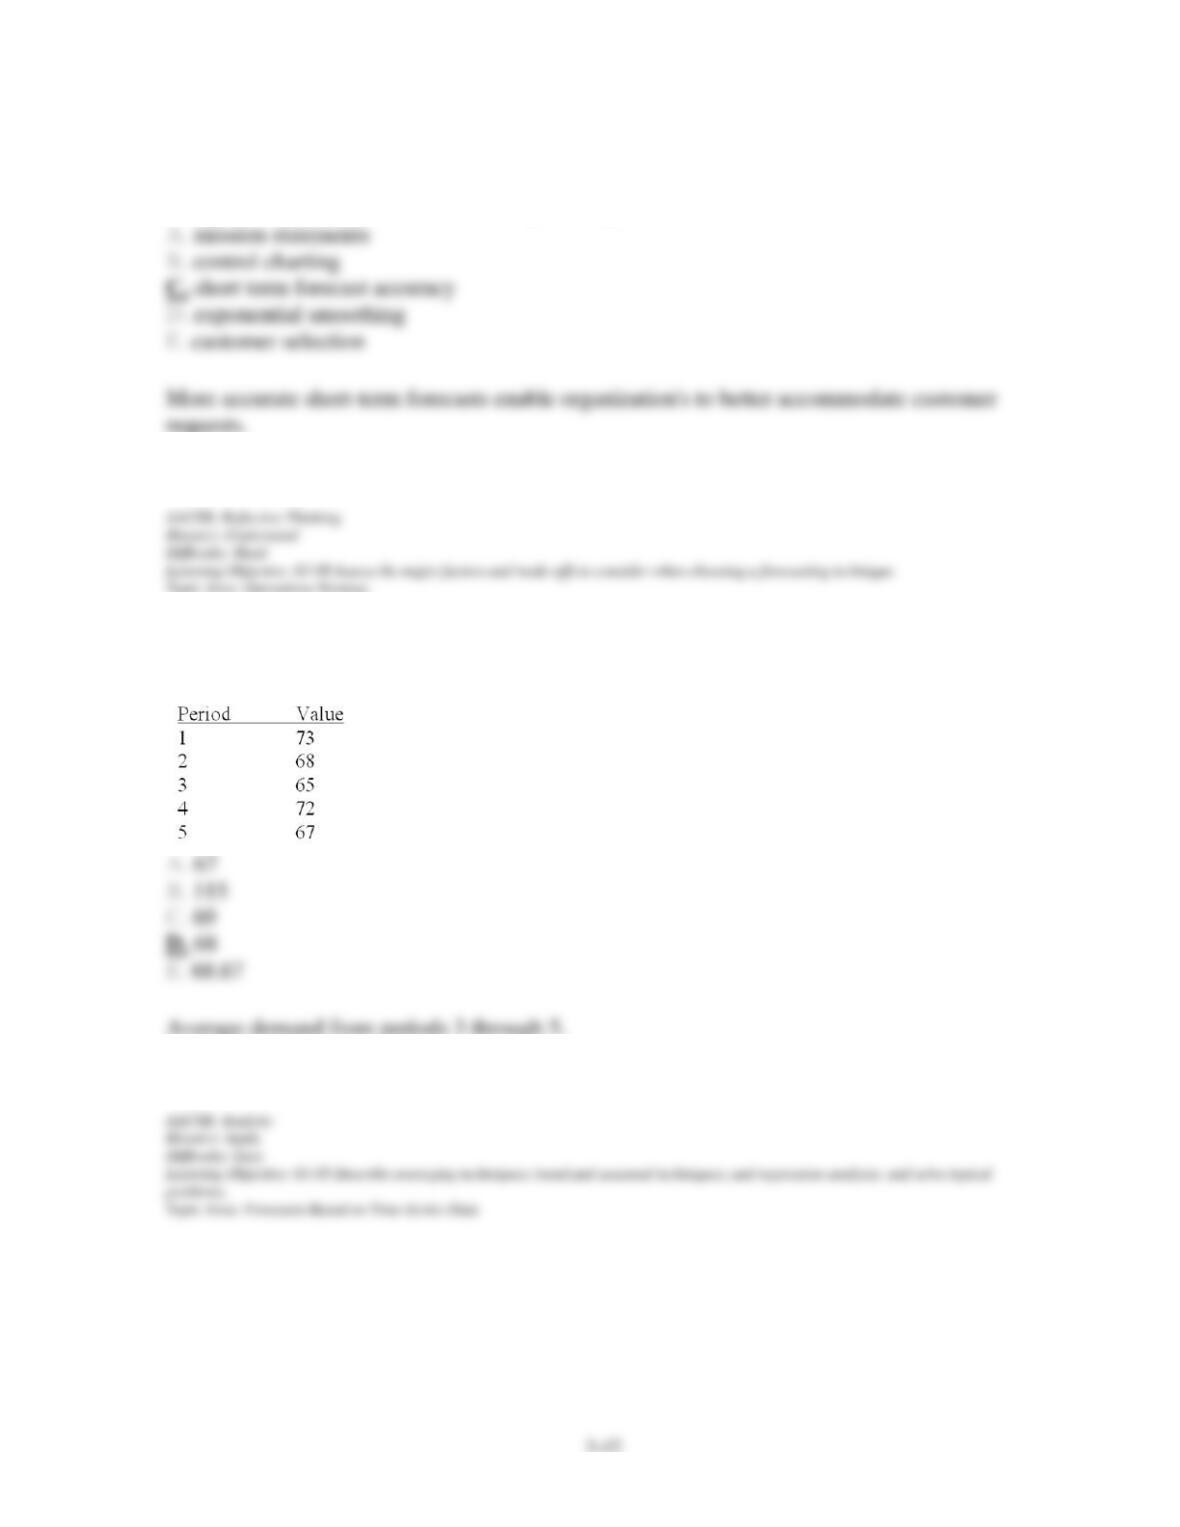
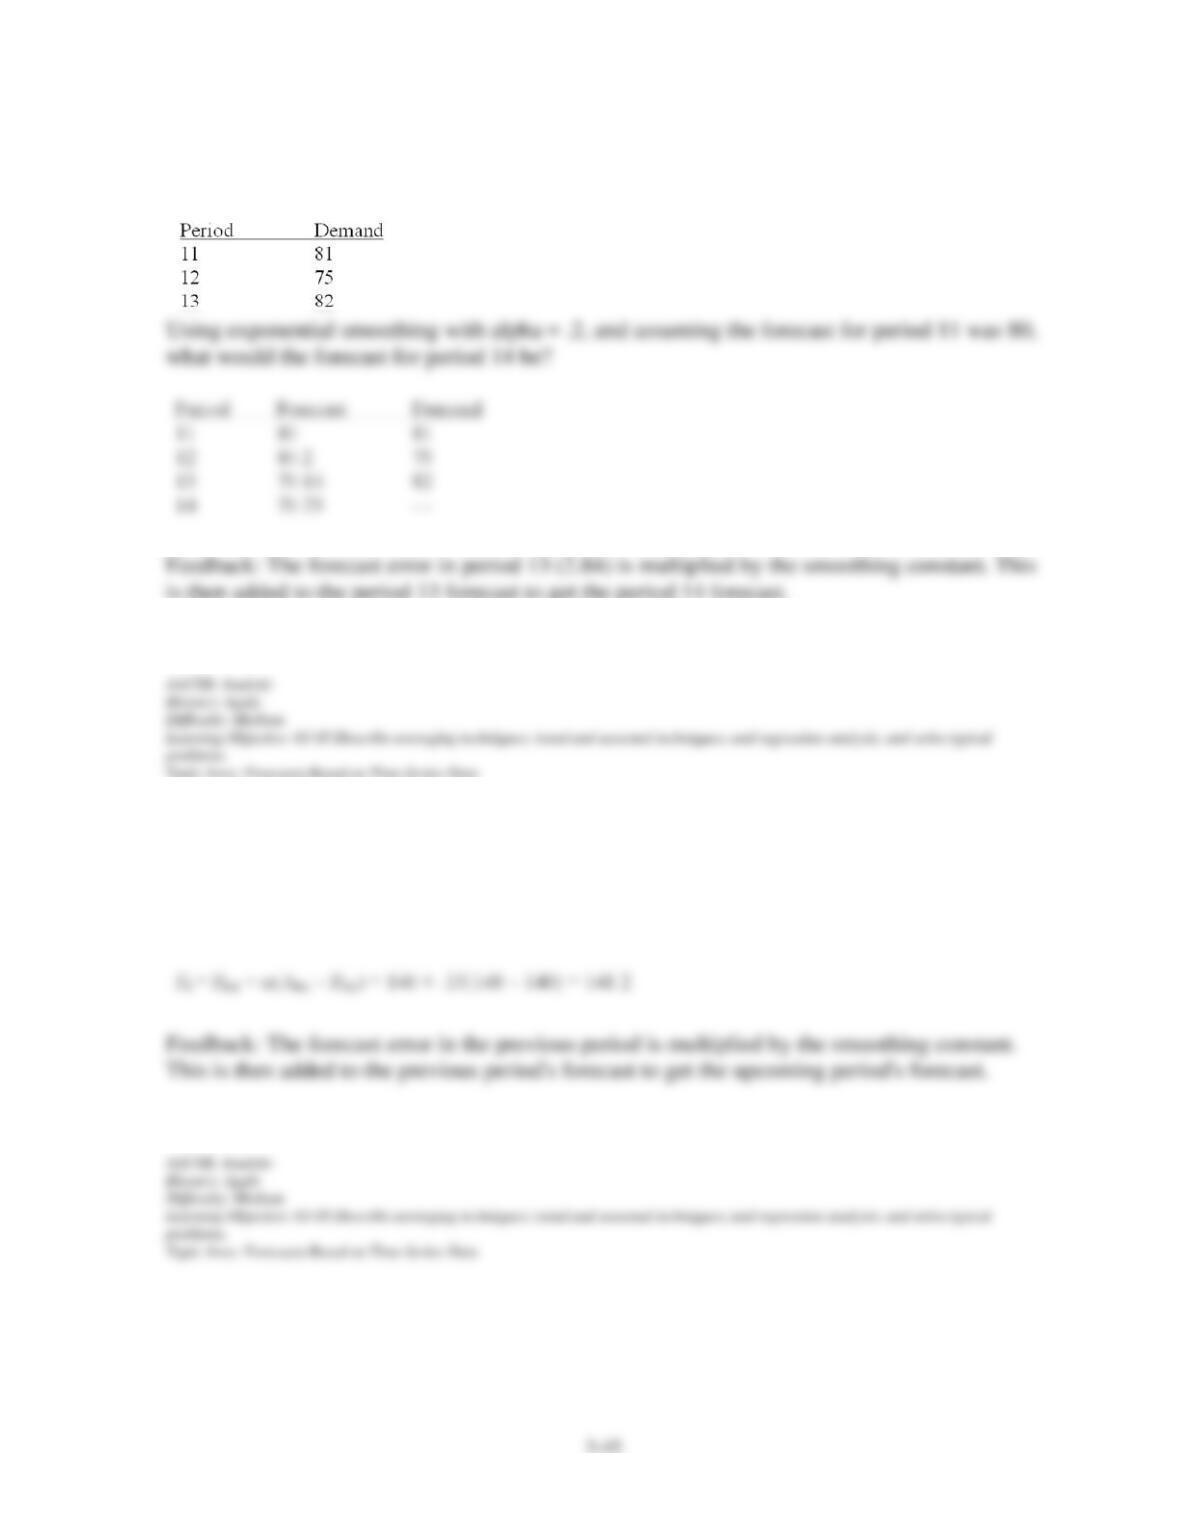
101. Given the following historical data, what is the simple three-period moving average
forecast for period 6?
Chapter 03 – Forecasting
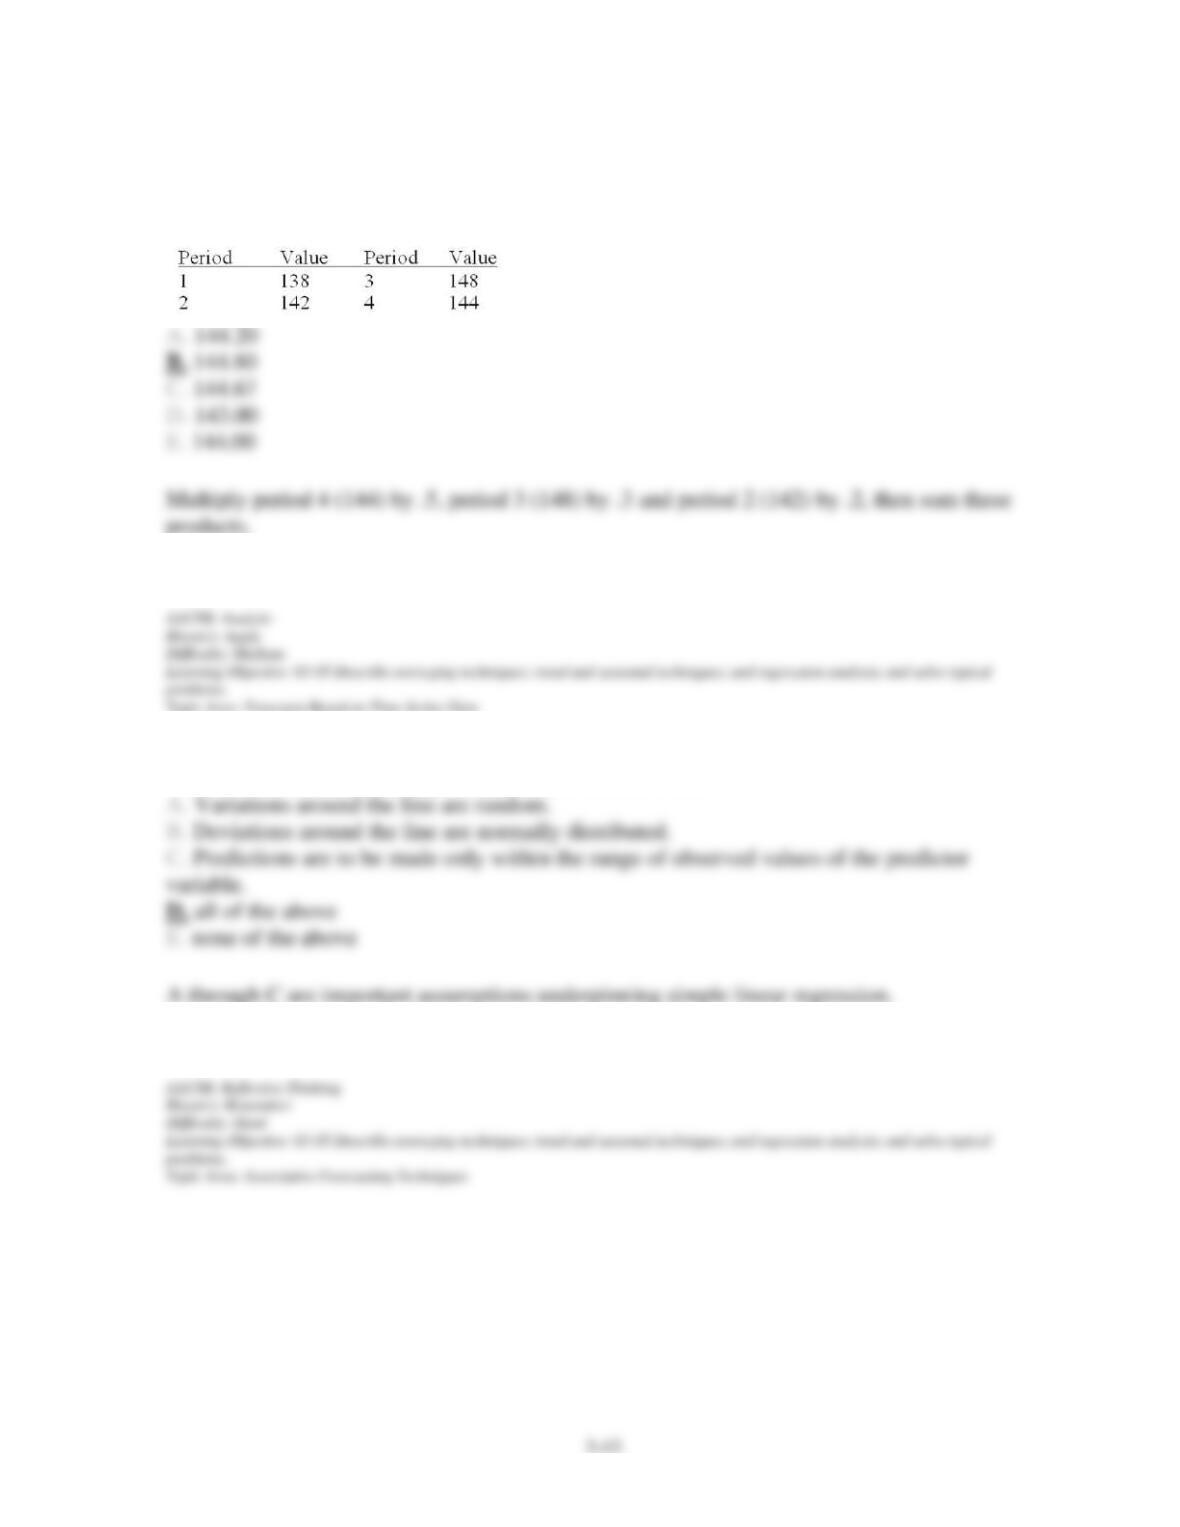
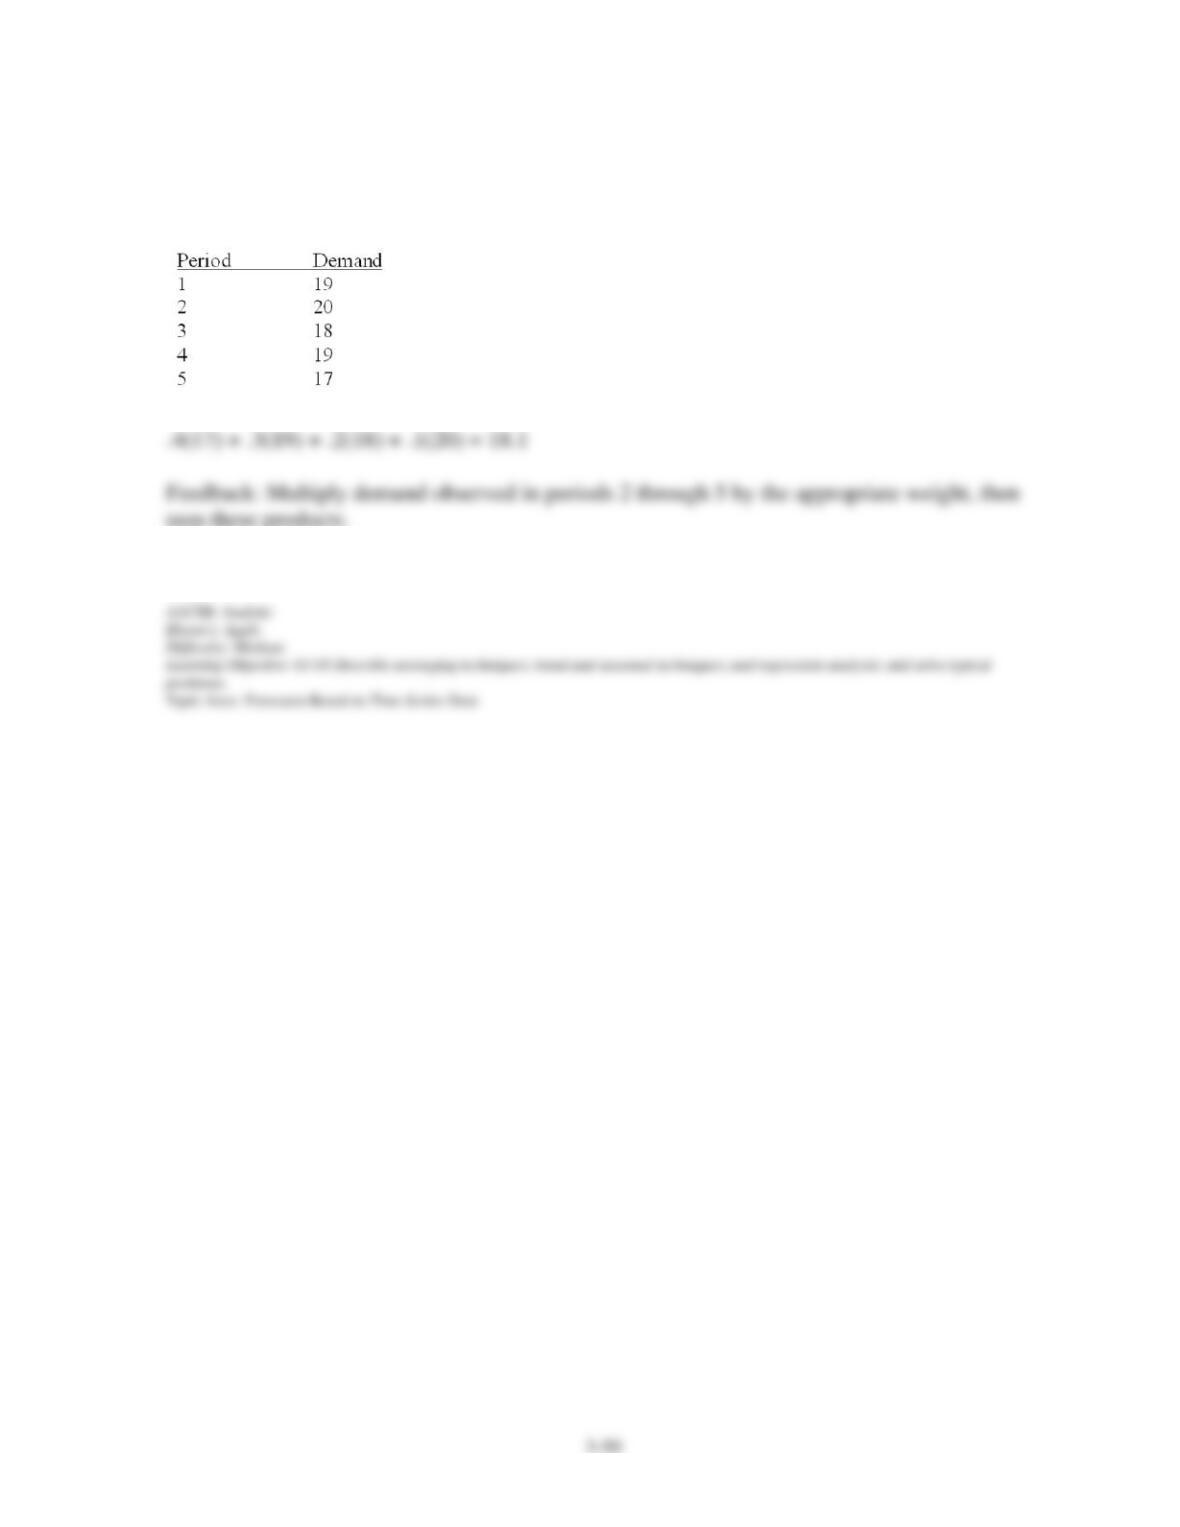
102. Given the following historical data and weights of .5, .3, and .2, what is the three-period
moving average forecast for period 5?
103. Use of simple linear regression analysis assumes that:
Chapter 03 – Forecasting
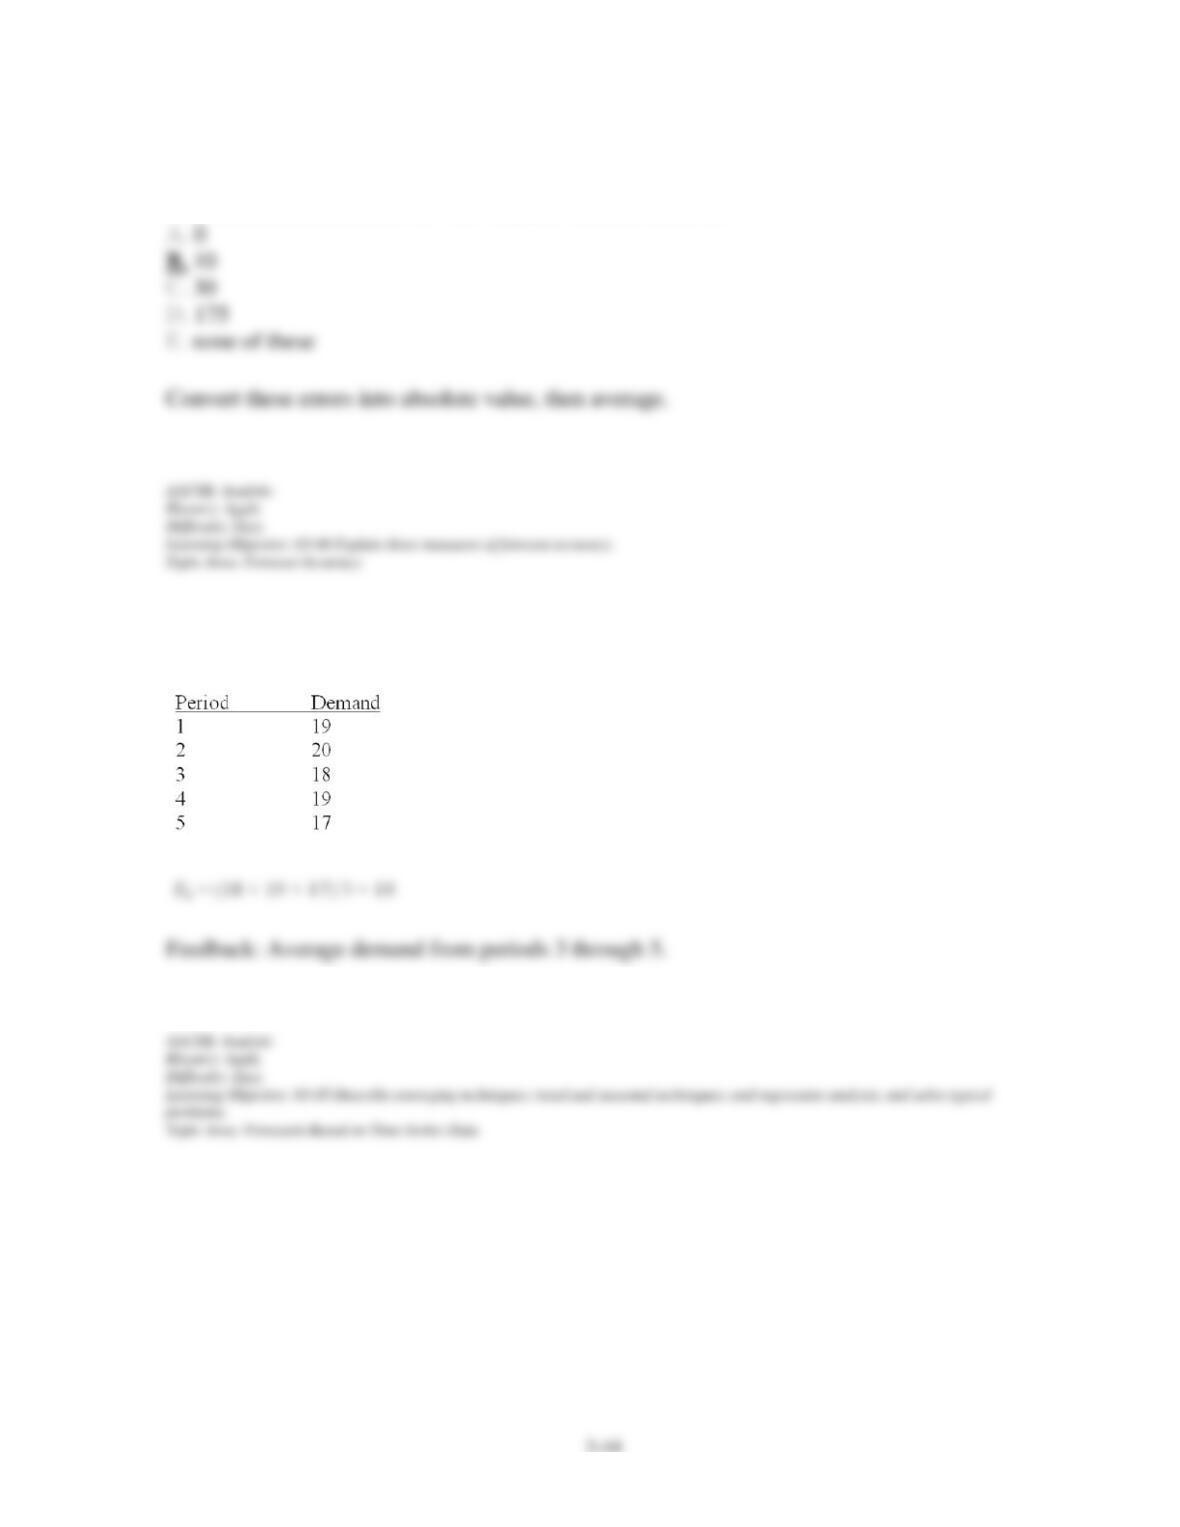
104. Given forecast errors of – 5, – 10, and +15, the MAD is:
105. Develop a forecast for the next period, given the data below, using a 3-period moving
average.
Chapter 03 – Forecasting
106. Consider the data below:
107. A manager is using exponential smoothing to predict merchandise returns at a suburban
branch of a department store chain. Given a previous forecast of 140 items, an actual number
of returns of 148 items, and a smoothing constant equal to .15, what is the forecast for the
next period?
Chapter 03 – Forecasting
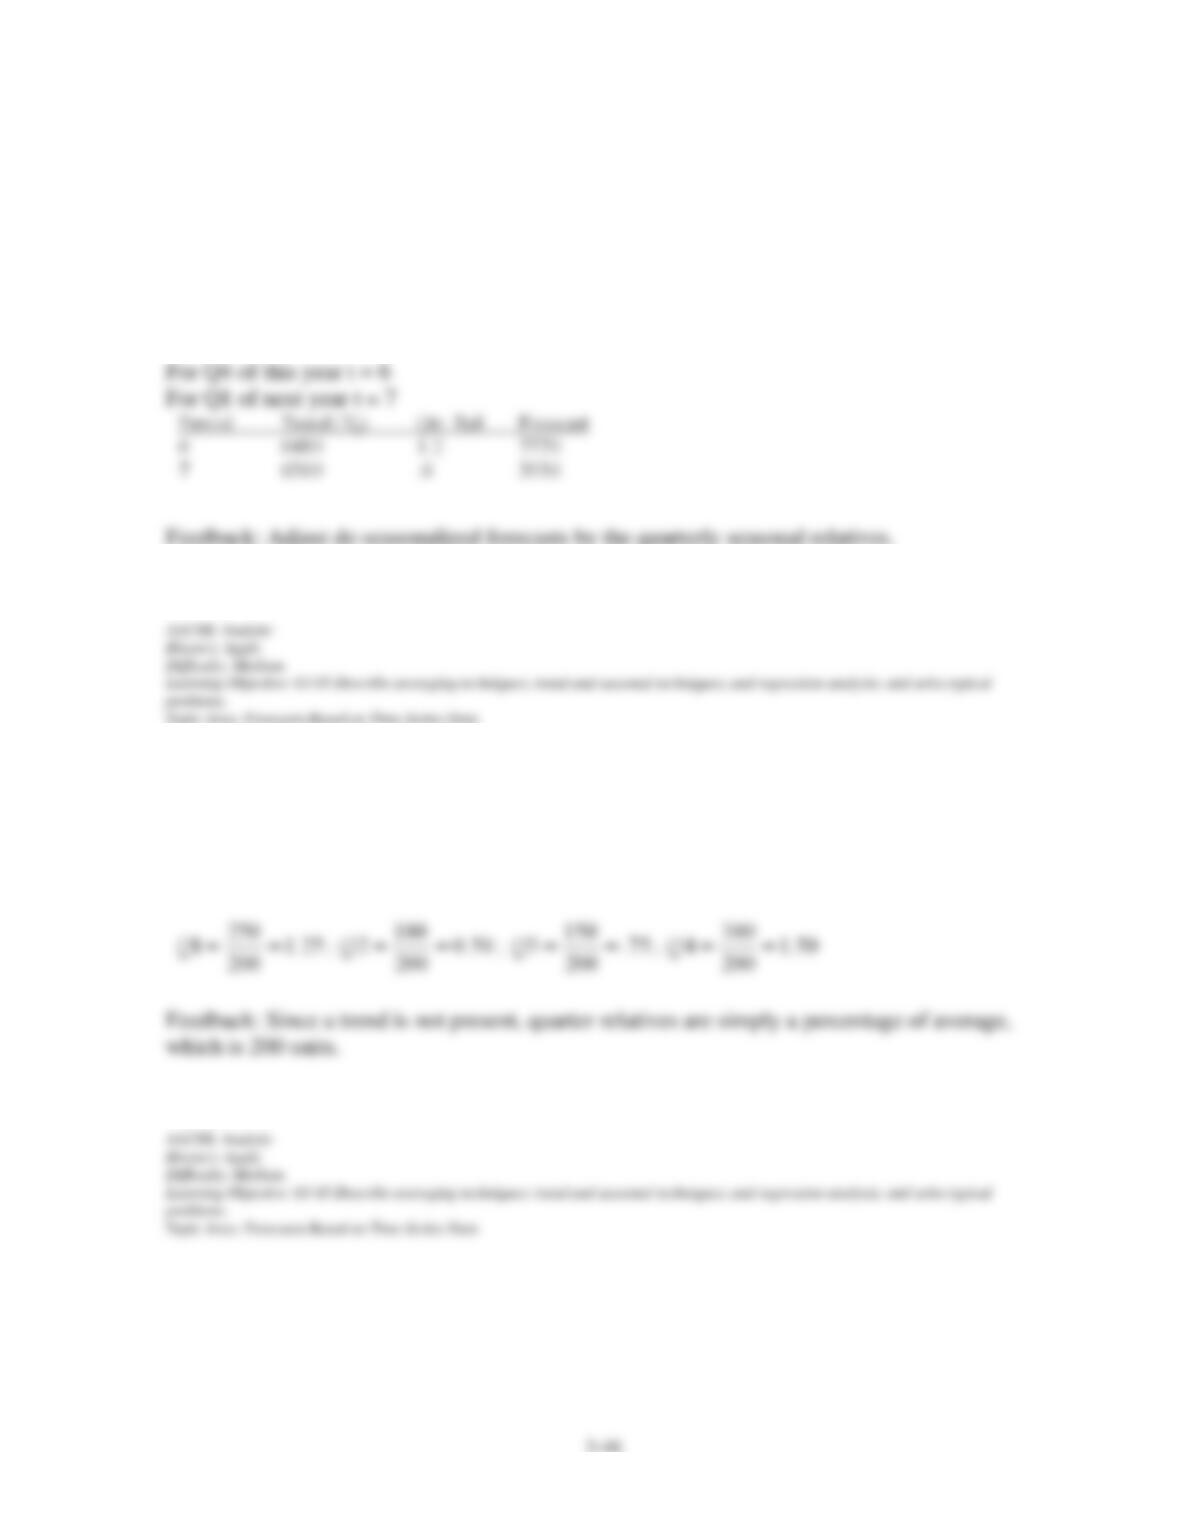
108. A manager is using the equation below to forecast quarterly demand for a product:
Yt = 6,000 + 80t where t = 0 at Q2 of last year
Quarter relatives are Q1 = .6, Q2 = .9, Q3 = 1.3, and Q4 = 1.2.
What forecasts are appropriate for the last quarter of this year and the first quarter of next
year?
109. Over the past five years, a firm’s sales have averaged 250 units in the first quarter of each
year, 100 units in the second quarter, 150 units in the third quarter, and 300 units in the fourth
quarter. What are appropriate quarter relatives for this firm’s sales? Hint: Only minimal
computations are necessary.
Chapter 03 – Forecasting
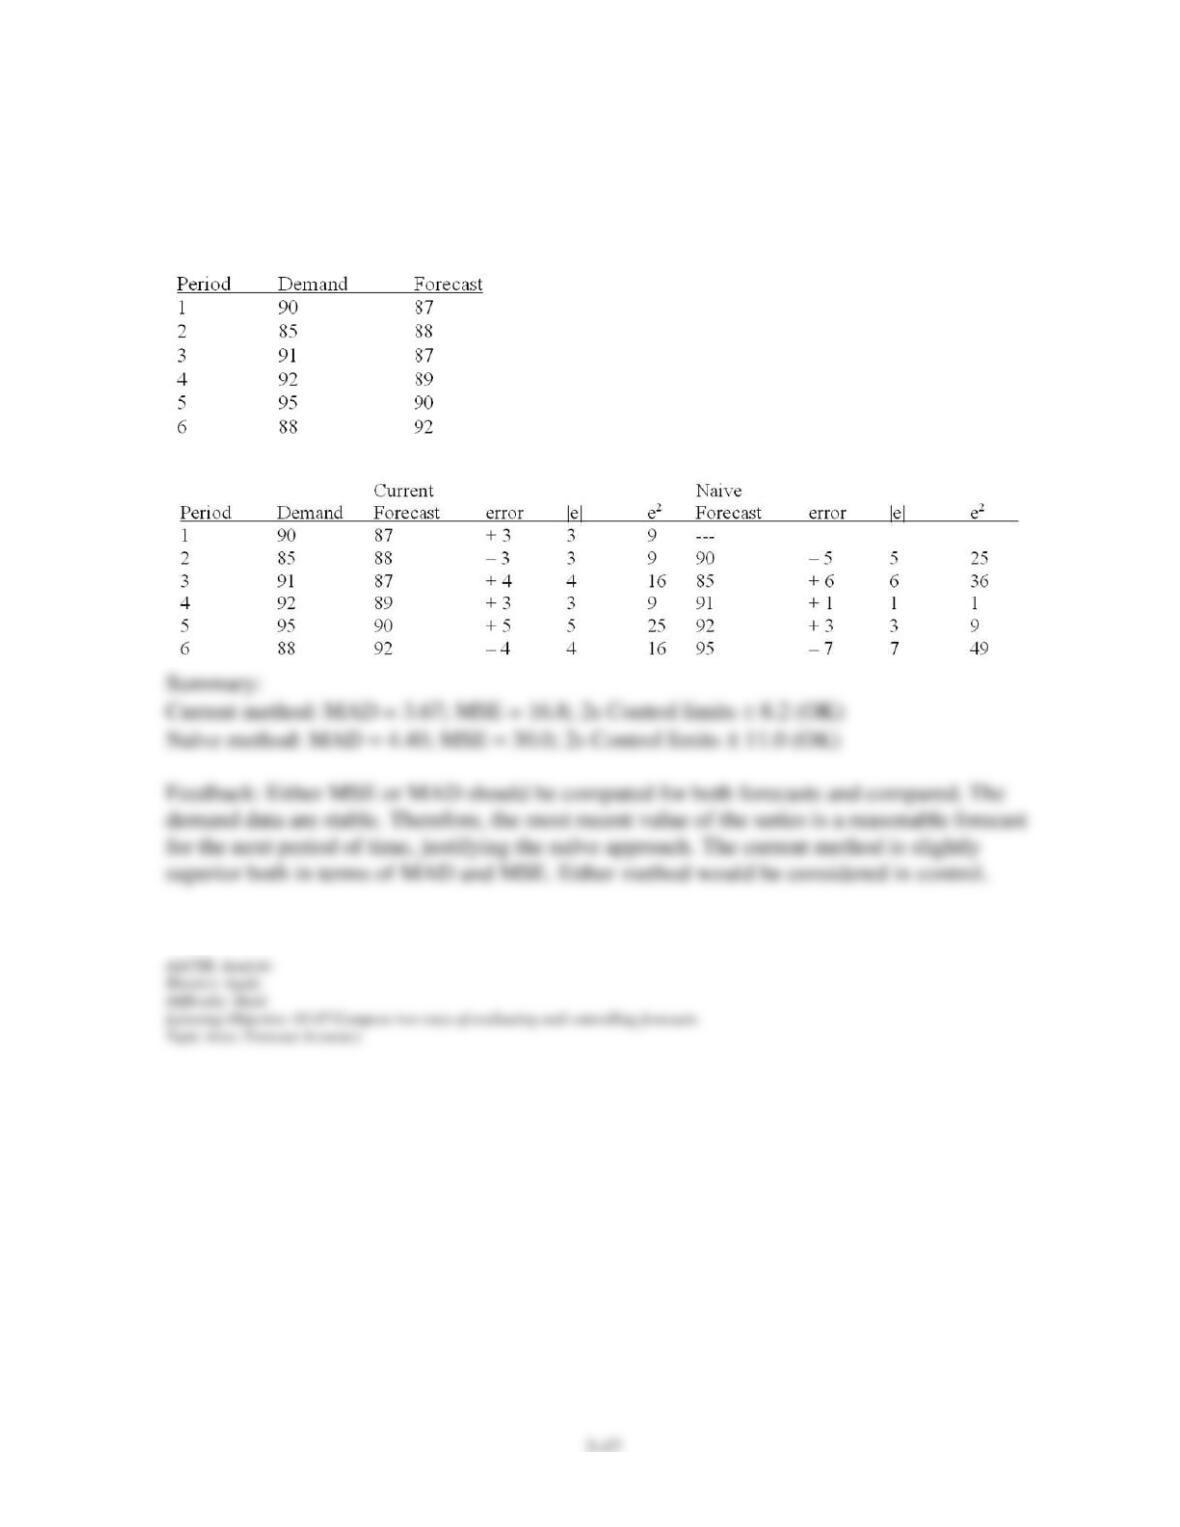
110. A manager has been using a certain technique to forecast demand for gallons of ice
cream for the past six periods. Actual and predicted amounts are shown below. Would a naive
forecast have produced better results?
Chapter 03 – Forecasting
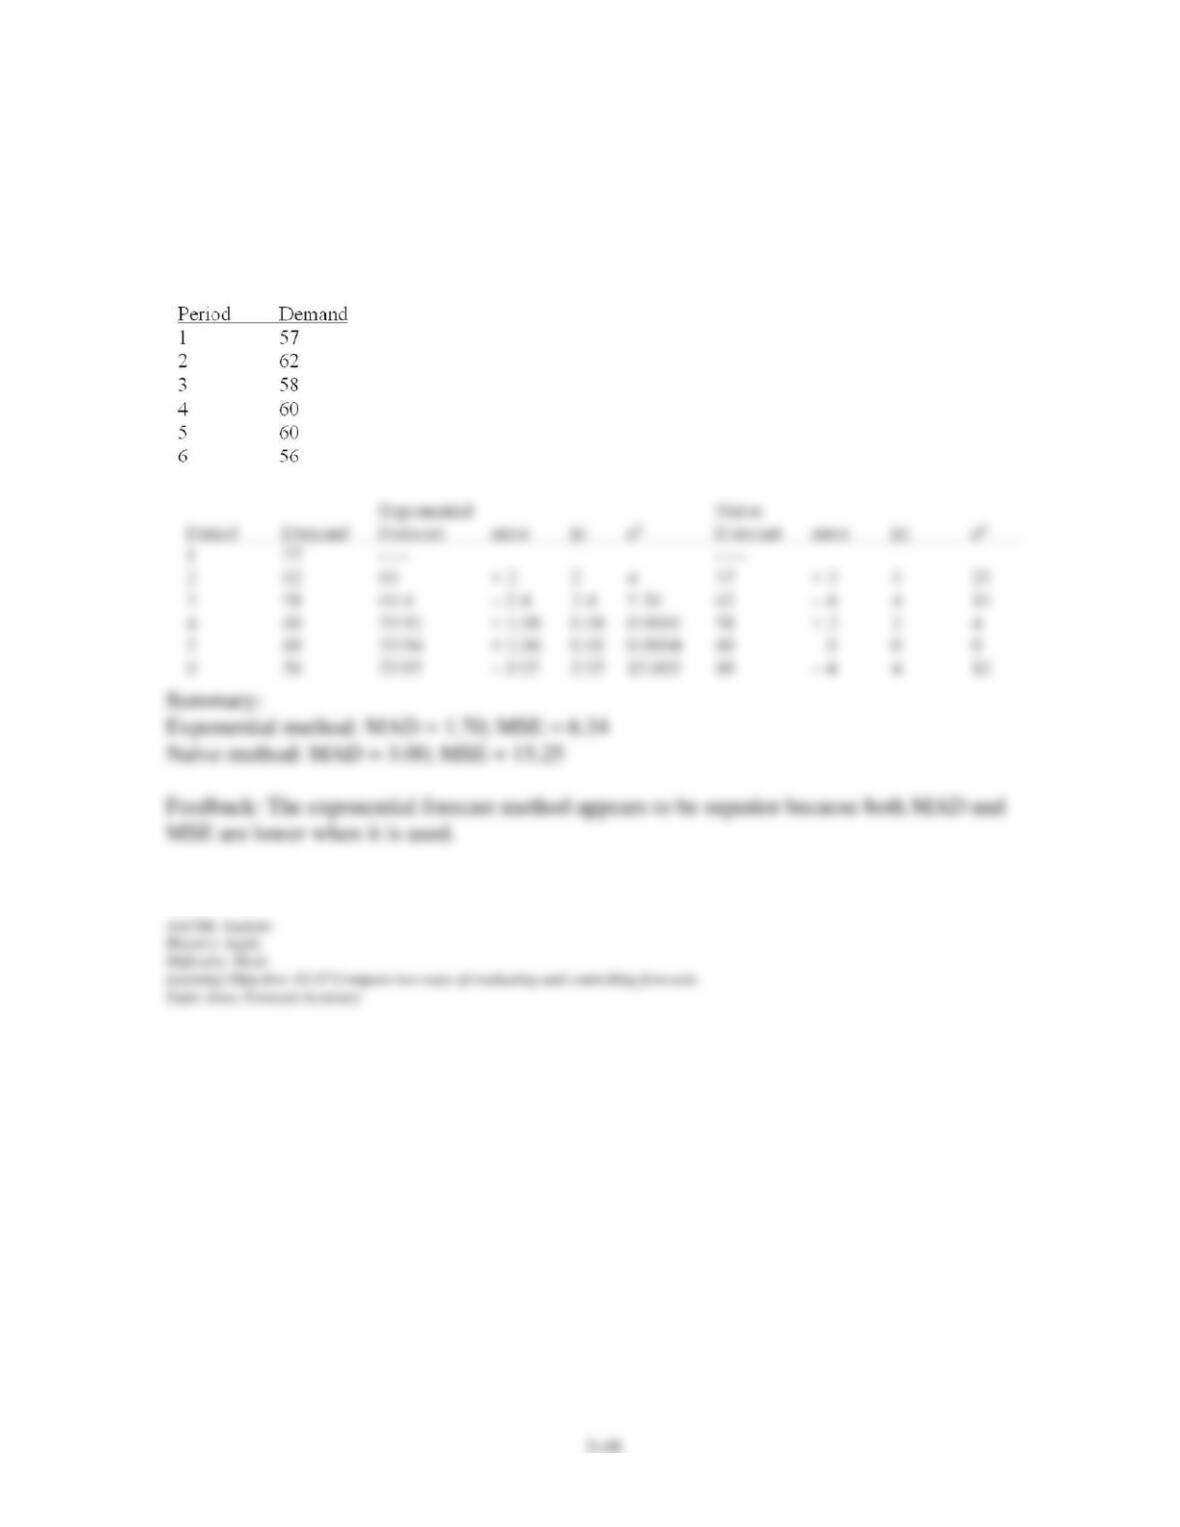
111. A new car dealer has been using exponential smoothing with an alpha of .2 to forecast
weekly new car sales. Given the data below, would a naive forecast have provided greater
accuracy? Explain. Assume an initial exponential forecast of 60 units in period 2 (i.e., no
forecast for period 1).
Chapter 03 – Forecasting
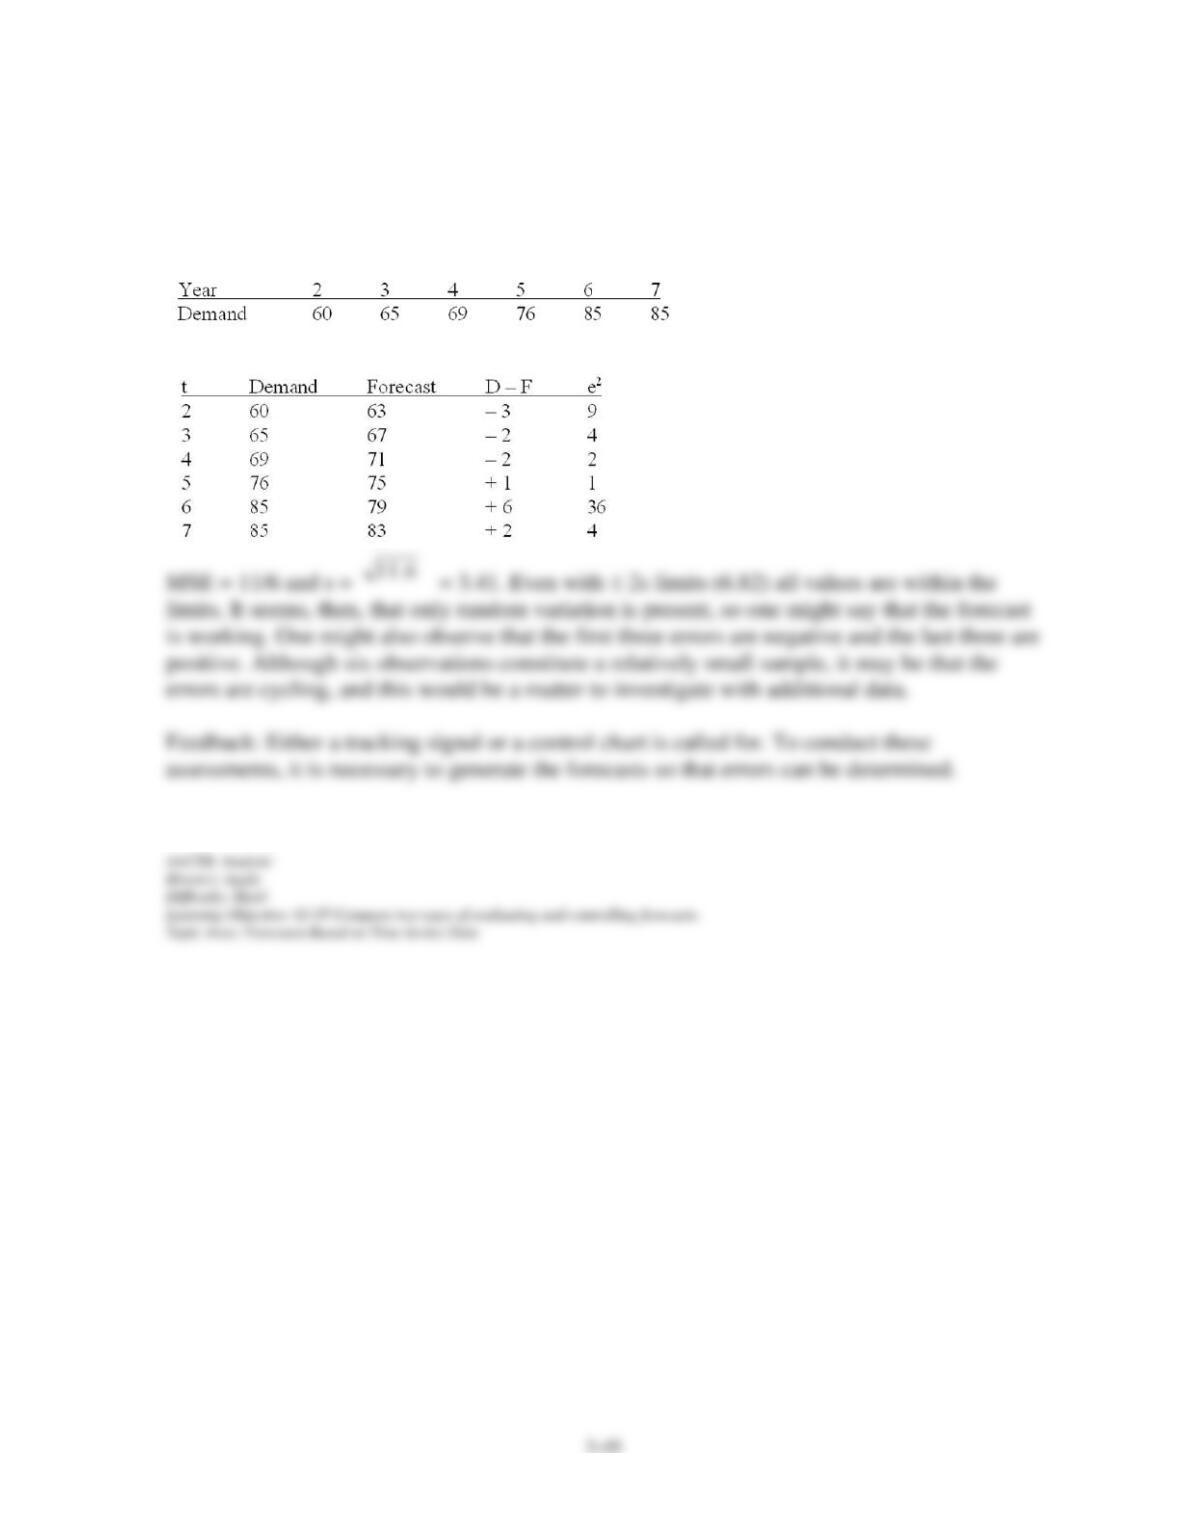
112. A CPA firm has been using the following equation to predict annual demand for tax
audits: Yt = 55 + 4t Demand for the past few years is shown below. Is the forecast performing
as well as it might? Explain.
Chapter 03 – Forecasting
113. Given the data below, develop a forecast for period 6 using a four-period weighted
moving average and weights of .4, .3, .2 and .1
Chapter 03 – Forecasting
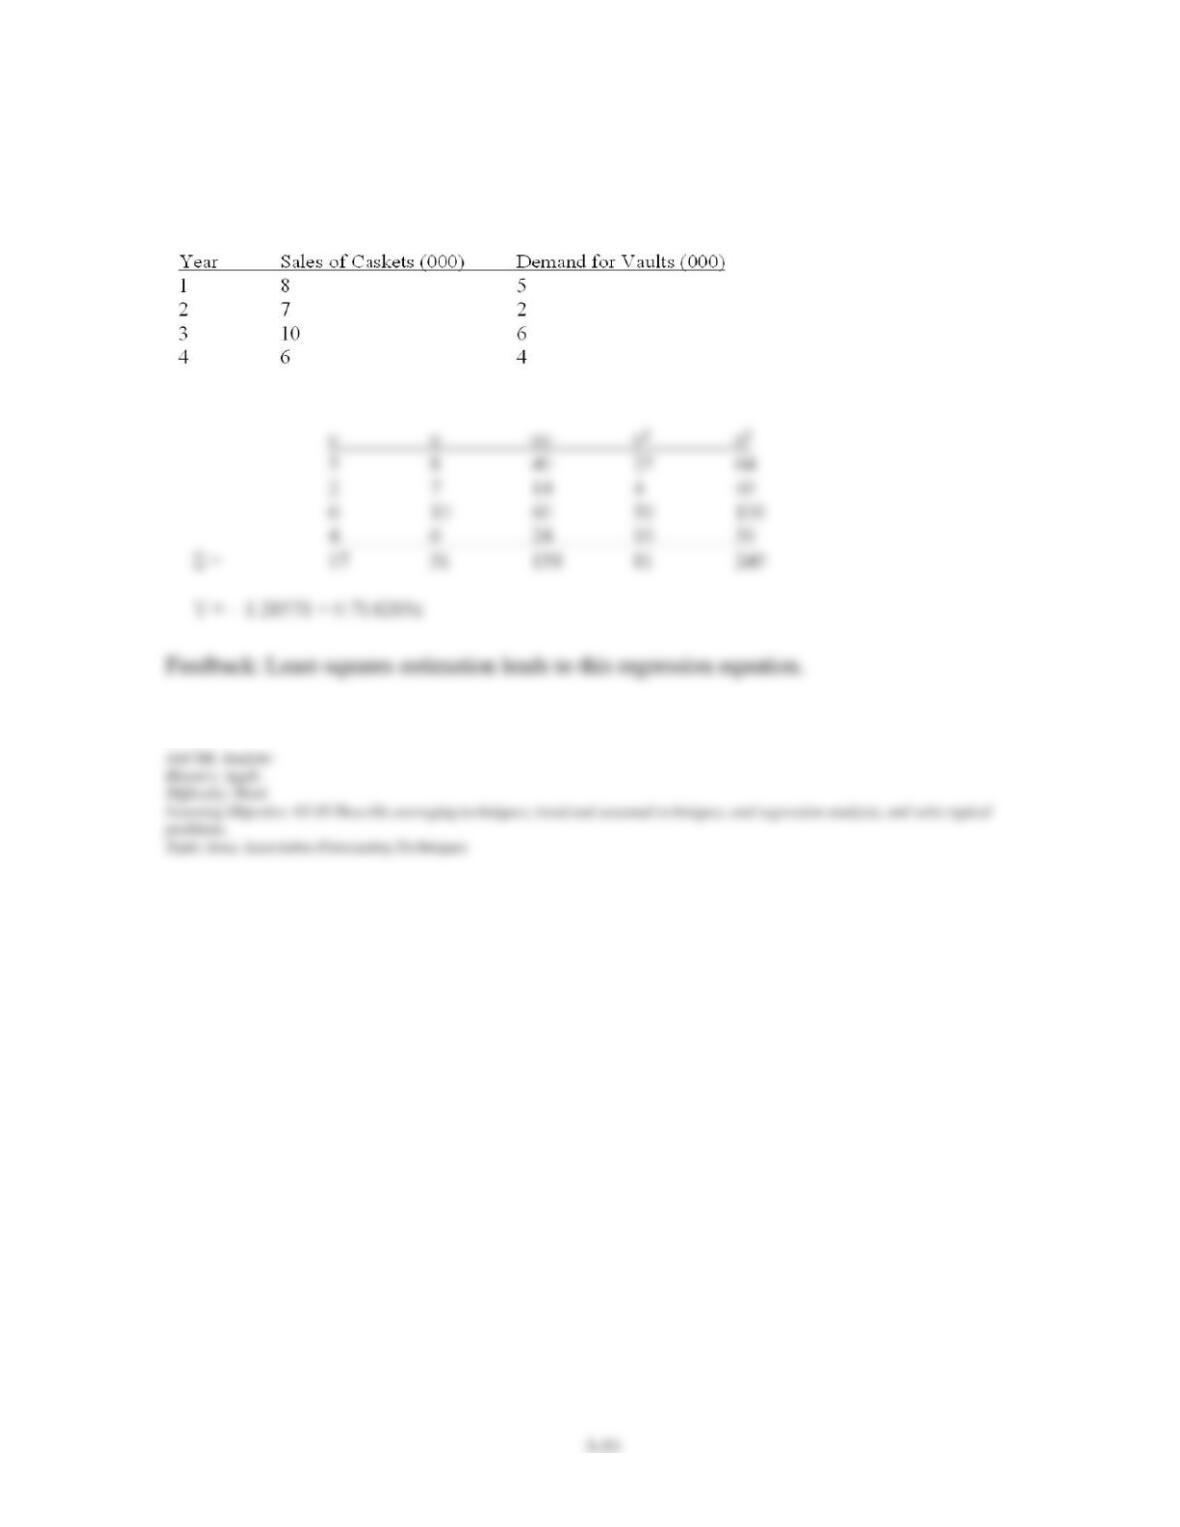
114. Use linear regression to develop a predictive model for demand for burial vaults based
on sales of caskets.
A) Develop the regression equation.
Chapter 03 – Forecasting
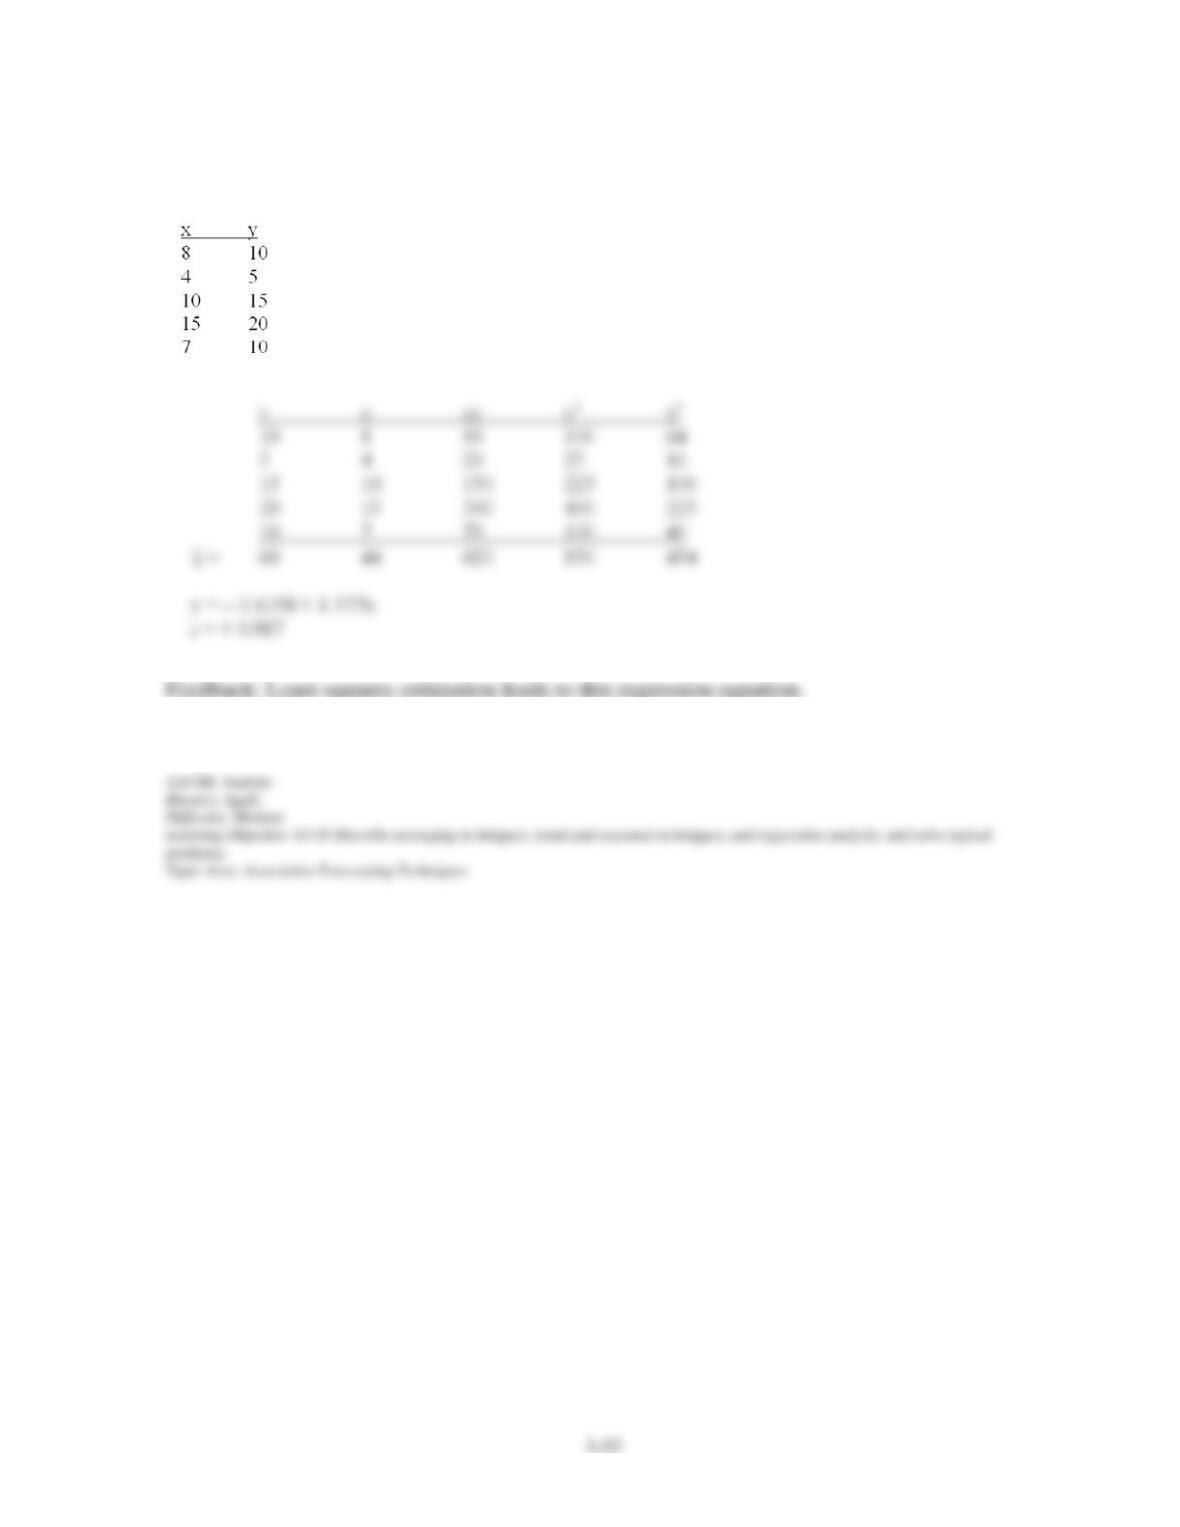
115. Given the following data, develop a linear regression model for y as a function of x.
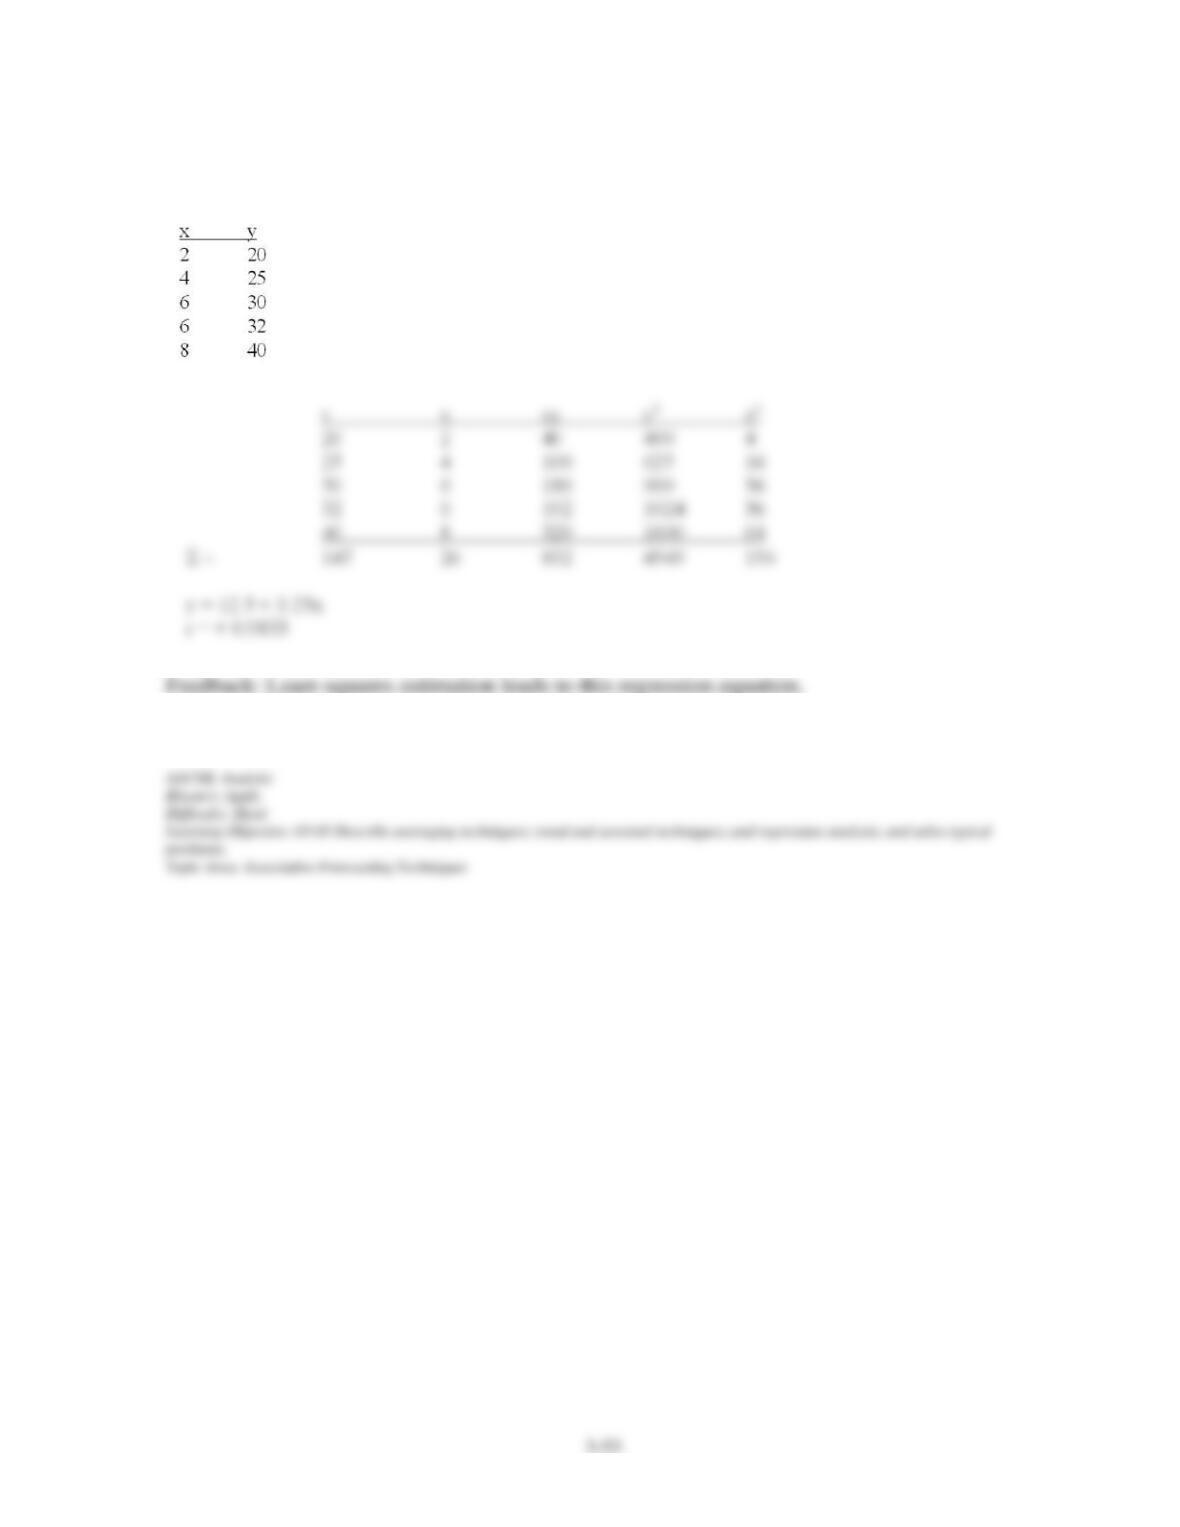
Chapter 03 – Forecasting
116. Given the following data, develop a linear regression model for y as a function of x.
Chapter 03 – Forecasting
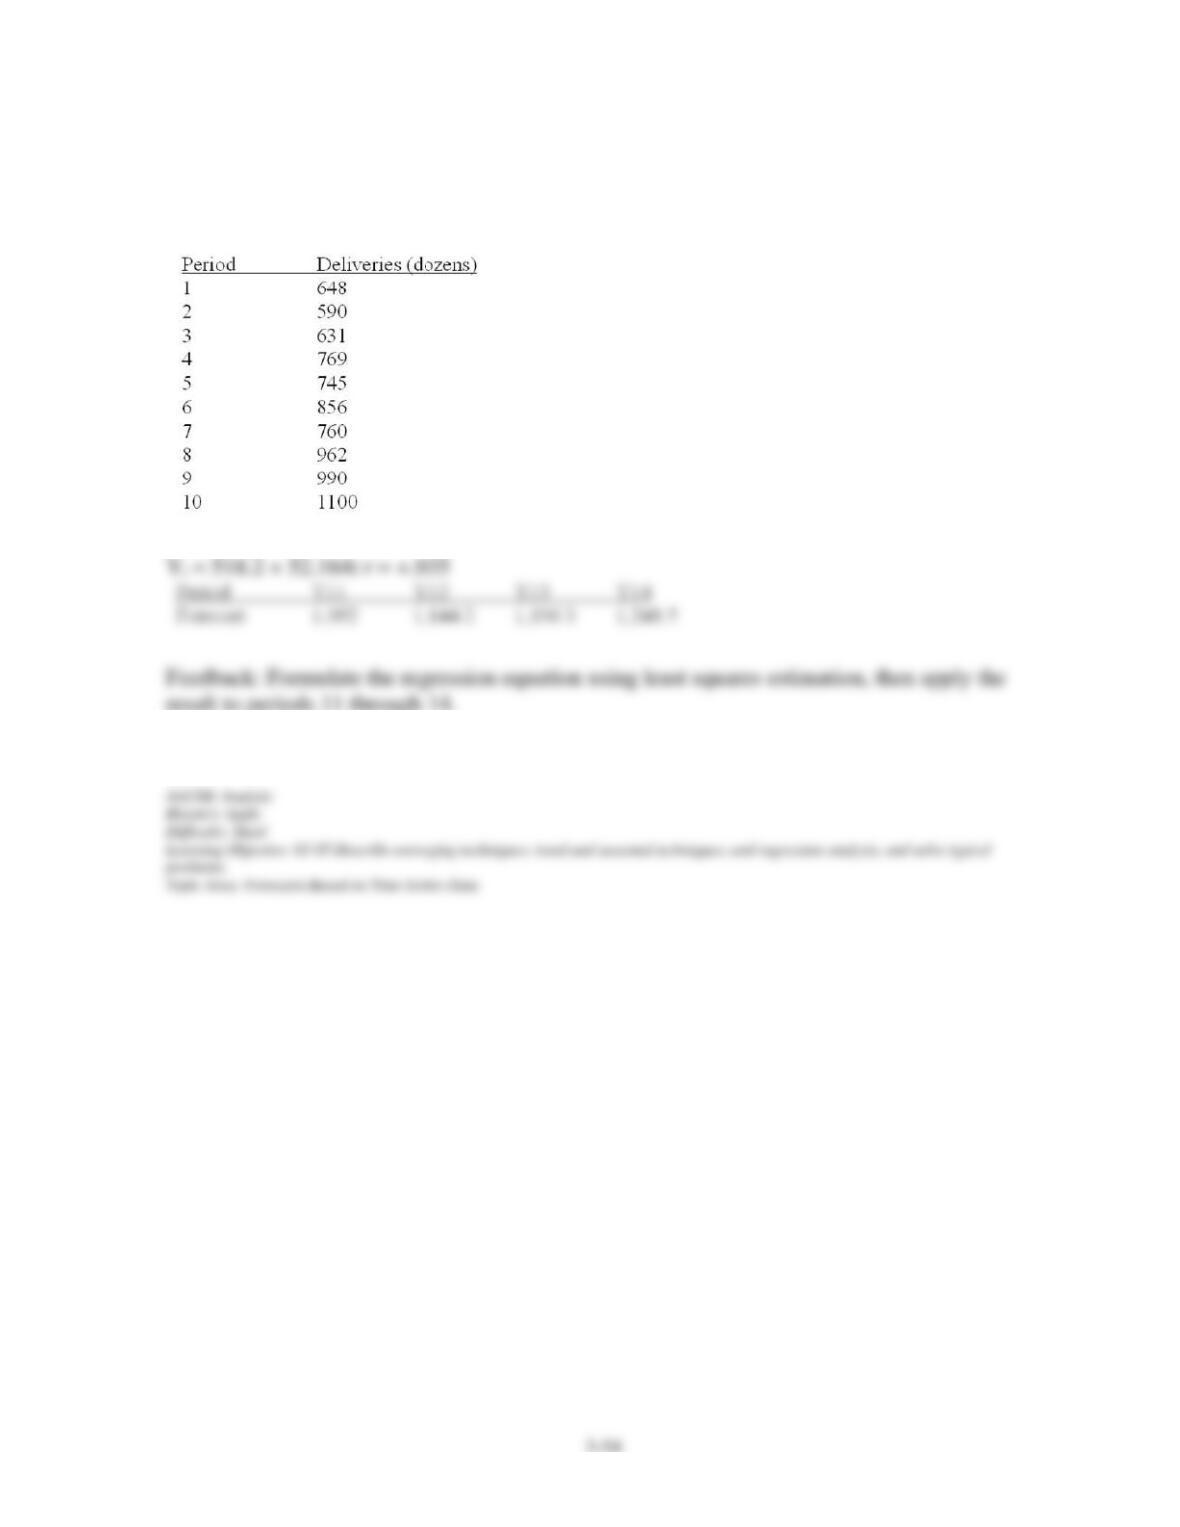
117. Develop a linear trend equation for the data on bread deliveries shown below. Forecast
deliveries for period 11 through 14.
Chapter 03 – Forecasting
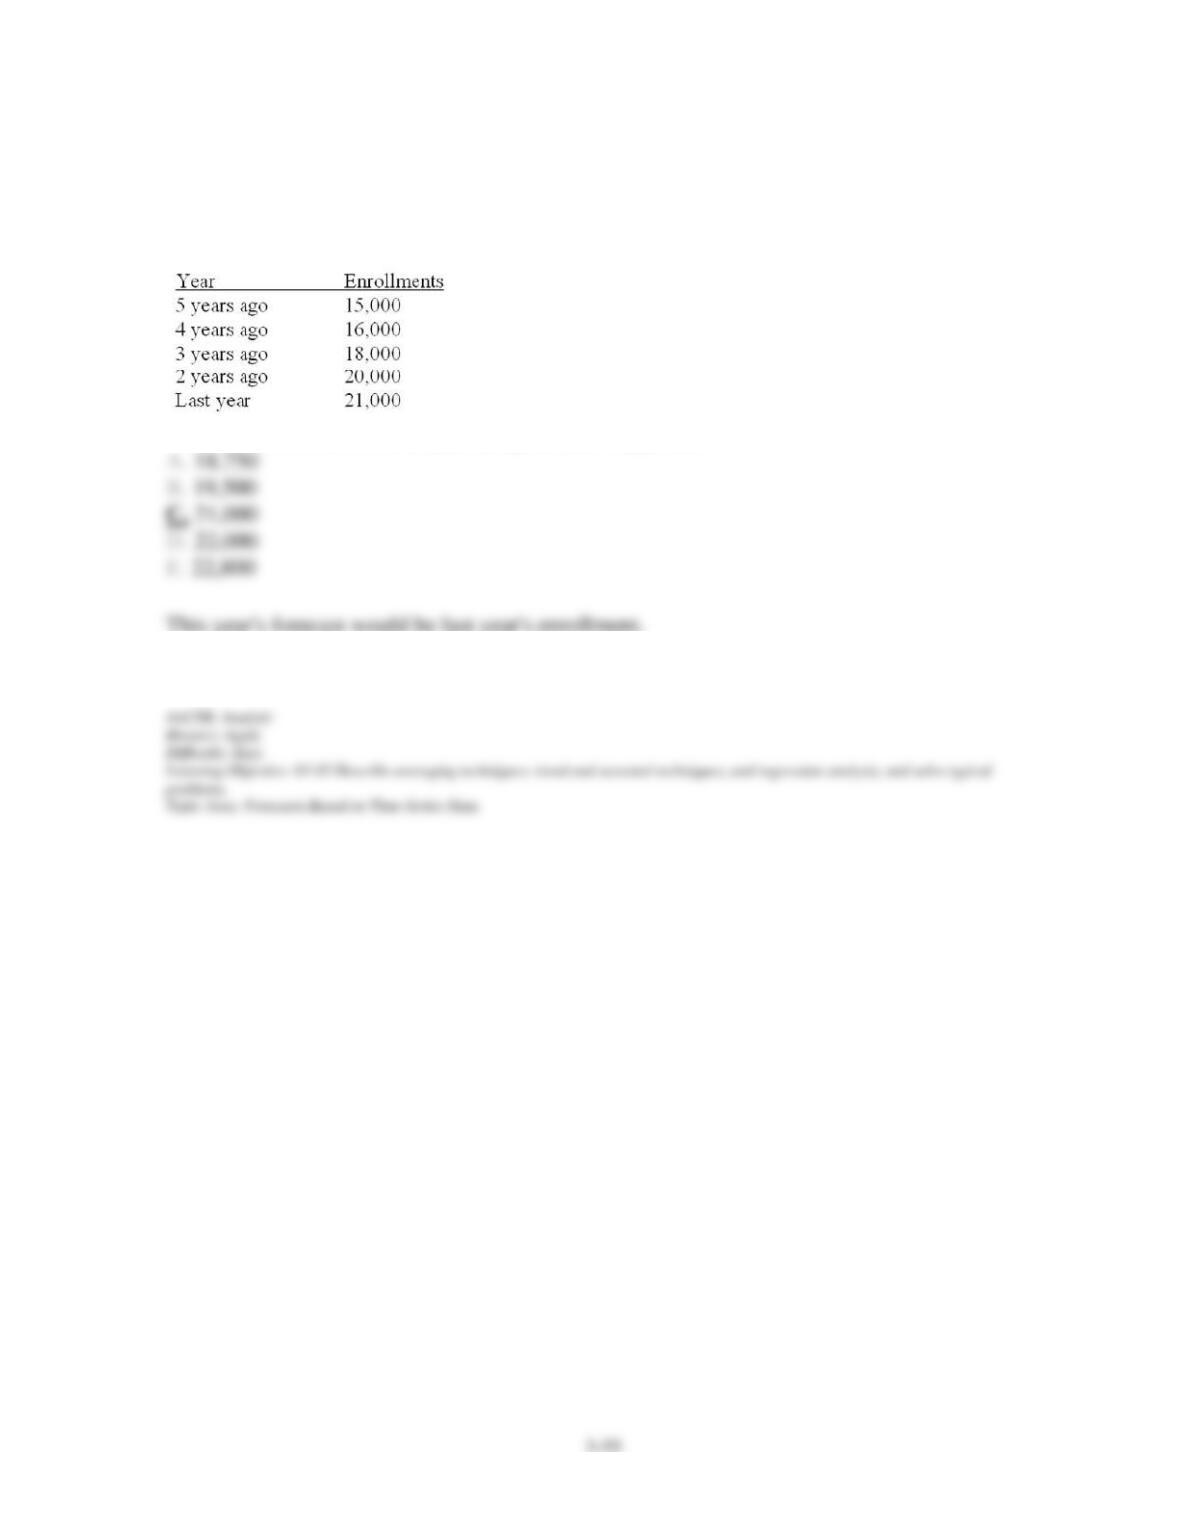
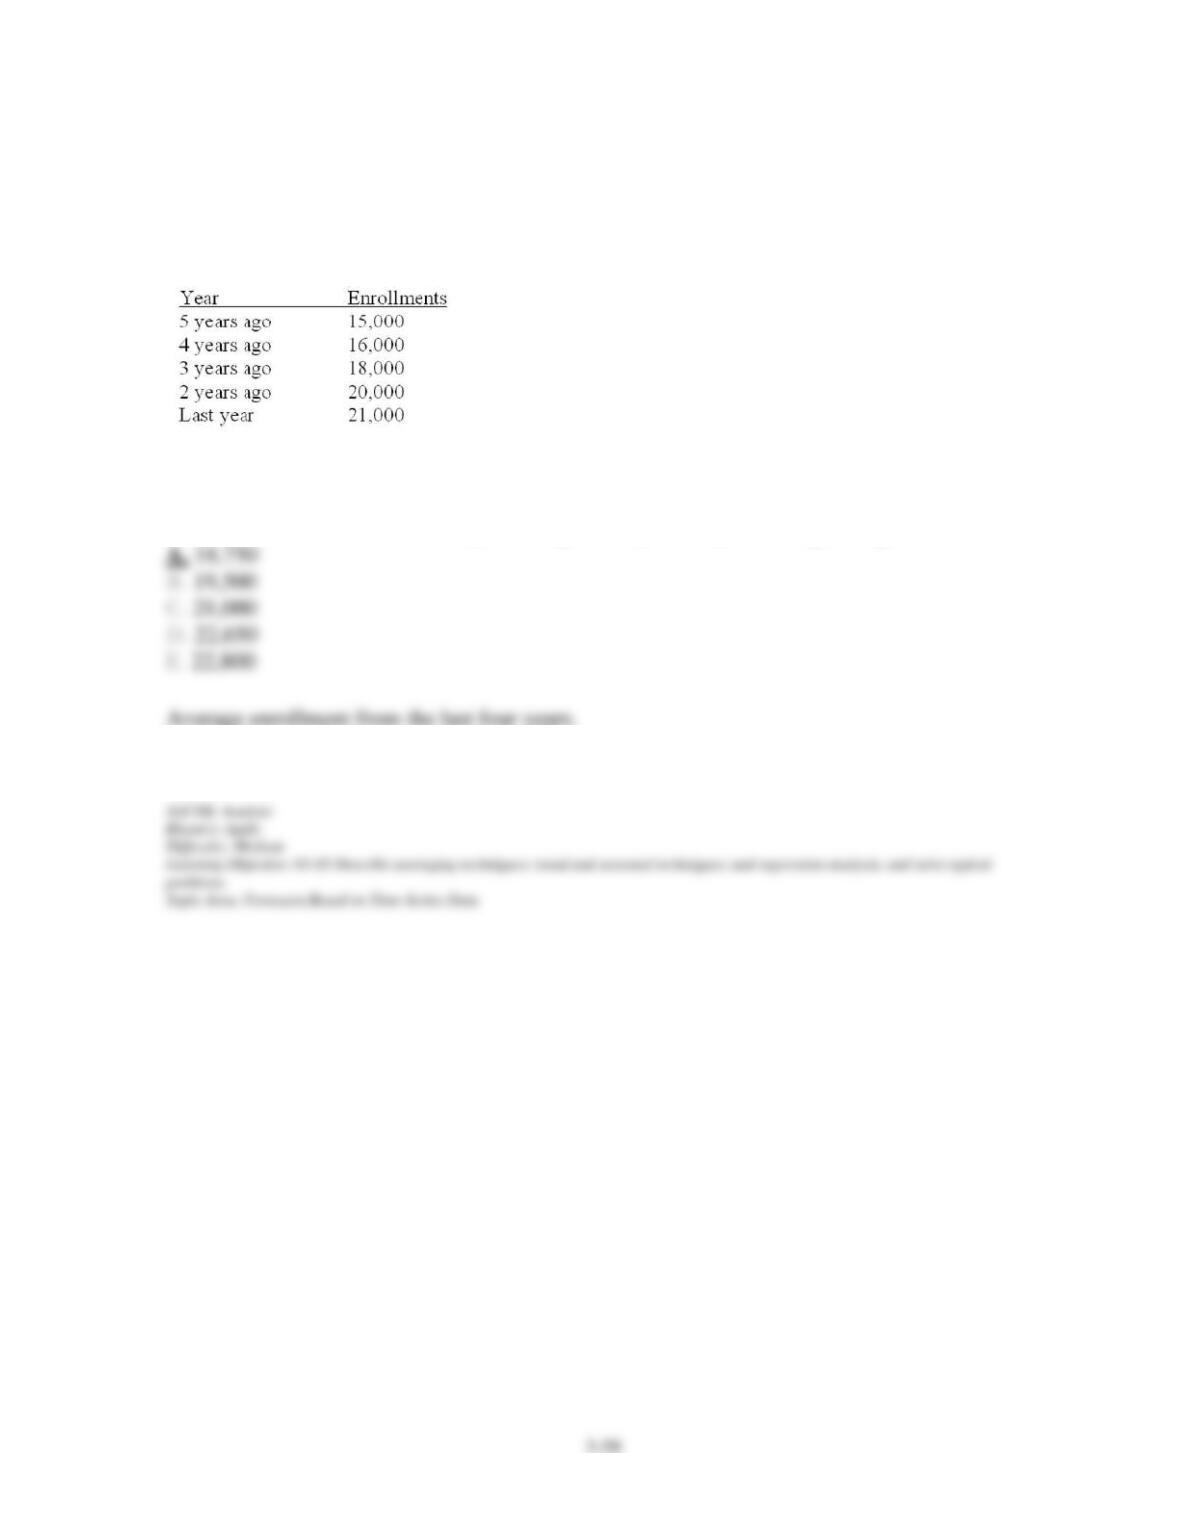
118. The president of State University wants to forecast student enrollments for this academic
year based on the following historical data:
What is the forecast for this year using the naive approach?
Chapter 03 – Forecasting
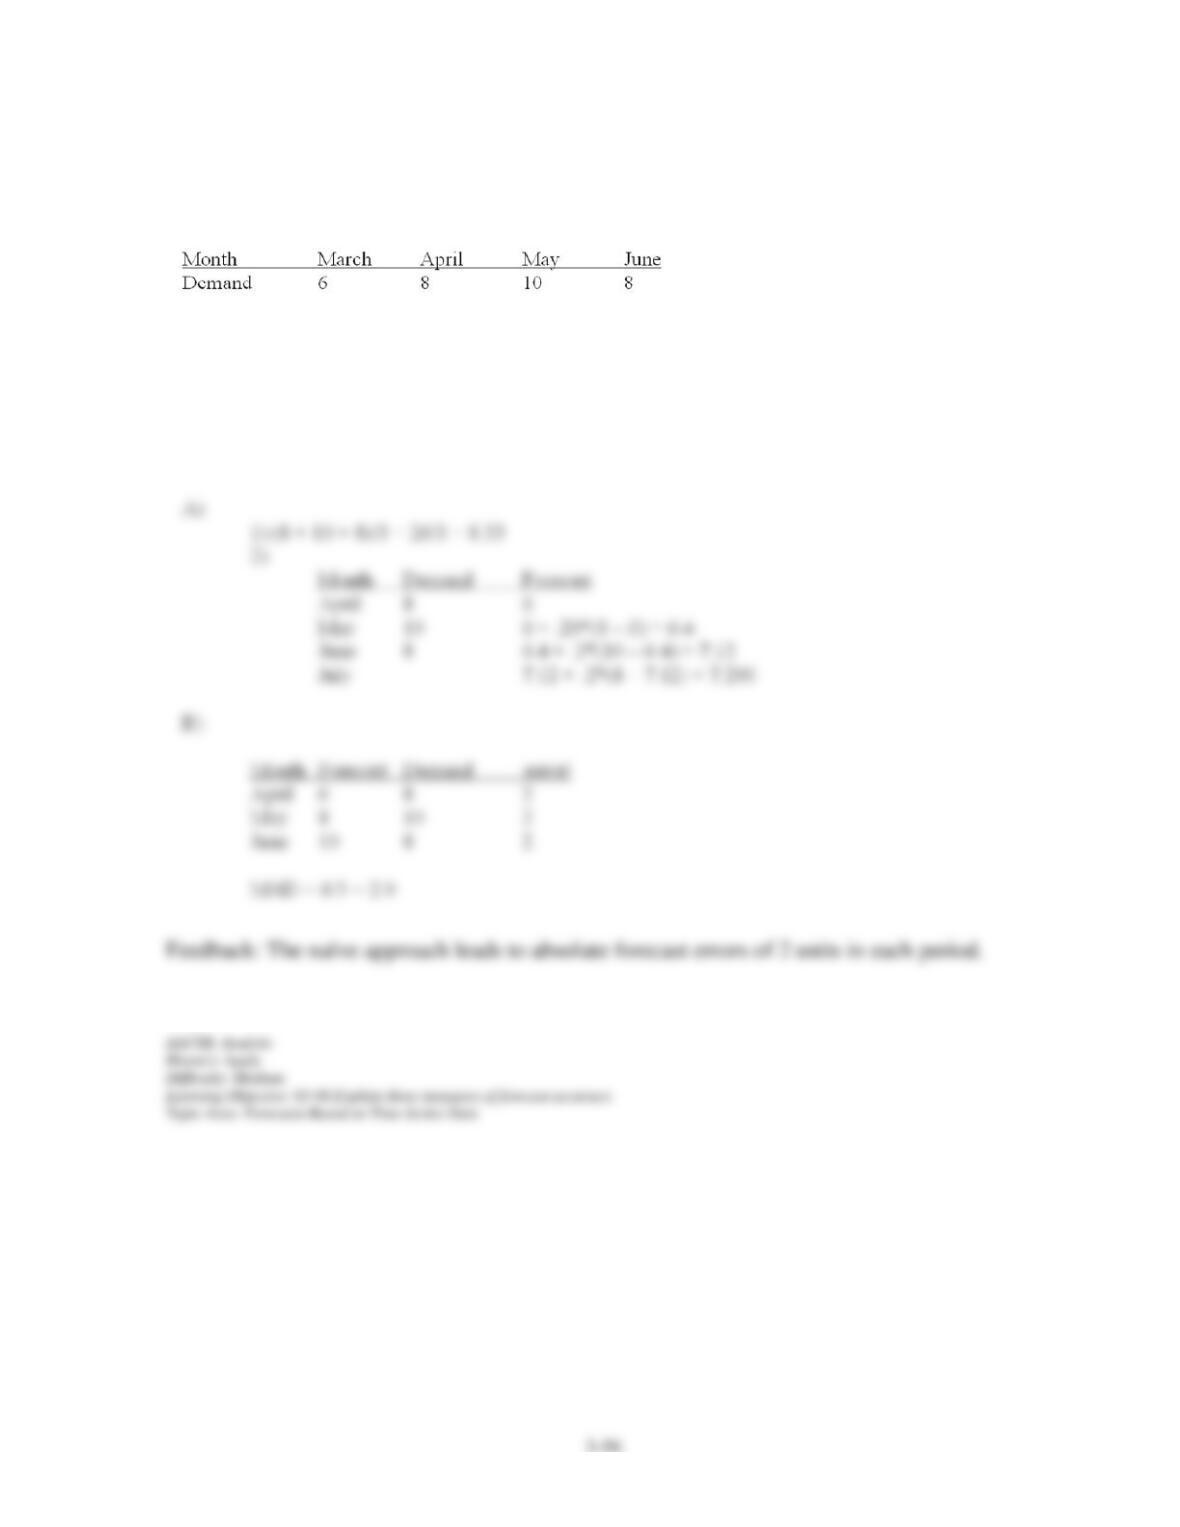
119. Demand for the last four months was:
A) Predict demand for July using each of these methods:
1) a 3-period moving average
2) exponential smoothing with alpha equal to .20 (use a naïve forecast for April for your first
forecast)
B) If the naive approach had been used to predict demand for April through June, what would
MAD have been for those months?
Chapter 03 – Forecasting
3-57
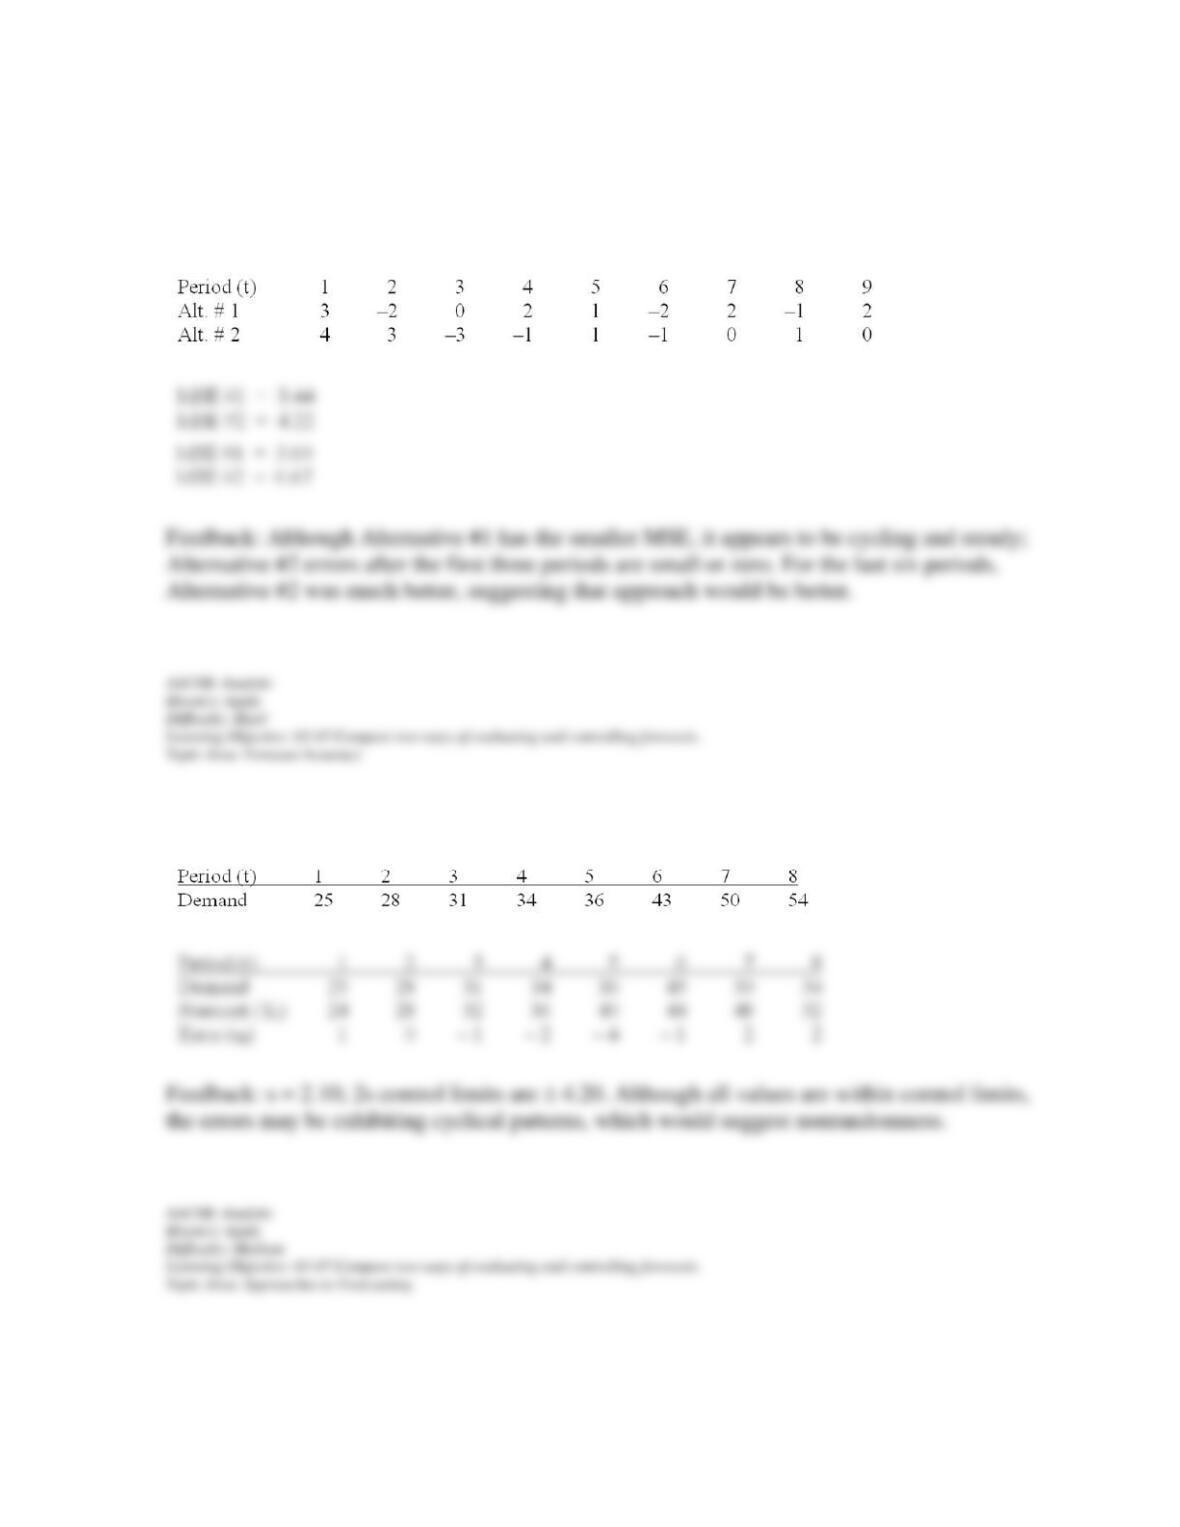
120. A manager wants to choose one of two forecasting alternatives. Each alternative was
tested using historical data. The resulting forecast errors for the two are shown in the table.
Analyze the data and recommend a course of action to the manager.
121. A manager uses this equation to predict demand: Yt = 20 + 4t. Over the past 8 periods,
demand has been as follows. Are the results acceptable? Explain.
Chapter 03 – Forecasting
The president of State University wants to forecast student enrollments for this academic year
based on the following historical data:
122. What is the forecast for this year using a four-year simple moving average?
Chapter 03 – Forecasting
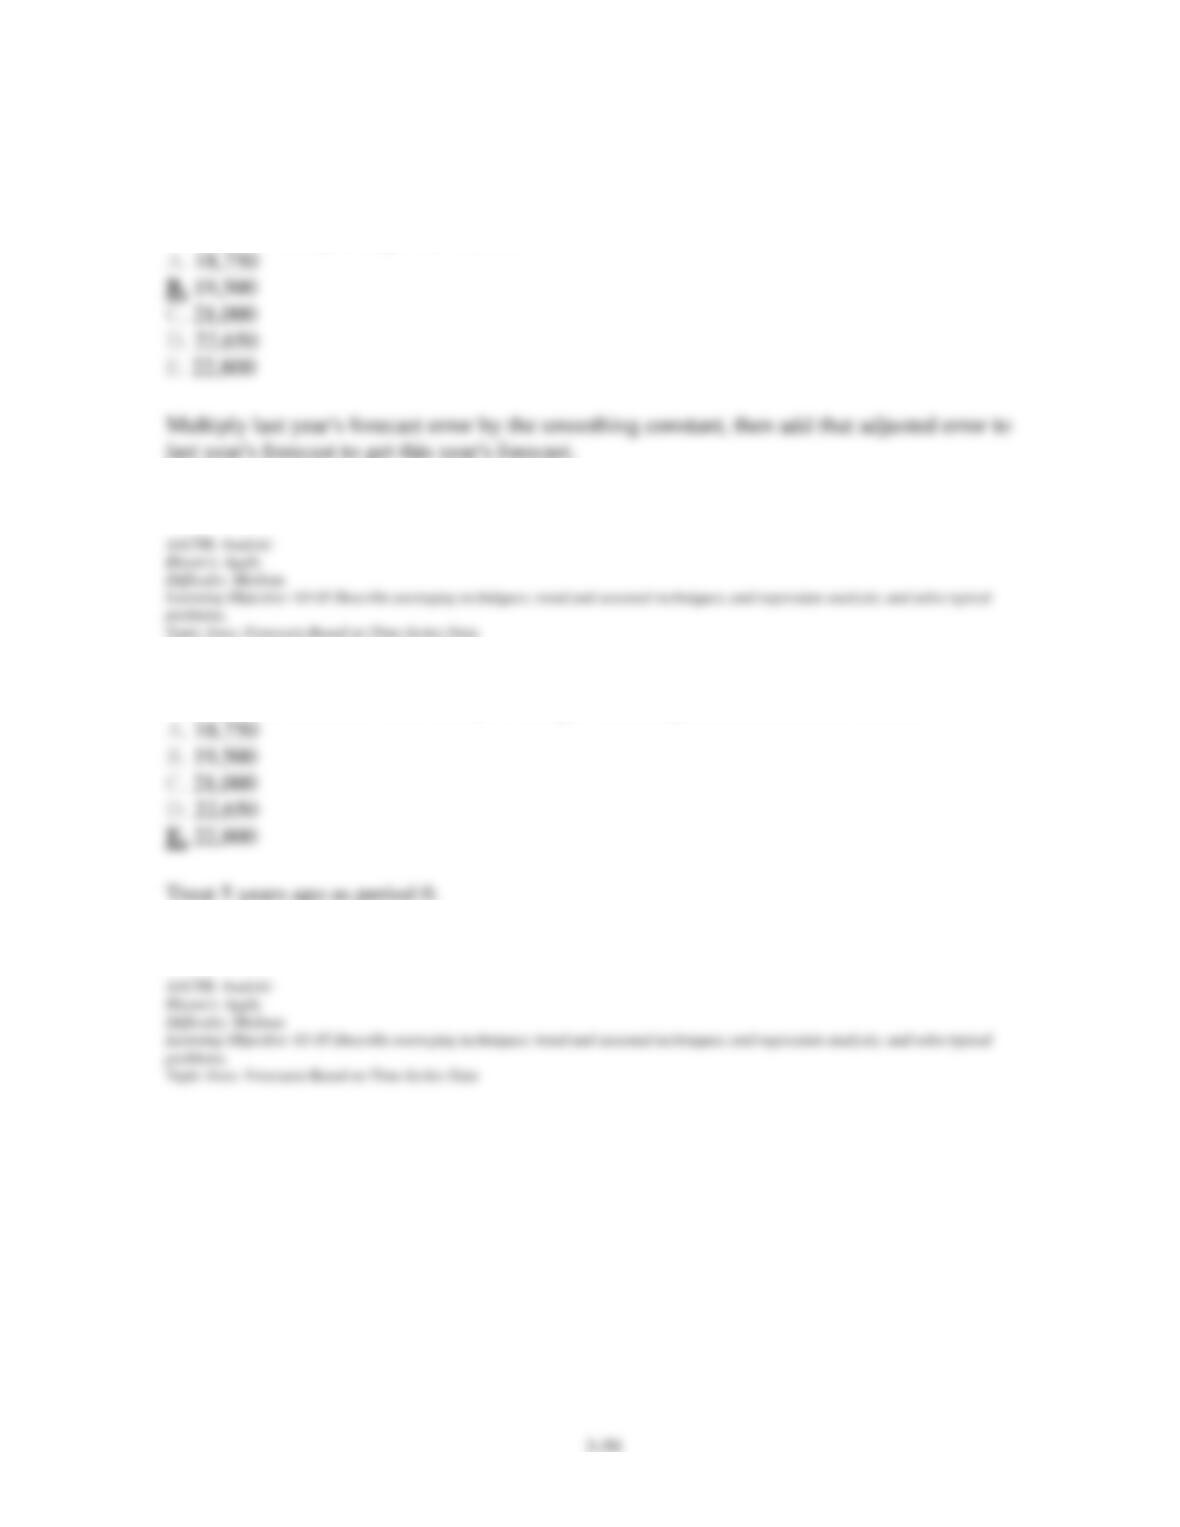
123. What is the forecast for this year using exponential smoothing with alpha = 0.5, if the
forecast for two years ago was 16,000?
124. What is the forecast for this year using the least squares trend line for these data?