13
Exhibit 18-4
USE THE FOLLOWING INFORMATION FOR THE NEXT PROBLEM(S)
The data presented below has been collected at this point in time.
Standard
Fund
Beta
Deviation (%)
Return (%)
Rf (%)
AAA
1.05
4.98
16
6
BBB
1.00
4.04
15
6
CCC
0.92
3.13
11
6
Market
1.00
3.75
13
6
37. Refer to Exhibit 18-4. Compute the Sharpe Measure for the AAA fund.
a.
2.01
b.
2.74
c.
2.91
d.
5.43
e.
1.72
38. Refer to Exhibit 18-4. Compute the Jensen Measure for the BBB fund.
a.
2.10
b.
2.74
c.
5.43
d.
2.00
e.
1.65
39. Refer to Exhibit 18-4. Compute the Treynor Measure for the CCC fund.
a.
5.43
b.
2.74
c.
2.19
d.
2.00
e.
1.65
14
Exhibit 18-5
USE THE FOLLOWING INFORMATION FOR THE NEXT PROBLEM(S)
The data presented below has been collected at this point in time.
Standard
Fund
Beta
Deviation (%)
Return (%)
Rf (%)
XXX
1.07
5.13
19
6
YYY
1.02
4.28
17
6
ZZZ
0.86
3.52
12
6
Market
1.00
3.80
13
6
40. Refer to Exhibit 18-5. Compute the Sharpe Measure for the XXX fund.
a.
6.98
b.
2.35
c.
2.53
d.
3.86
e.
1.72
41. Refer to Exhibit 18-5. Compute the Jensen Measure for the YYY fund.
a.
6.98
b.
2.35
c.
2.53
d.
3.86
e.
1.72
42. Refer to Exhibit 18-5. Compute the Treynor Measure for the ZZZ fund.
a.
6.98
b.
2.35
c.
2.53
d.
3.86
e.
1.72
15
43. What is the Sharpe measure for the S&P 500 over the last ten years if the standard deviation was 8%
and the return was 14%?
a.
1.55
b.
1.69
c.
1.75
d.
1.99
e.
2.09
Exhibit 18-6
USE THE FOLLOWING INFORMATION FOR THE NEXT PROBLEM(S)
Given the following information evaluate the performance of Cloud Incorporated (CI).
RCI = 0.17
BCI = 1.05
Rf = 0.07
Rm = 0.12
44. Refer to Exhibit 18-6. Calculate CI’s overall performance.
a.
0.1225
b.
0.1000
c.
0.0525
d.
0.0475
e.
0.0325
45. Refer to Exhibit 18-6. Calculate CI’s selectivity.
a.
0.1225
b.
0.1000
c.
0.0525
d.
0.0475
e.
0.0325
16
46. Refer to Exhibit 18-6. Calculate CI’s risk.
a.
0.1225
b.
0.1000
c.
0.0525
d.
0.0475
e.
0.0325
Exhibit 18-7
USE THE FOLLOWING INFORMATION FOR THE NEXT PROBLEM(S)
Given the following information evaluate the performance of Tyler Incorporated (TI).
RTI = 0.18
BTI = 1.06
Rf = 0.06
Rm = 0.11
47. Refer to Exhibit 18-7. Calculate TI’s overall performance.
a.
0.0113
b.
0.1200
c.
0.0670
d.
0.0530
e.
0.0696
48. Refer to Exhibit 18-7. Calculate TI’s selectivity.
a.
0.0113
b.
0.1200
c.
0.0687
d.
0.0530
e.
0.0696
17
49. Refer to Exhibit 18-7. Calculate TI’s risk.
a.
0.0113
b.
0.1200
c.
0.0670
d.
0.0530
e.
0.0696
Exhibit 18-8
USE THE FOLLOWING INFORMATION FOR THE NEXT PROBLEM(S)
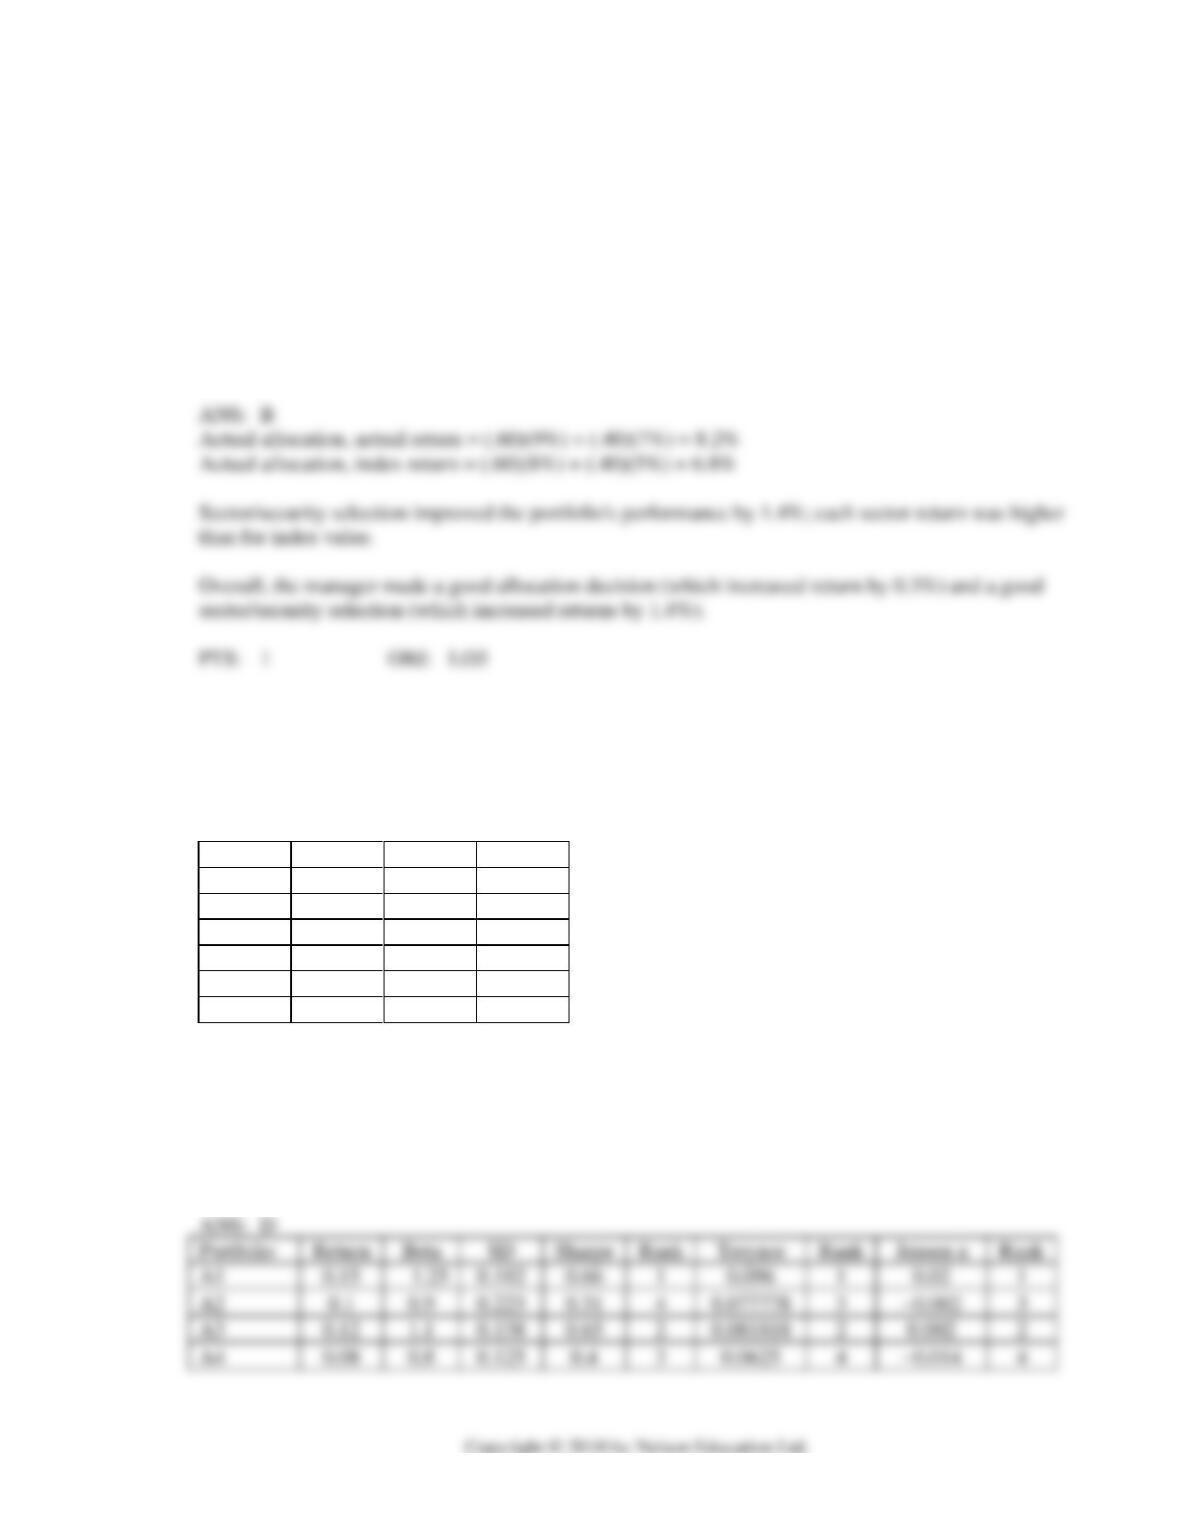
Weights
Policy
Actual
50% stocks
60% stocks
50% bonds
40% bonds
Returns
Index
Actual
8% stocks
9% stocks
5% bonds
7% bonds
50. Refer to Exhibit 18-8. Which of the following statements is true?
a.
The portfolio manager earned an extra 0.3% because of a shift in allocation out of bonds
and into stocks.
b.
The portfolio manager earned an extra 0.3% because of a shift in allocation out of stocks
and into bonds.
c.
The portfolio manager earned an extra 6.5% because of a shift in allocation out of bonds
and into stocks.
d.
The portfolio manager earned an extra 6.5% because of a shift in allocation out of stocks
and into bonds.
e.
None of the above.
18
51. Refer to Exhibit 18-8. Which of the following statements is true?
a.
Sector/security selection hurt the portfolio performance; returns were 1.4% less than if the
manager invested the funds in stocks and bond indexes.
b.
Sector/security selection improved the portfolio performance by 1.4%; each sector return
was higher than for index value.
c.
Sector/security selection hurt the portfolio performance; returns were 6.8% less than if the
manager invested the funds in stocks and bond indexes.
d.
Sector/security selection improved the portfolio performance by 6.8%; each sector return
was higher than for index return.
e.
None of the above.
Exhibit 18-9
THE FOLLOWING INFORMATION IS FOR THE NEXT PROBLEM(S)
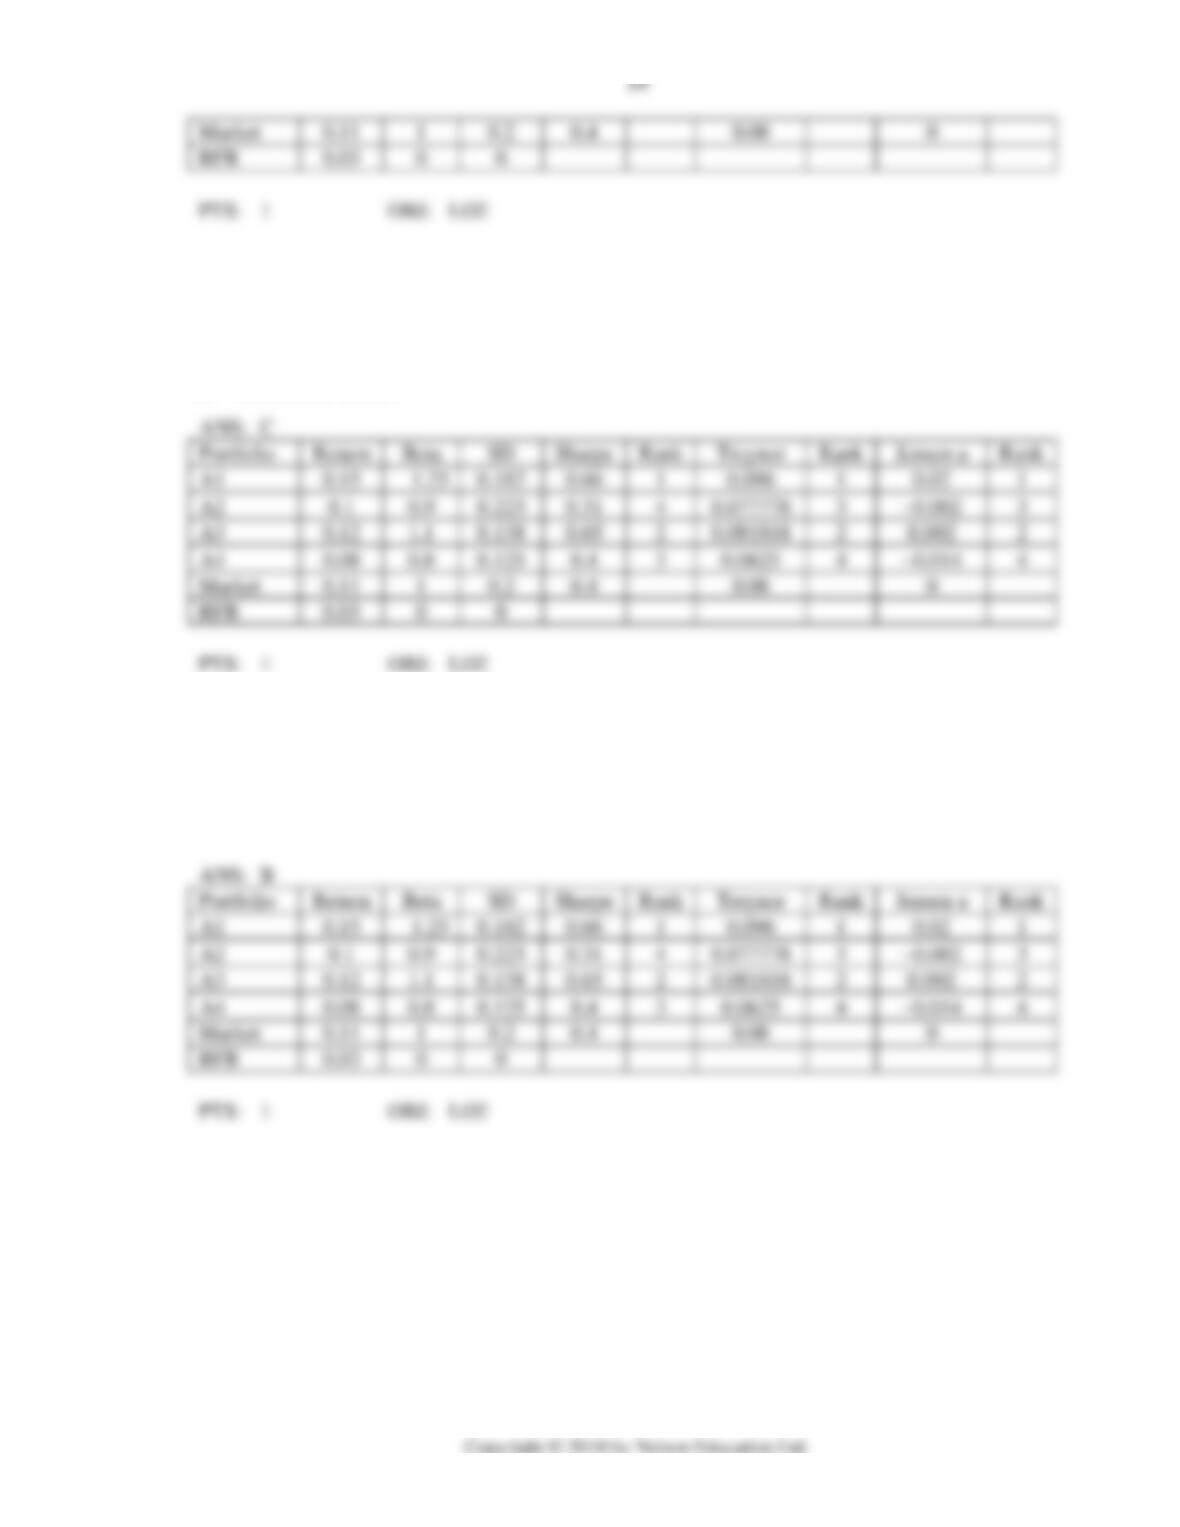
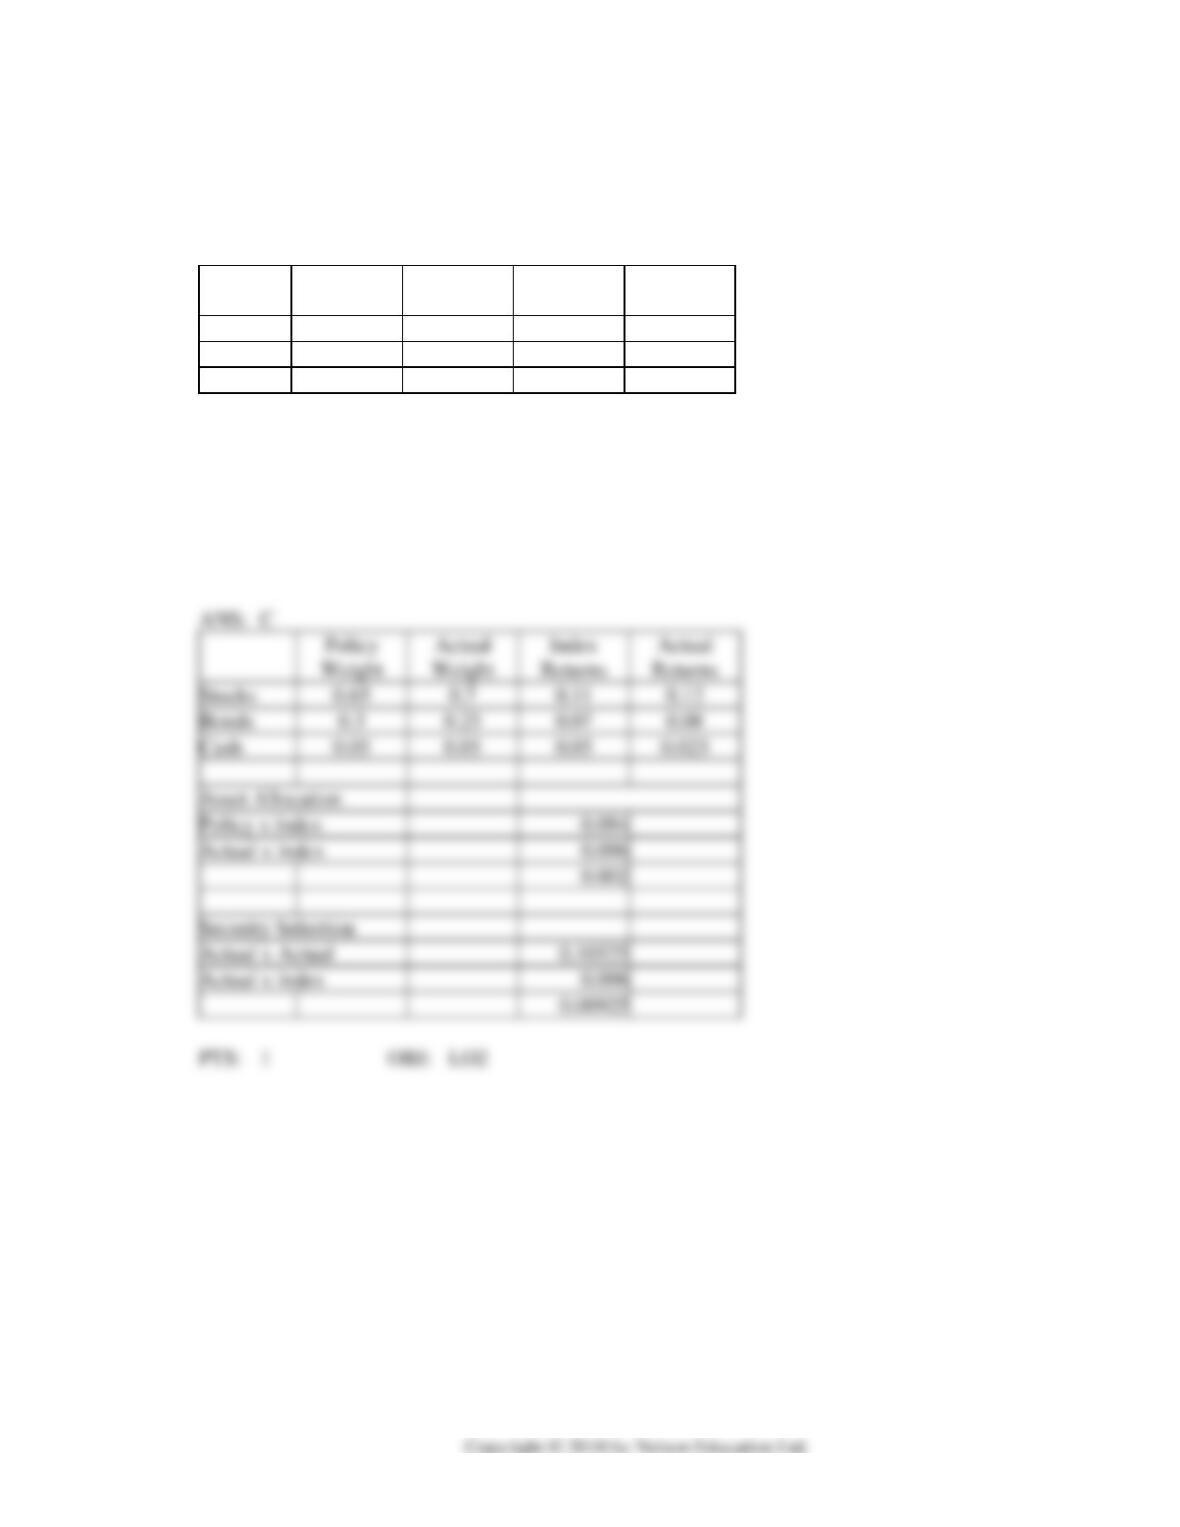
Consider the following information for four portfolios, the market and the risk free rate (RFR)
Portfolio
Return
Beta
SD
A1
0.15
1.25
0.182
A2
0.1
0.9
0.223
A3
0.12
1.1
0.138
A4
0.08
0.8
0.125
Market
0.11
1
0.2
RFR
0.03
0
0
52. Refer to Exhibit 18-9. Calculate the Sharpe Measure for each portfolio.
a.
A1 = 0.40, A2 = 0.31, A3 = 0.65, A4 = 0.66
b.
A1 = 0.31, A2 = 0.66, A3 = 0.65, A4 = 0.40
c.
A1 = 0.66, A2 = 0.65, A3 = 0.31, A4 = 0.40
d.
A1 = 0.66, A2 = 0.31, A3 = 0.65, A4 = 0.40
e.
None of the above.
Treynor
0.182
0.096
0.138
0.002
0.125
0.0625
53. Refer to Exhibit 18-9. Calculate the Jensen alpha Measure for each portfolio.
a.
A1 = 0.014, A2 = −0.002, A3 = 0.002, A4 = −0.02
b.
A1 = 0.002, A2 = −0.02, A3 = 0.002, A4 = −0.014
c.
A1 = 0.02, A2 = −0.002, A3 = 0.002, A4 = −0.014
d.
A1 = 0.02, A2 = −0.002, A3 = 0.02, A4 = −0.14
e.
None of the above.
54. Refer to Exhibit 18-9. Calculate the Treynor Measure for each portfolio.
a.
A1 = 0.0625, A2 = 0.0778, A3 = 0.0818, A4 = 0.096
b.
A1 = 0.096, A2 = 0.0778, A3 = 0.0818, A4 = 0.0625
c.
A1 = 0.096, A2 = 0.0818, A3 = 0.0778, A4 = 0.0625
d.
A1 = 0.0778, A2 = 0.096, A3 = 0.0818, A4 = 0.0625
e.
None of the above.
20
Exhibit 18-10
THE FOLLOWING INFORMATION IS FOR THE NEXT PROBLEM(S)
Consider the following information for a portfolio manager
Policy
Actual
Index
Actual
Weight
Weight
Returns
Returns
Stocks
0.65
0.7
0.11
0.12
Bonds
0.3
0.25
0.07
0.08
Cash
0.05
0.05
0.03
0.025
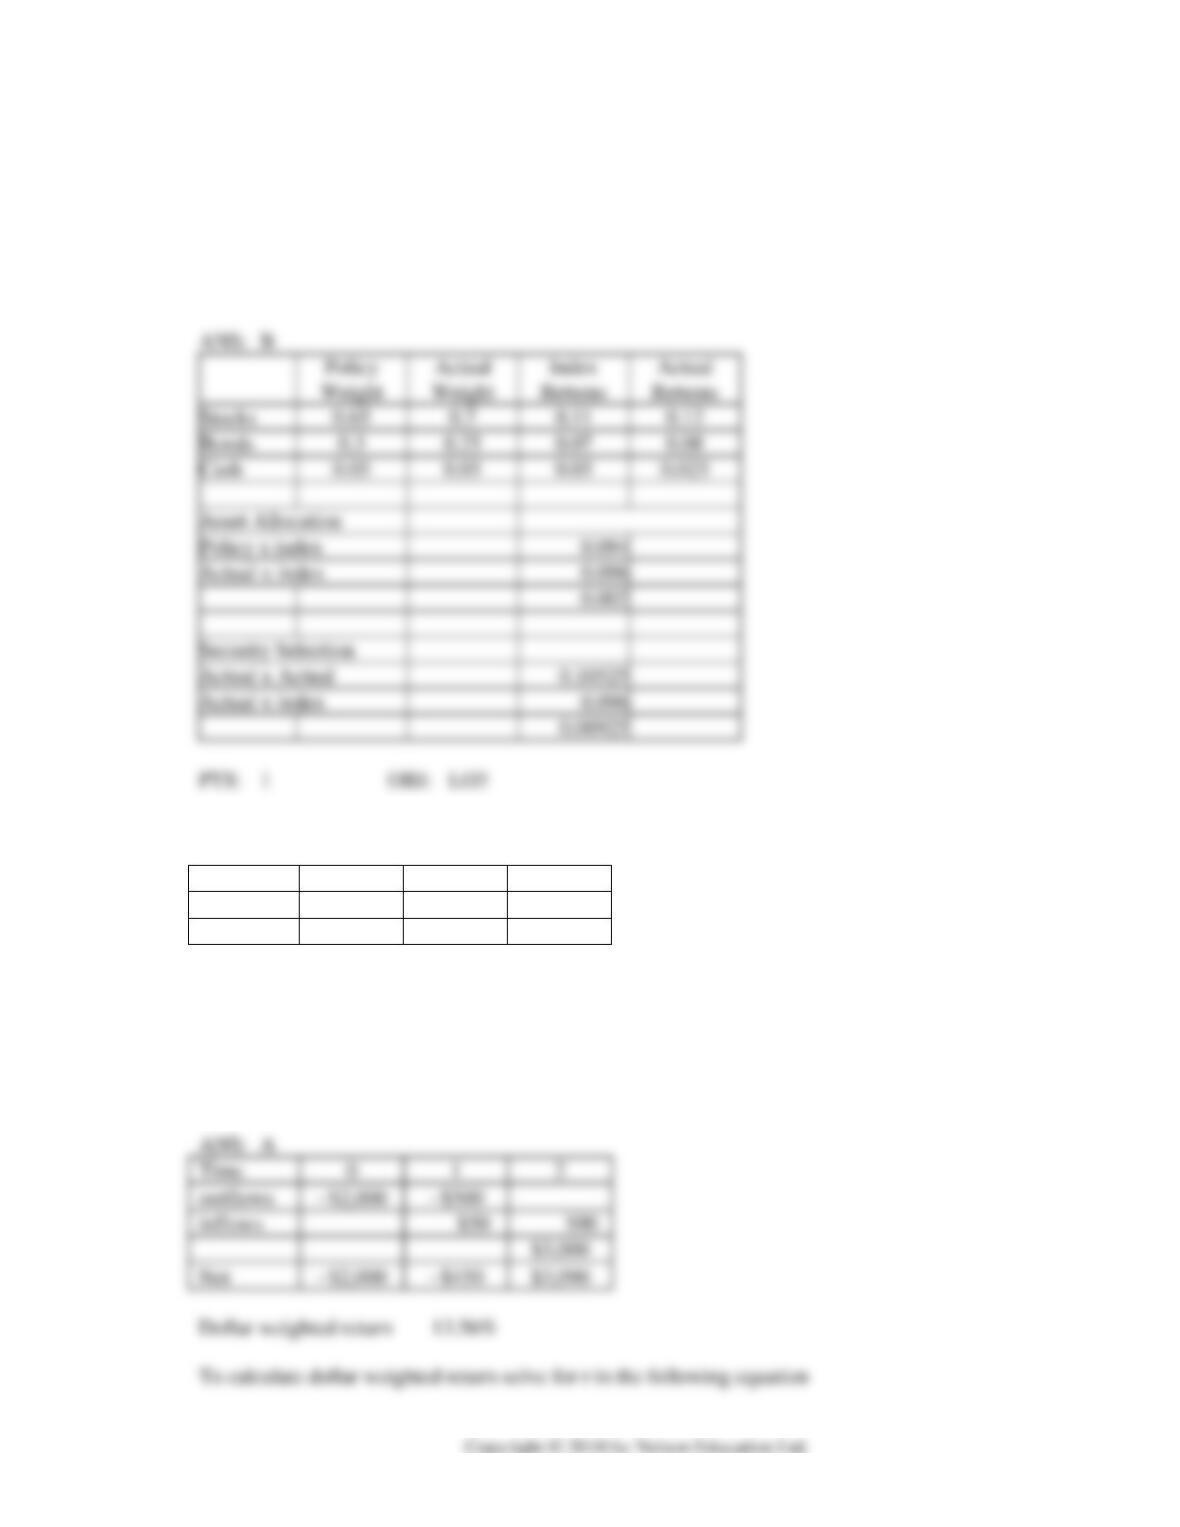
55. Refer to Exhibit 18-10. Calculate the percentage return that can be attributed to the asset allocation
decision.
a.
0.105%
b.
0.925%
c.
0.20%
d.
0.96%
e.
0.94%
Policy
Actual
Index
Actual
Weight
Weight
Returns
Returns
Stocks
0.65
0.7
0.11
0.12
Bonds
0.3
0.25
0.07
0.08
Cash
0.05
0.05
0.03
0.025
Policy x index
Actual x index
Security Selection
Actual x Actual
Actual x index
21
56. Refer to Exhibit 18-10. Calculate the percentage return that can be attributed to the security selection
decision.
a.
0.105%
b.
0.925%
c.
0.20%
d.
0.96%
e.
0.94%
Weight
Weight
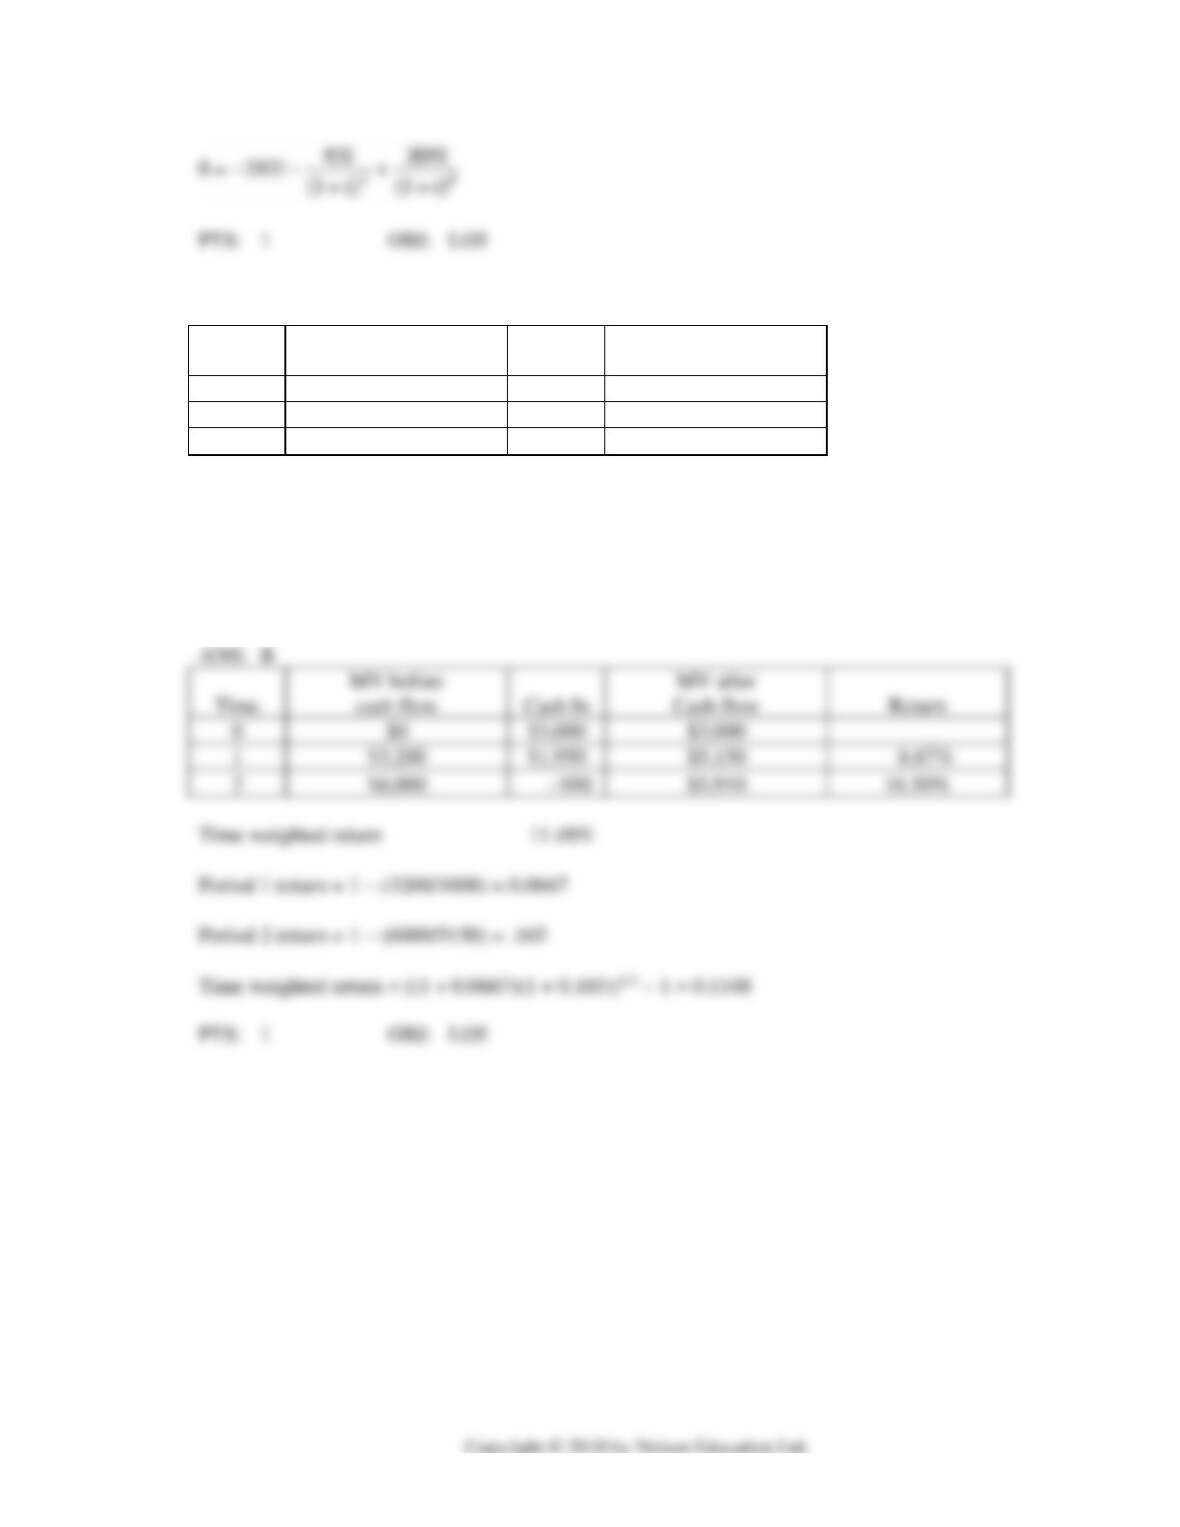
57. A portfolio manager has the following sequence of cash flows over a two year period.
Time
0
1
2
outflows
−$2,000
−$500
inflows
$50
$3,090
Calculate the portfolio manager’s dollar weighted return.
a.
13.56%
b.
11.48%
c.
15.50%
d.
8.75%
e.
10.67%
Time
0
1
2
outflows
−$2,000
−$500
inflows
$3,000
Net
−$2,000
−$450
$3,090
Dollar weighted return
22
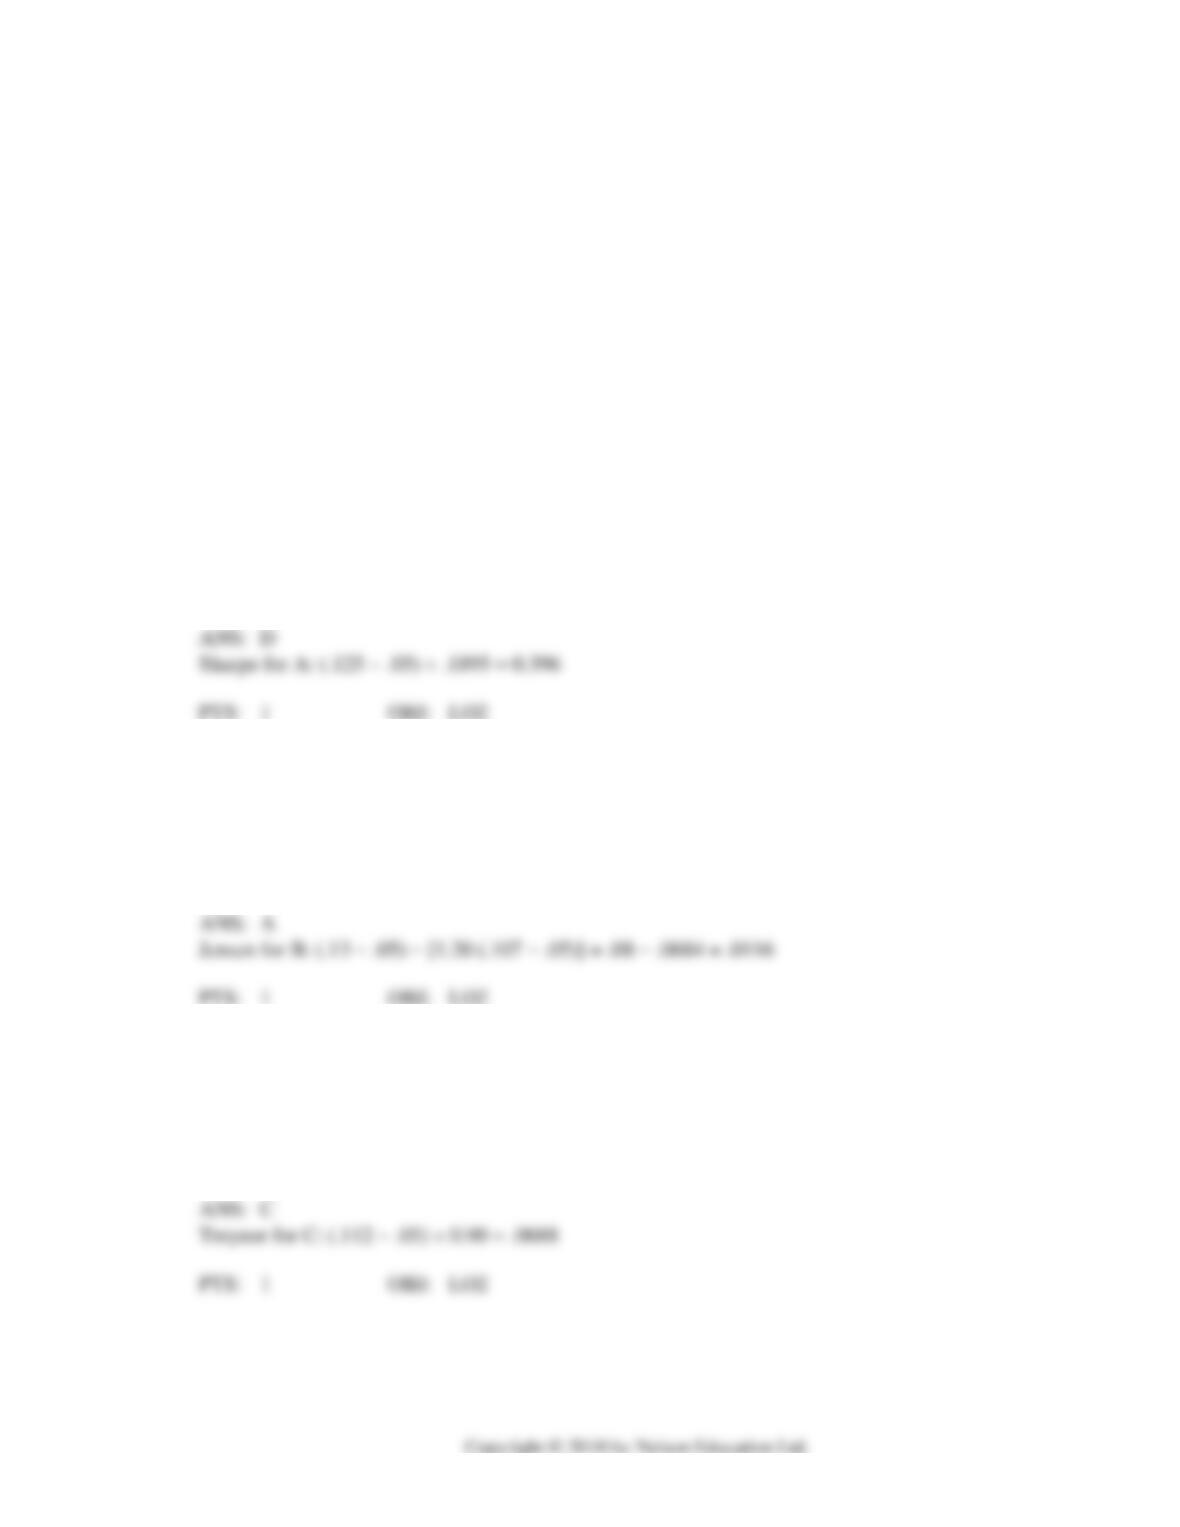
58. A portfolio manager has the following sequence of cash flows over a two year period.
Market Value before
Market Value after
Time
cash flow
Cash In
cash flow
0
$0
$3,000
$3,000
1
$3,200
$1,950
$5,150
2
$6,000
−$90
$5,910
Calculate the portfolio manager’s time weighted return.
a.
13.56%
b.
11.48%
c.
15.50%
d.
8.75%
e.
10.67%
Time
cash flow
Cash In
0
$0
$3,000
$3,000
1
$3,200
$1,950
$5,150
2
$6,000
−$90
$5,910
23
Exhibit 18-11
USE THE FOLLOWING INFORMATION FOR THE NEXT PROBLEM(S)
The last year’s performance for four mutual funds is presented below. The market return was 10.70%,
last year with a standard deviation of 13.1% and the risk-free rate of return was 5%.
Standard
Fund
Beta
Deviation (%)
Return (%)
A
1.50
18.95
12.5
B
1.20
12.41
13.0
C
0.90
9.30
11.2
D
0.50
8.10
9.5
59. Refer to Exhibit 18-11. Compute the Sharpe Measure for the A fund.
a.
0.012
b.
0.040
c.
0.069
d.
0.396
e.
1.142
60. Refer to Exhibit 18-11. Compute the Jensen Measure for the B fund.
a.
1.16%
b.
2.31%
c.
6.90%
d.
9.60%
e.
10.13%
61. Refer to Exhibit 18-11. Compute the Treynor Measure for the C fund.
a.
0.012
b.
0.040
c.
0.069
d.
0.396
e.
1.142
24
62. Refer to Exhibit 18-11. Based on the Sharpe Measure, which portfolio preformed best?
a.
A
b.
B
c.
C
d.
D
e.
Market
63. Refer to Exhibit 18-11. Based on the Treynor Measure, which portfolio preformed best?
a.
A
b.
B
c.
C
d.
D
e.
Market