Chapter 17 – Project Management
55. In a project network the critical path is the sequence of activities which has the:
56. Which of the following is not true about the use of dummy activities in project
networking?
Chapter 17 – Project Management
57. Shortening activity durations is called:
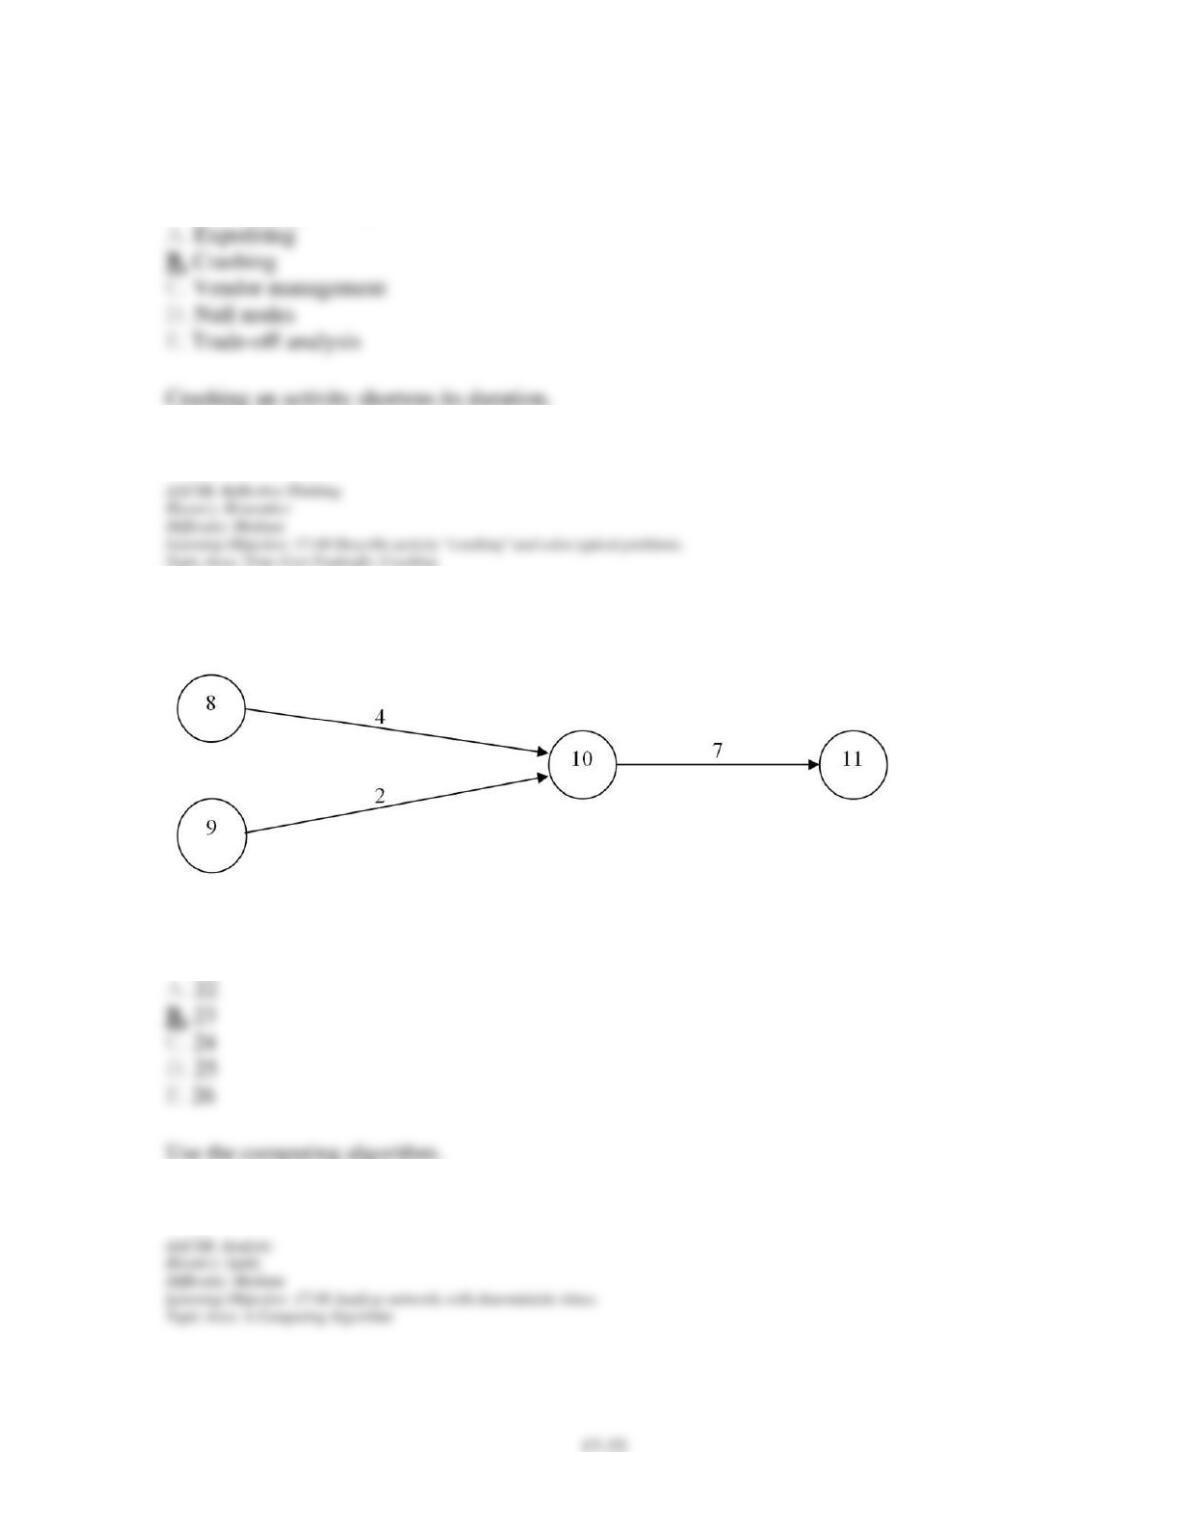
58. Consider the portion of a project depicted by this graph:
What is the earliest finish time for activity 10-11 (far right hand side), if the earliest start time
of 8-10 (upper left hand side) is 12, and the earliest start time of 9-10 (lower left hand side) is
13?
Chapter 17 – Project Management
59. Activity 7-8 is directly preceded by two activities—activity 5-7 and activity 6-7. Activity
5-7 has an expected time of five and an ES time of six. Activity 6-7 has an expected time of
seven and an ES time of seven. Activity 7-8 has an expected time of 10. The ES for activity 7-
8 is:
60. Which of the following is determined as a direct result of computing the earliest starting
and finishing times for the activities of a project network?
Chapter 17 – Project Management
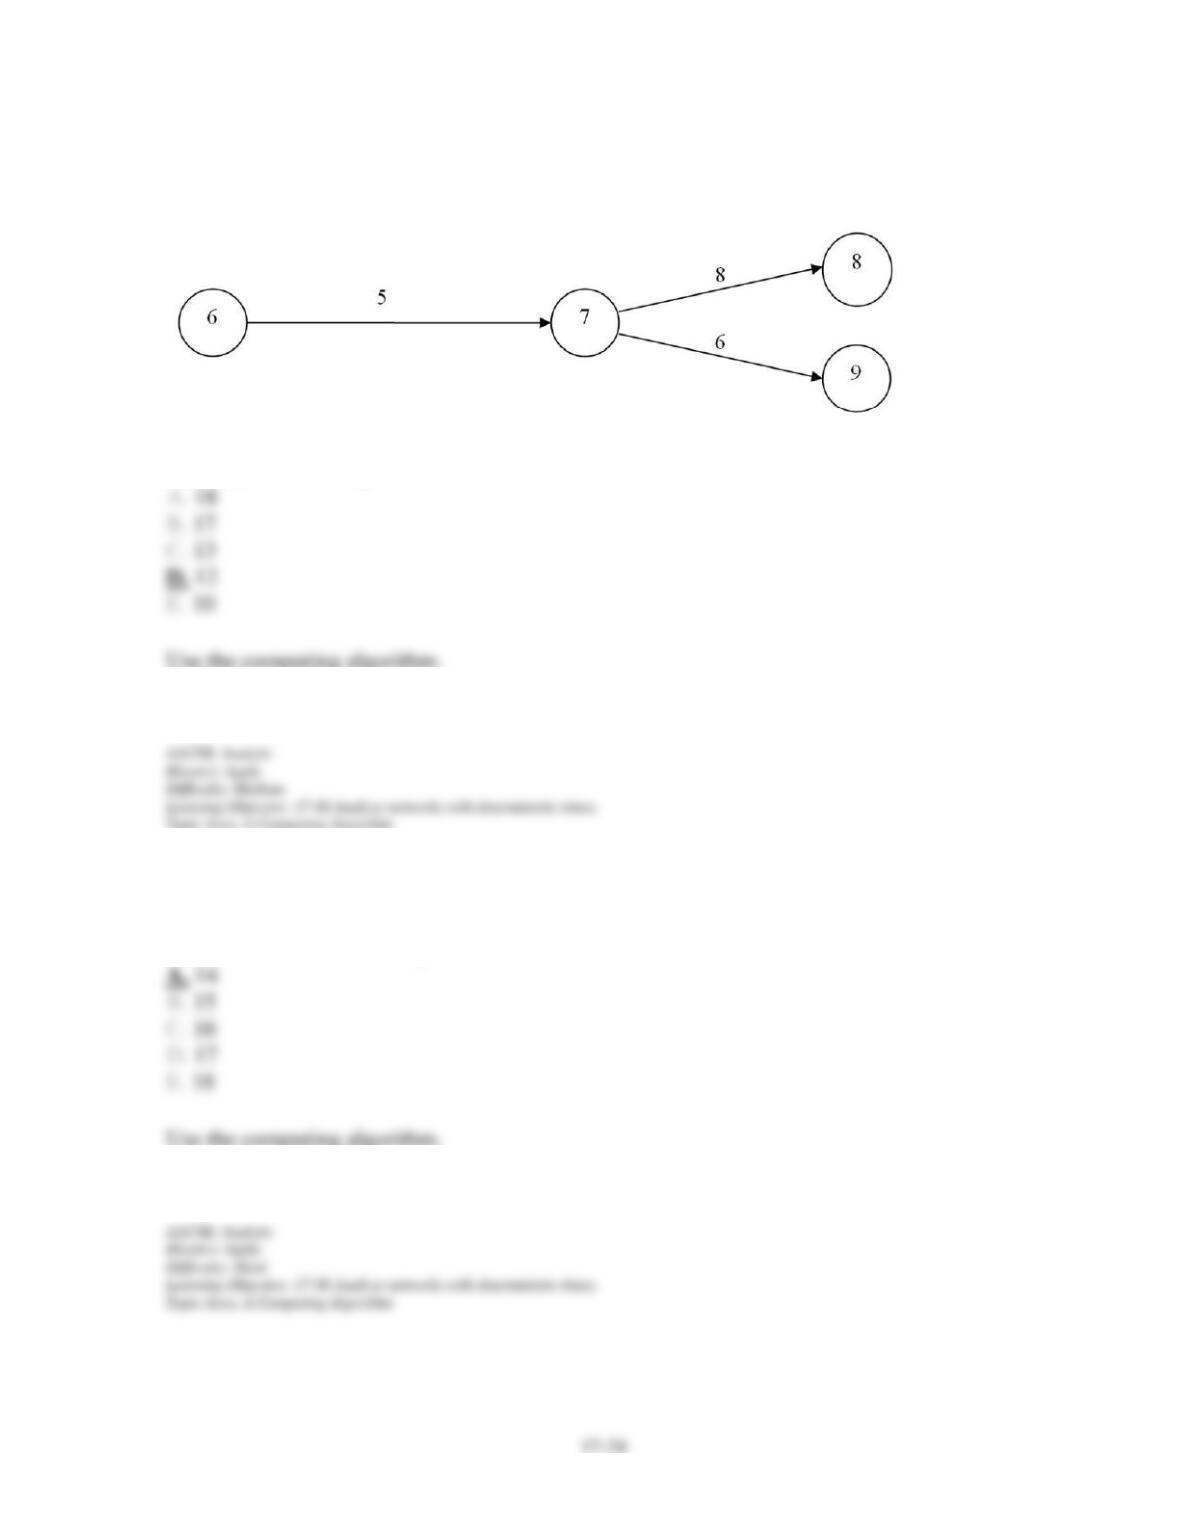
61. Consider the portion of a project depicted by this graph:
What is the latest start time of activity 6-7 if the latest finish of activity 7-8 is 26, and the
latest finish of activity 7-9 is 23?
62. A node has one entering activity, a, and two leaving activities, b and c. Given the
following information, determine the latest starting time for activity a: EFb = 15, EFc = 17,
LFb = 24, LFc = 27; activity times are a = 4, b = 6, c = 8.
Chapter 17 – Project Management
63. In project network analysis, “slack” refers to the difference between:
64. Activity C has an early start time of 8, an early finish time of 12, a latest start time of 13,
and a latest finish time of 17. Its slack is:
Chapter 17 – Project Management
65. Given this information about activity 3-4: ES = 10, EF = 15, LS = 16, and LF = 21, we
can determine that the amount of slack associated with the activity is:
66. In the probabilistic approach to project network analysis, the time estimate annotated “tm”
for any activity is the:
Chapter 17 – Project Management
67. The basis for use of the beta distribution in PERT is:
68. When developing probabilistic estimates of project duration, it is necessary to know which
of the following?
Chapter 17 – Project Management
69. A PERT/CPM activity has an optimistic time estimate of three days, a most likely time
estimate of eight days, and a pessimistic time estimate of 10 days. The expected time (in days)
of this activity is:
70. Activity 4-5 in a network diagram has an optimistic time estimate of five days, a most
likely time estimate of seven days, and a pessimistic time estimate of 10 days. Its expected
time is approximately:
Chapter 17 – Project Management
71. There are four activities on the critical path, and they have standard deviations of 1, 2, 4,
and 2 days. The standard deviation of the critical path is:
72. There are four activities on the critical path. Coincidentally, their standard deviations are
all equal to 4. The standard deviation of the critical path is therefore equal to:
Chapter 17 – Project Management
73. The project management strategy of injecting additional resources in order to reduce the
length of the project is called:
74. In “crashing” a project, a manager will generally focus on activities which:
Chapter 17 – Project Management
75. At which point does crashing of a project cease?
76. Which of the following are advantages of PERT?
(I) It is visual.
(II) It is automatically updated.
(III) Activities that need to be watched closely can be identified.
Chapter 17 – Project Management
77. Which of the following are limitations of PERT?
(I) Time estimates may include a fudge factor.
(II) Important activities may be overlooked.
(III) It is an after-the-fact analysis.
78. Which of the following is not a limitation of PERT and similar project-scheduling
techniques?
Chapter 17 – Project Management
79. Gantt charts are most closely associated with
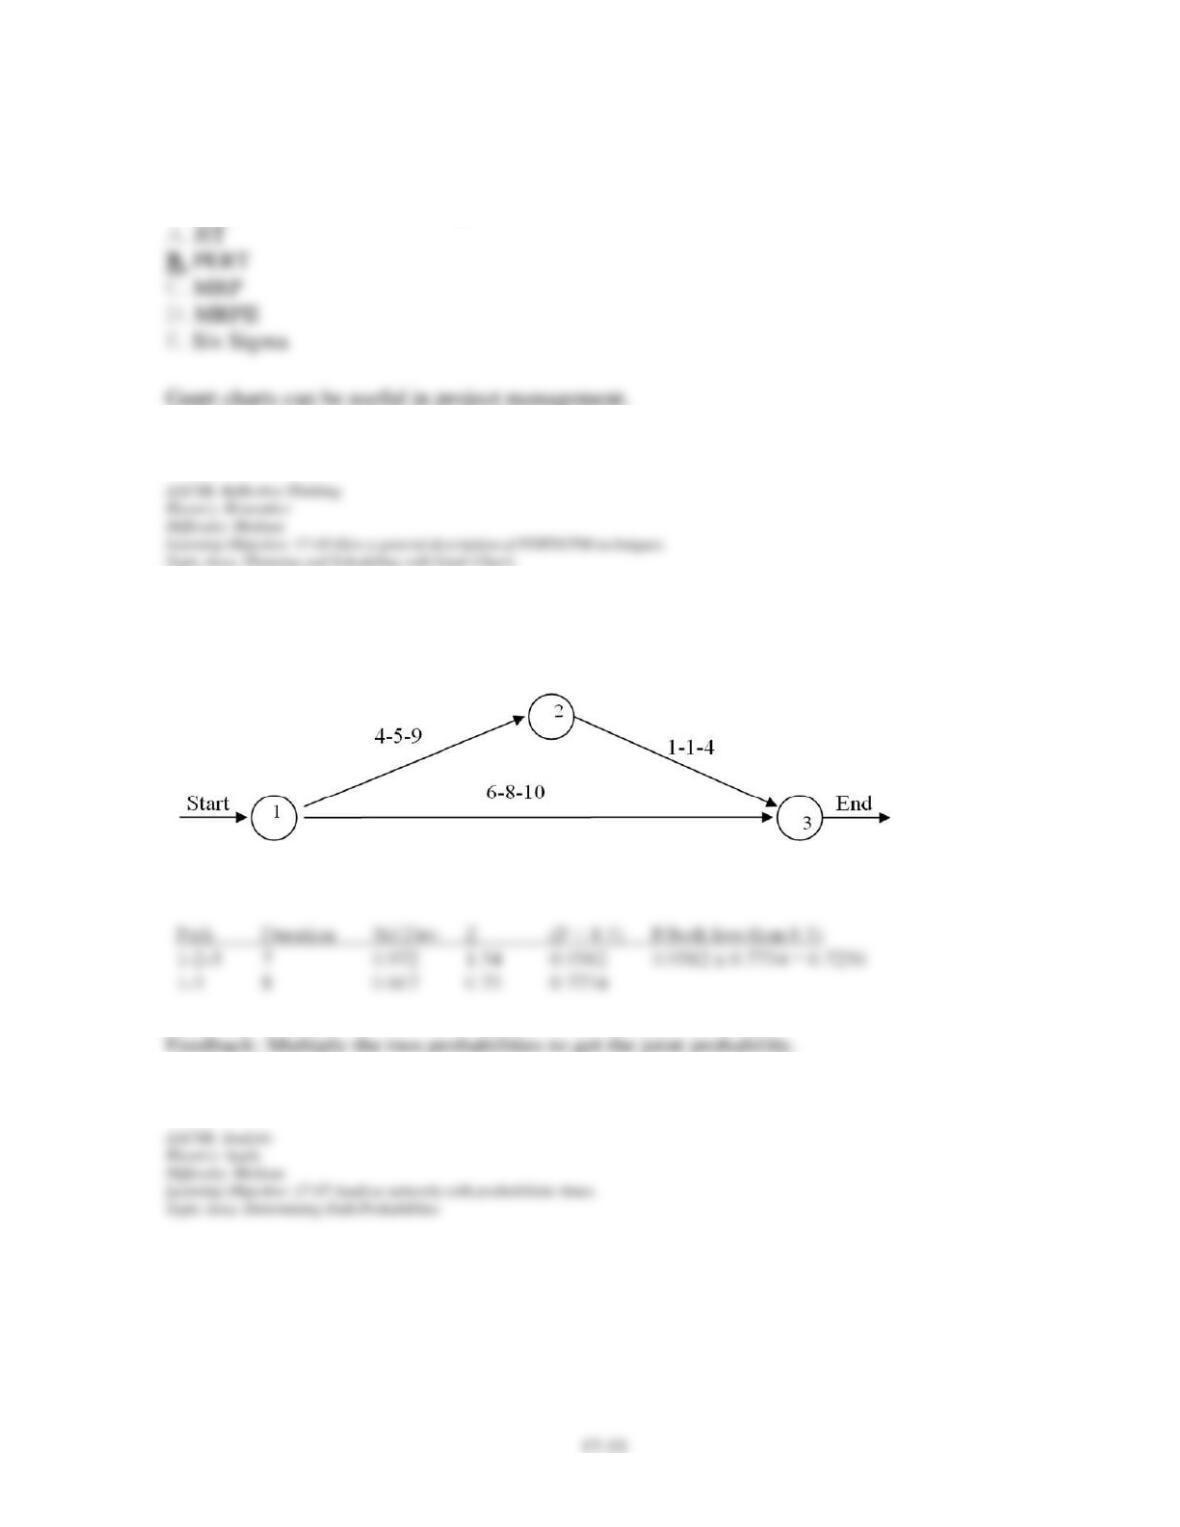
80. Consider the project depicted by the following A-O-A diagram:
What is the probability that this project’s duration will exceed 8.5 weeks?

Chapter 17 – Project Management
81. Using the information given in the following table:
(A) Identify the critical path.
(B) Determine expected project duration.
Chapter 17 – Project Management
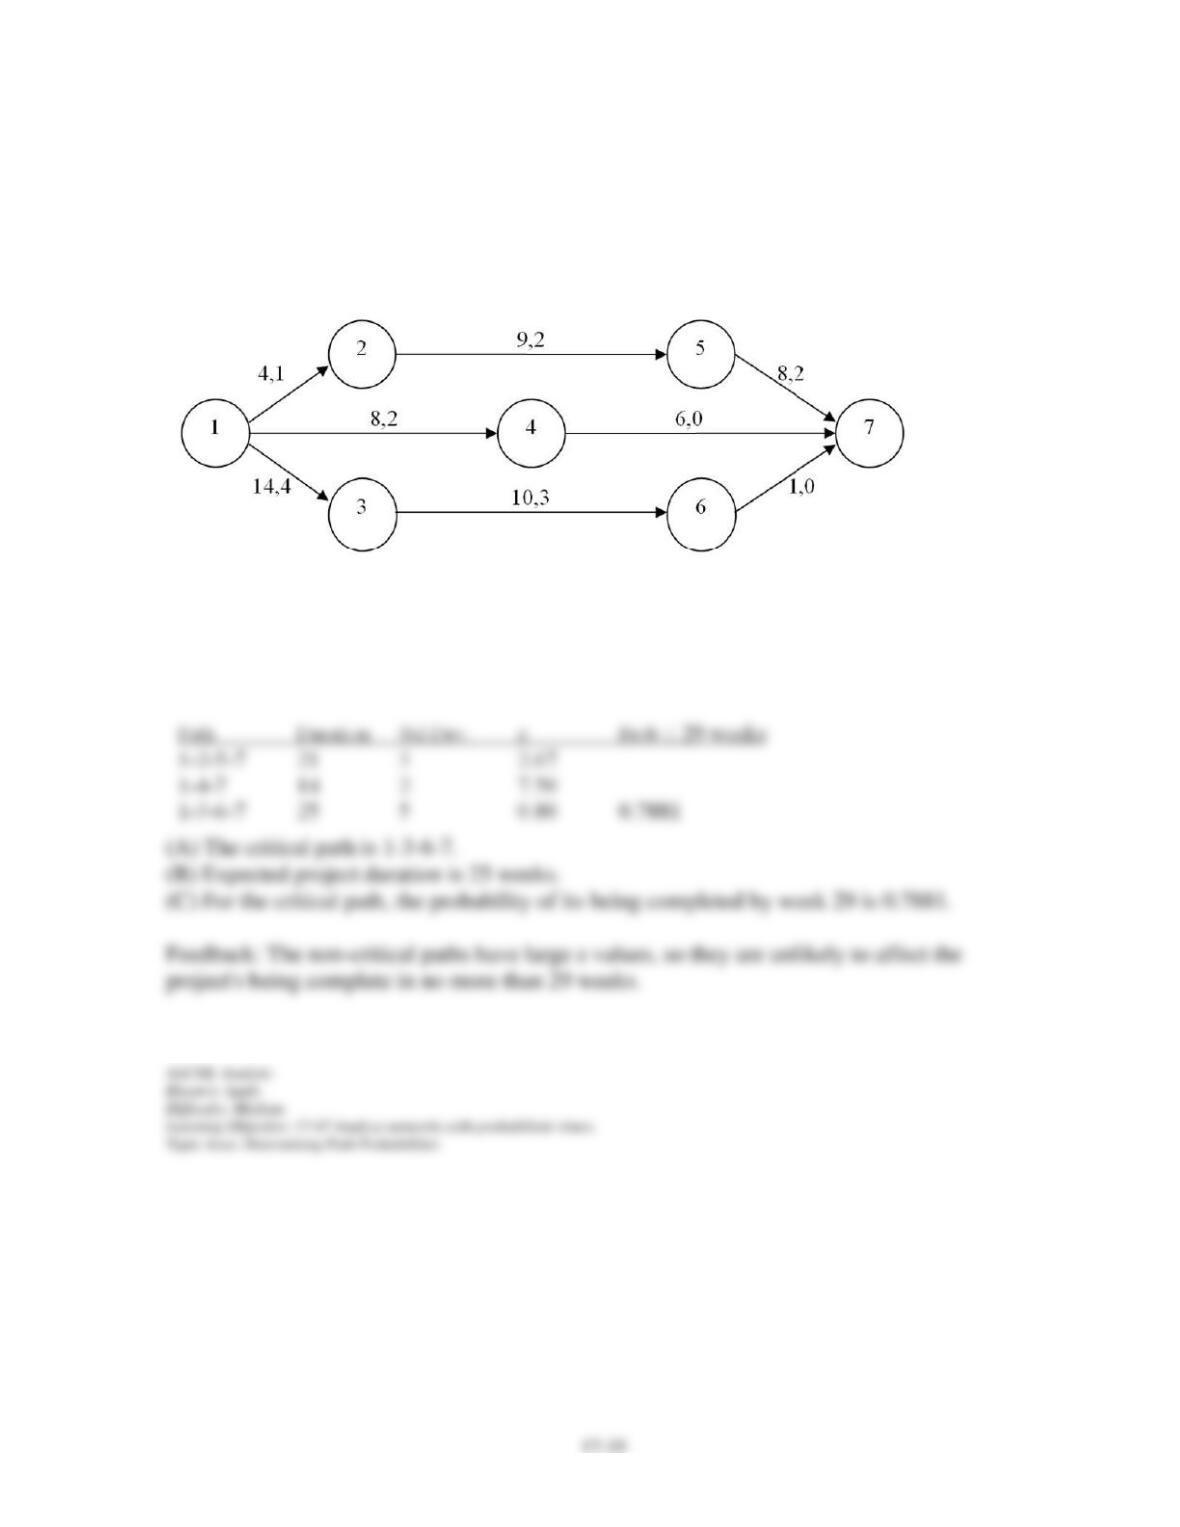
82. In the project network presented below, numbers on each arrow refer to the expected time
and standard deviation in weeks for that particular activity. For example, “8,2” indicates an
activity with an expected time of 8 and a standard deviation of two weeks.
For this project, determine each of the following:
(A) the activities which are on the critical path
(B) the expected project duration
(C) the probability that the project will be completed in 29 weeks or less
Chapter 17 – Project Management
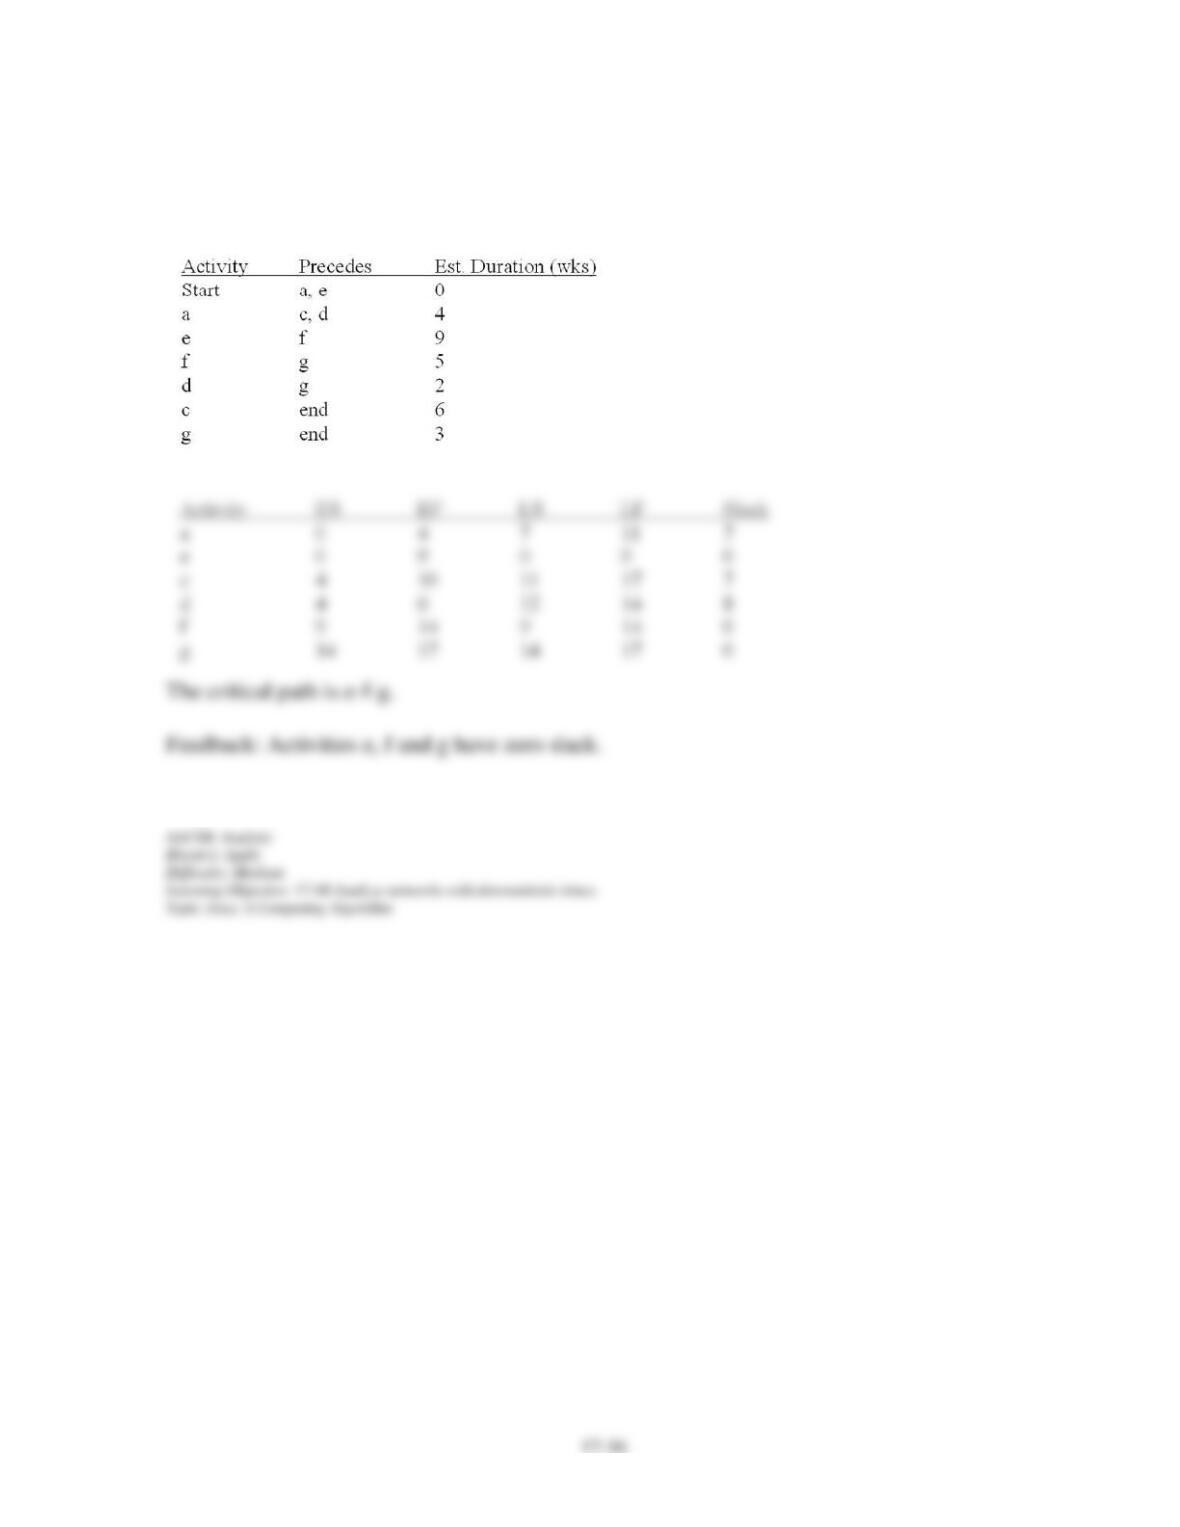
83. Determine the amount of slack in each of a project’s activities (presented below), and
identify those that are on the critical path.
Chapter 17 – Project Management
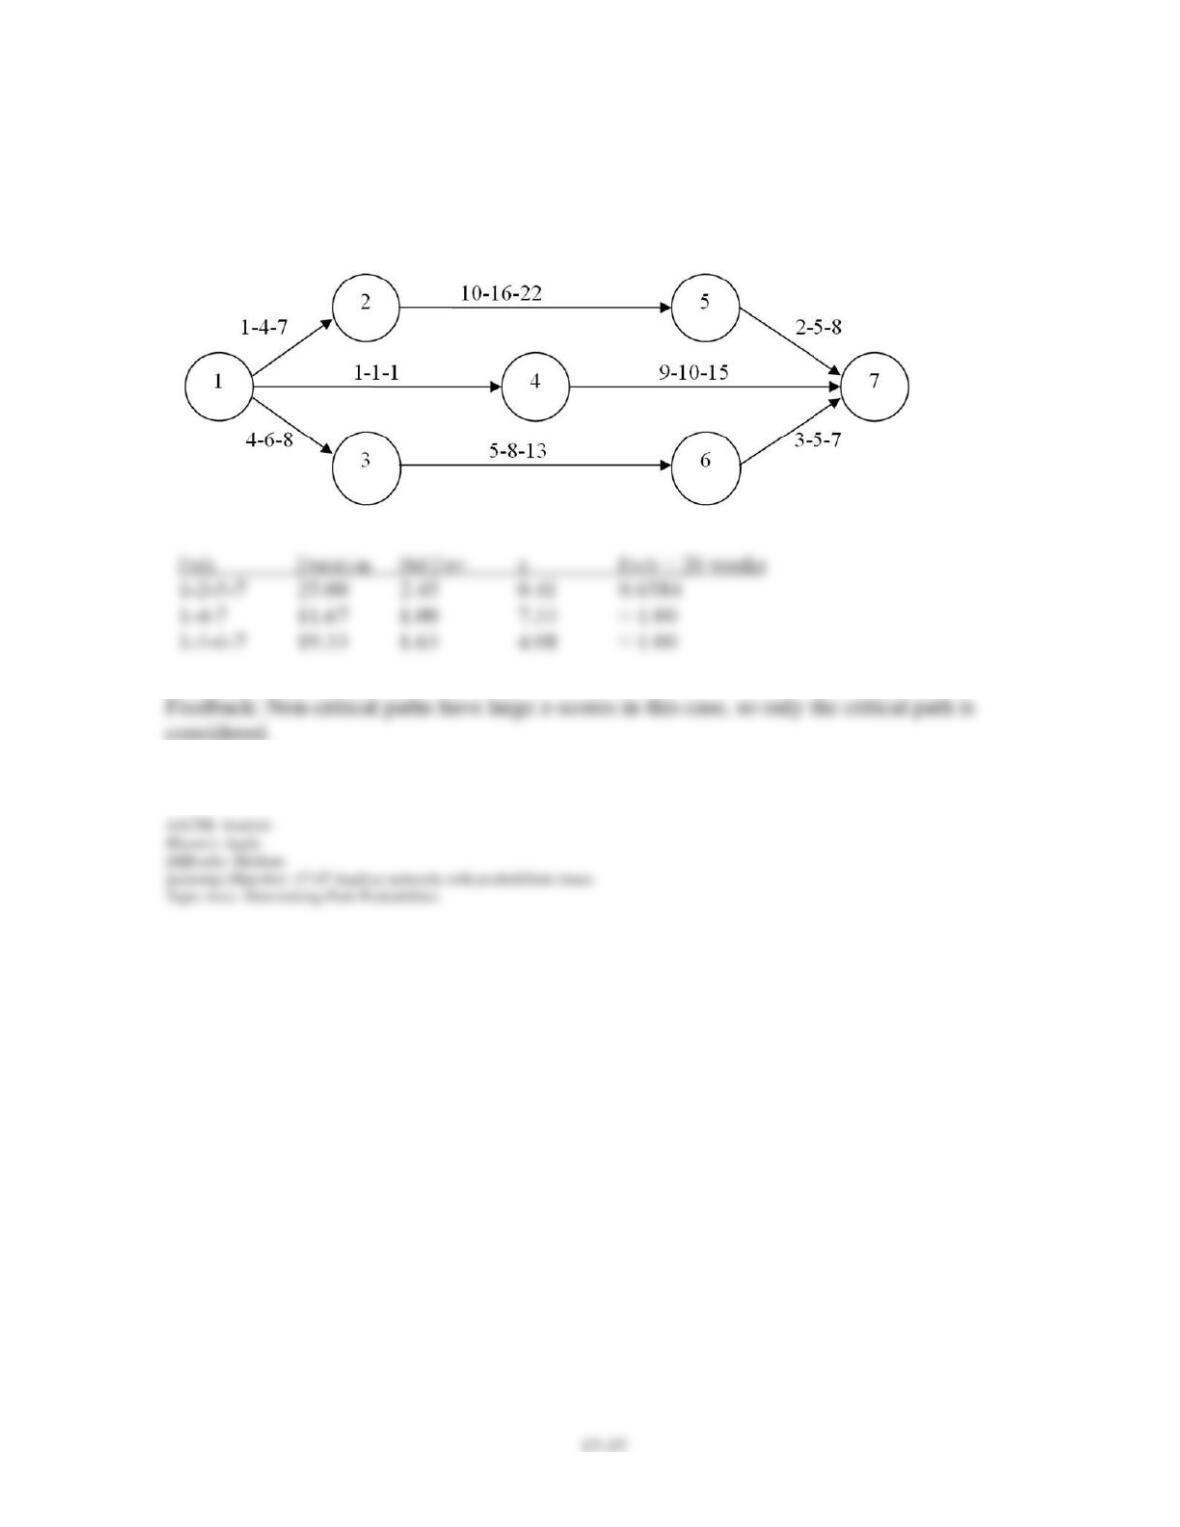
84. Given the network diagram below, determine the probability that the project will finish
within 26 weeks of its start. Times on the diagram are in weeks.
Chapter 17 – Project Management
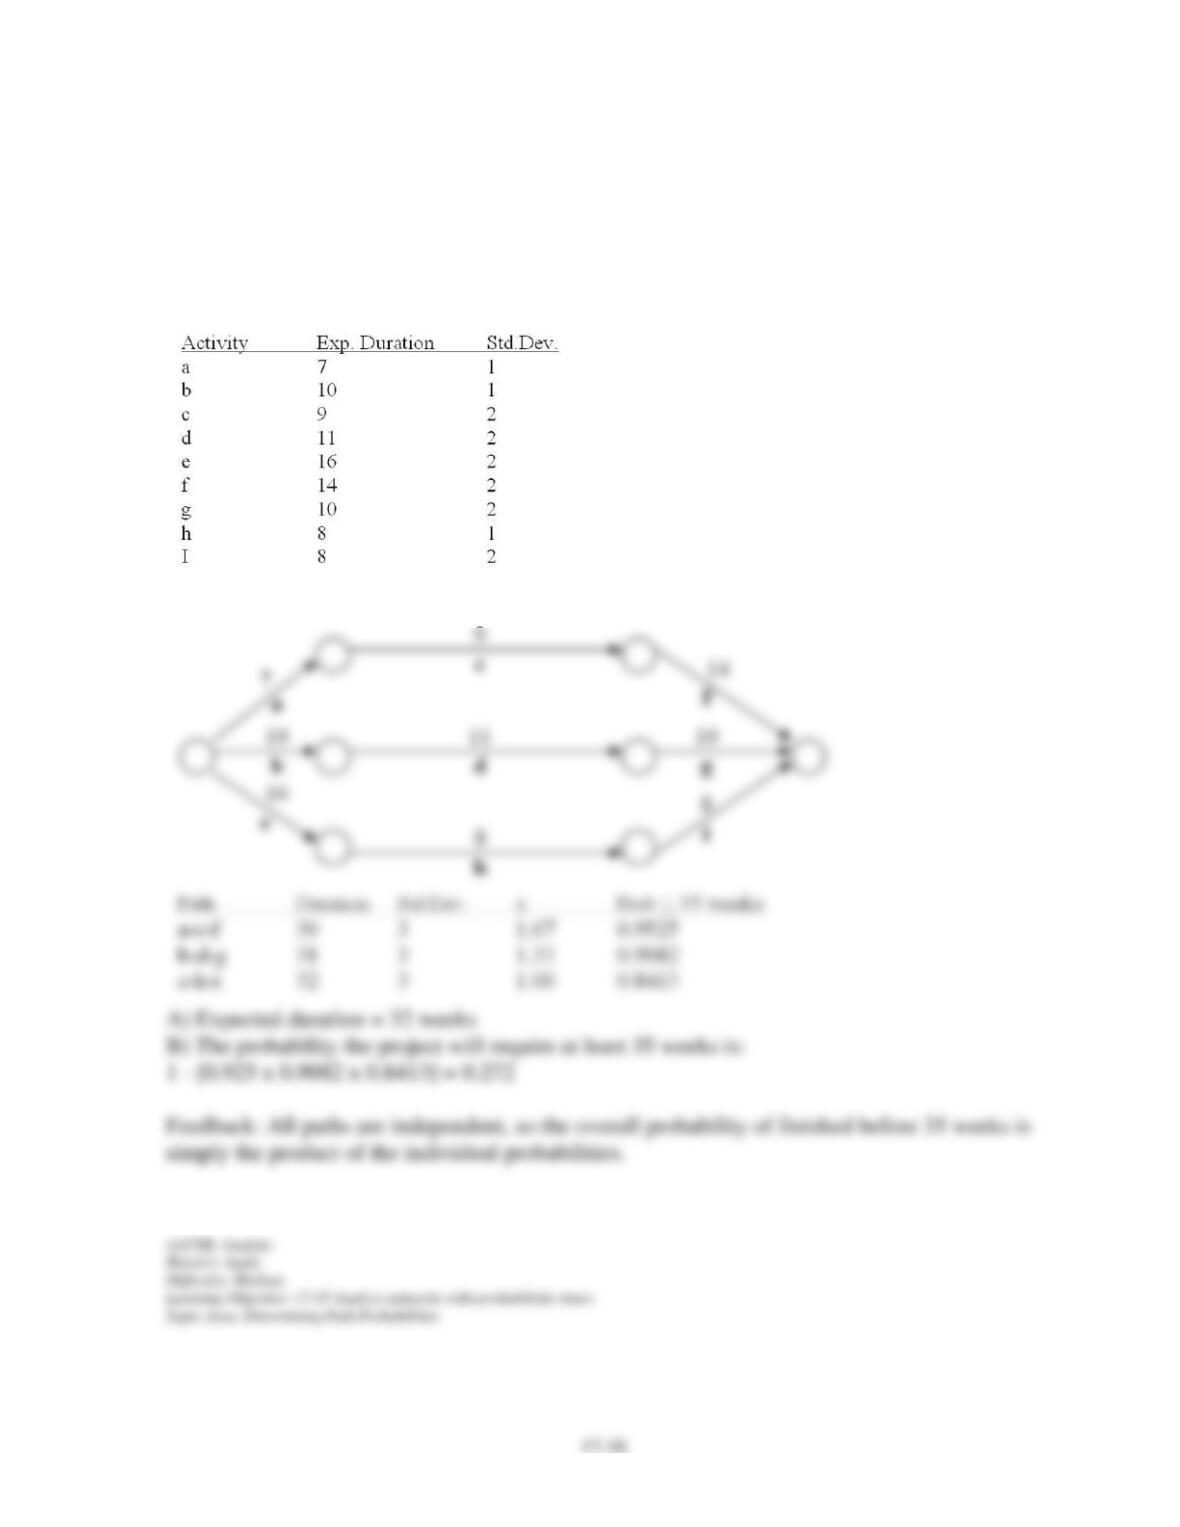
85. A project consists of nine major activities, as shown below. There are three separate paths
in the network: a-c-f, b-d-g, and e-h-i.
(A) What is expected project duration time?
(B) Determine the probability that the project will take more than 35 weeks to complete. (All
times are in weeks.)
Chapter 17 – Project Management
86. Activity E has an optimistic time of 9 days, a most likely time of 12 days, and a
pessimistic time of 15 days. Estimate its expected time and standard deviation.

Chapter 17 – Project Management
87. Prepare a crashing plan for the following project that will reduce the project duration by
three weeks.