Chapter 16 – Simulation
Over 2 months
in advance .40 2 months to 6 months
in advance .40
Over 6 months
In advance .13
Flight Type Rel. Freq. RN Range
Domestic .65
International .35
a. Place the appropriate random number ranges in the tables above.
b. Set up and perform a simulation for three customers. Determine whether they want a domestic or international flight,
and how far in advance the reservation is being made. Use random numbers from this list: .632 .715 .998 .671
.744 .021
52. On a visit to an amusement park you pass someone who has just ridden a roller coaster and asks you for directions to
the First Aid Station. Realizing that traffic at the First Aid Station would be something to study with simulation, you
gather some information. Two EMTs staff the station, and patients wait and go to the first one available. People coming
there can be divided into two groups: those who need something minor (e.g. Tylenol, a band-aid) or those who need more
help. Assume those in the first group constitute 25% of the patients and take 5 minutes to have their problem solved.
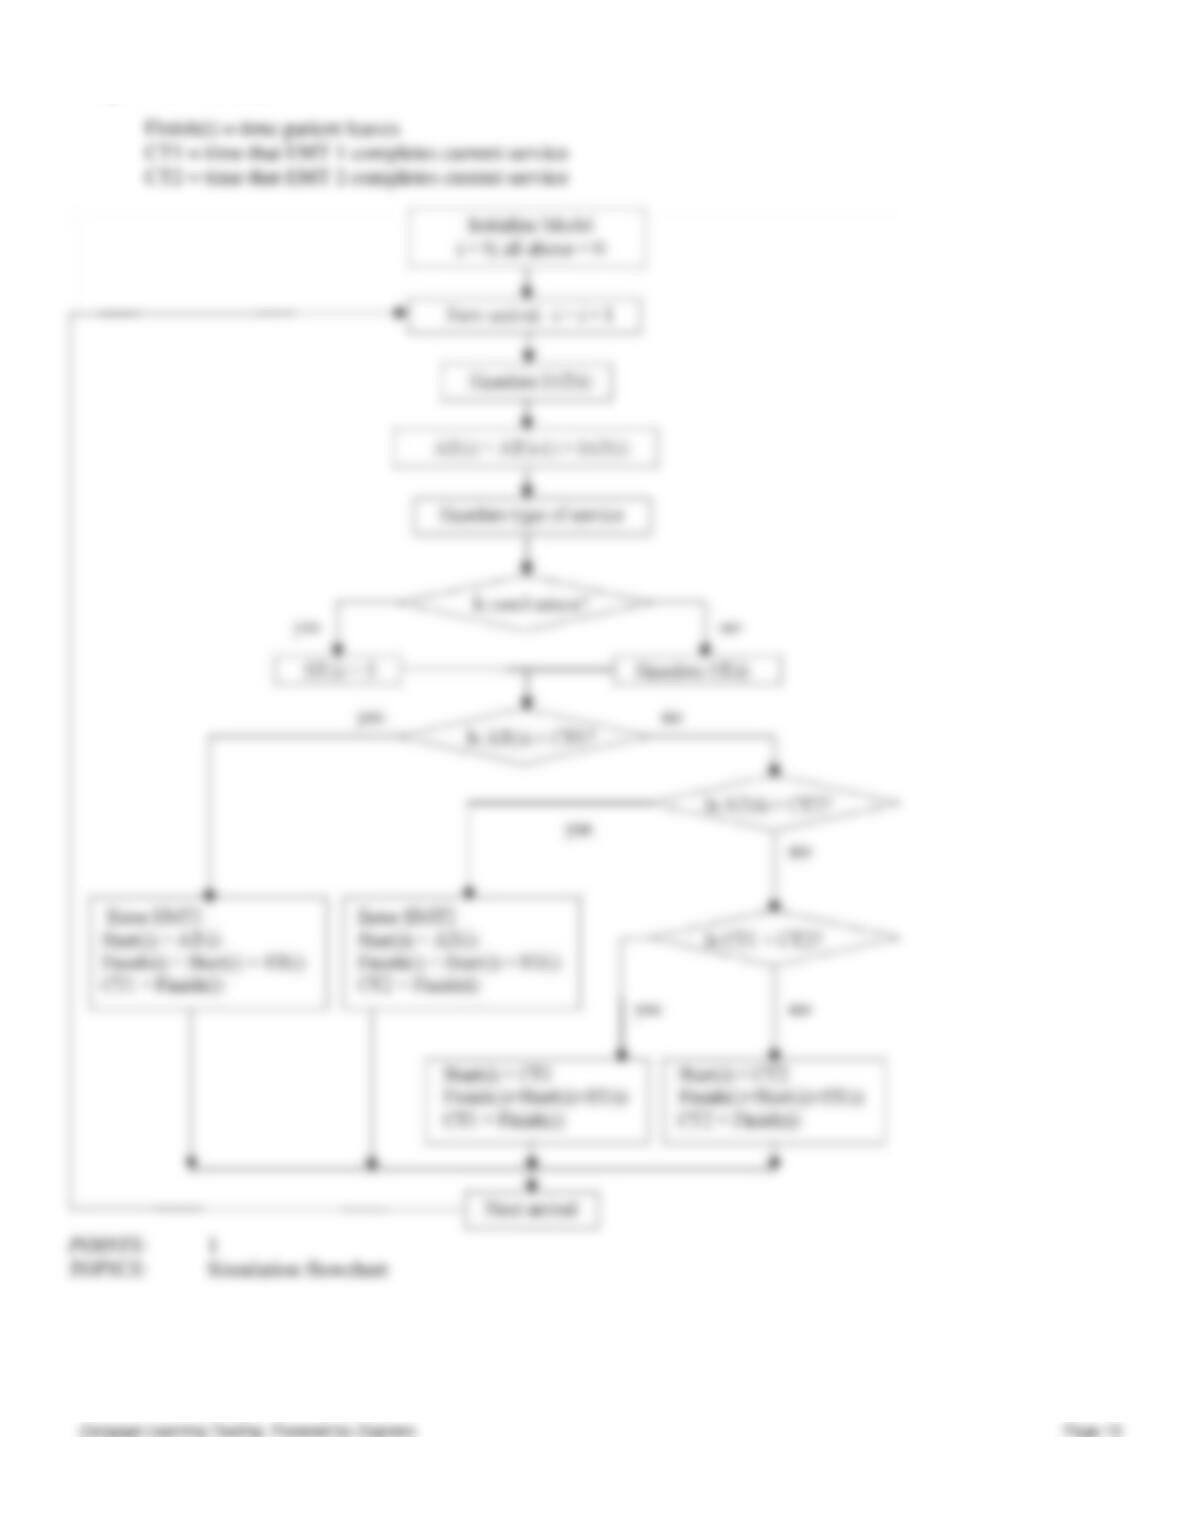
Those in the second group need an uncertain amount of time, as given by a probability distribution. Develop a flowchart
for this simulation problem.
Chapter 16 – Simulation
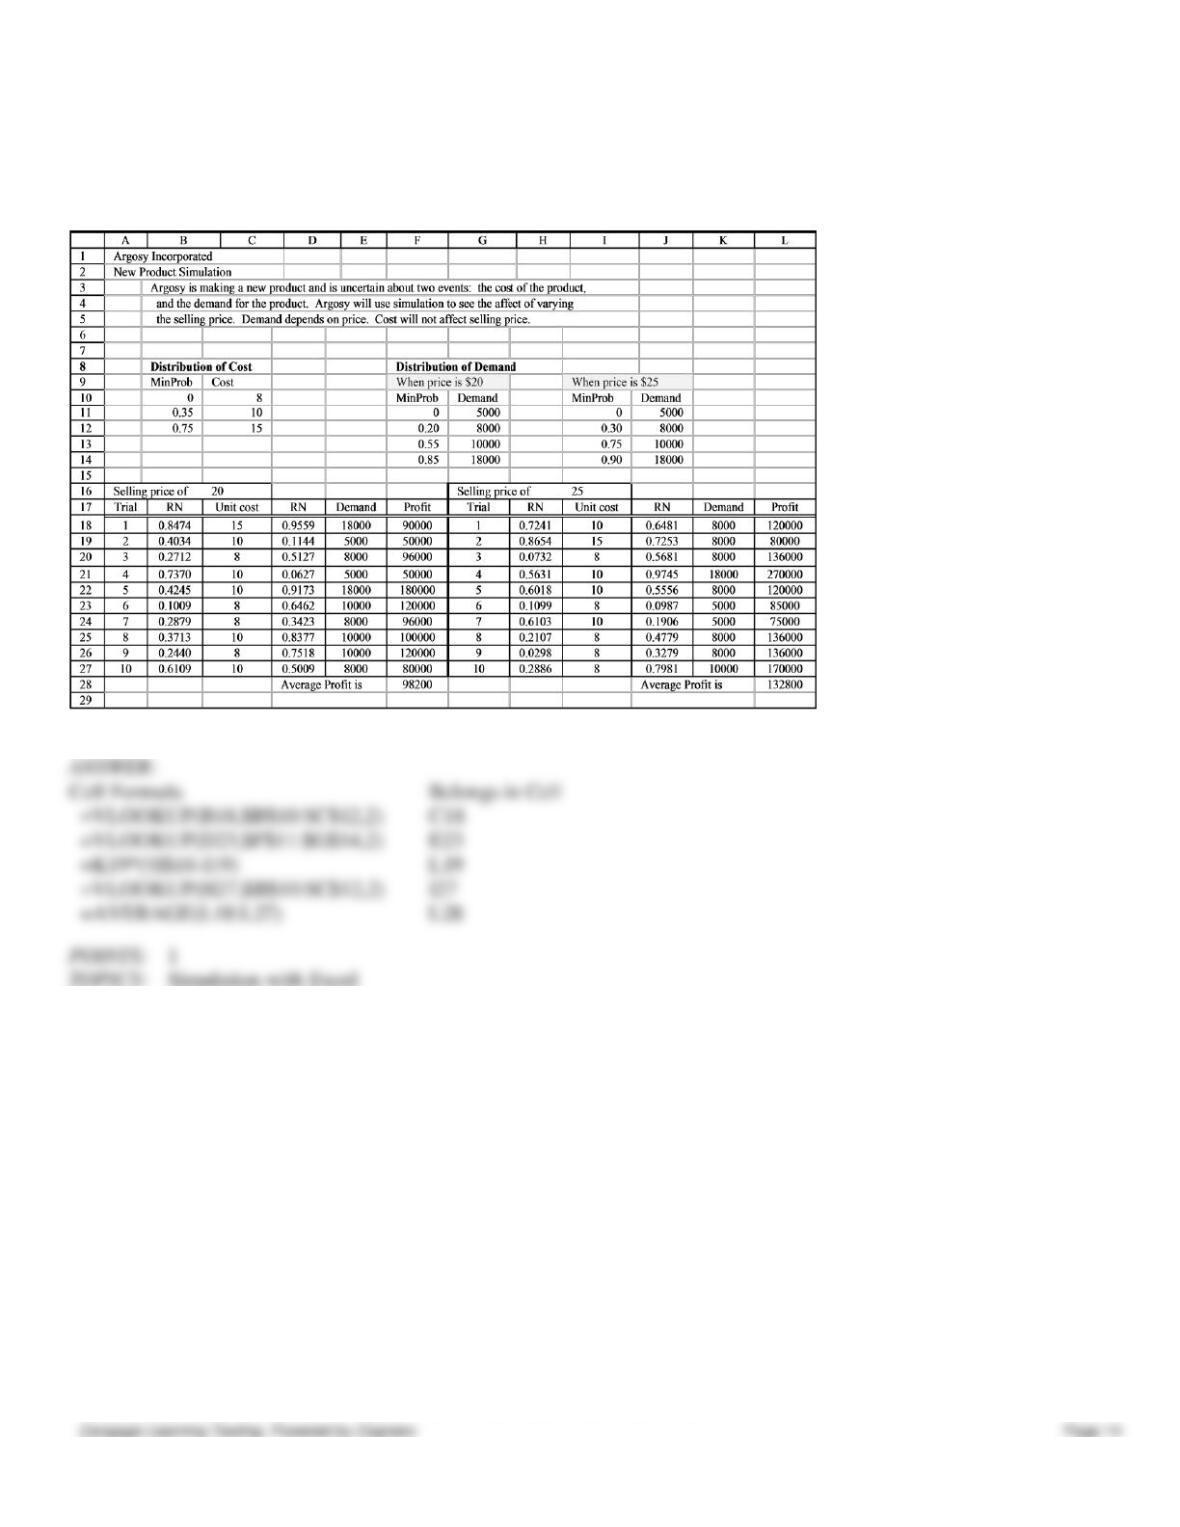
53. Using the spreadsheet below, give the cell address which would have the formula shown.
Cell Formula Belongs in Cell
=VLOOKUP(B18,$B$10:$C$12,2)
Chapter 16 – Simulation
=VLOOKUP(D23,$F$11:$G$14,2)
=K19*($I$16-I19)
=VLOOKUP(H27,$B$10:$C$12,2)
=AVERAGE(L18:L27)
54. As the owner of a rent-a-car agency you have determined the following statistics:
Potential
Rentals Daily Probability Rental
Duration Probability
0 .10 1 day .50
1 .15 2 day .30
2 .20 3 days .15
3 .30 4 days .05
4 .25
The gross profit is $40 per car per day rented. When there is demand for a car when none is available there is a goodwill
loss of $80 and the rental is lost. Each day a car is unused costs you $5 per car. Your firm initially has 4 cars.
a. Conduct a 10-day simulation of this business using Row #1 below for demand and Row #2 below for rental length.
Row #1: 63 88 55 46 55 69 13 17 36 81
Row #2: 59 09 57 87 07 92 29 28 64 36
Chapter 16 – Simulation
b. If your firm can obtain another car for $200 for 10 days, should you take the extra car?
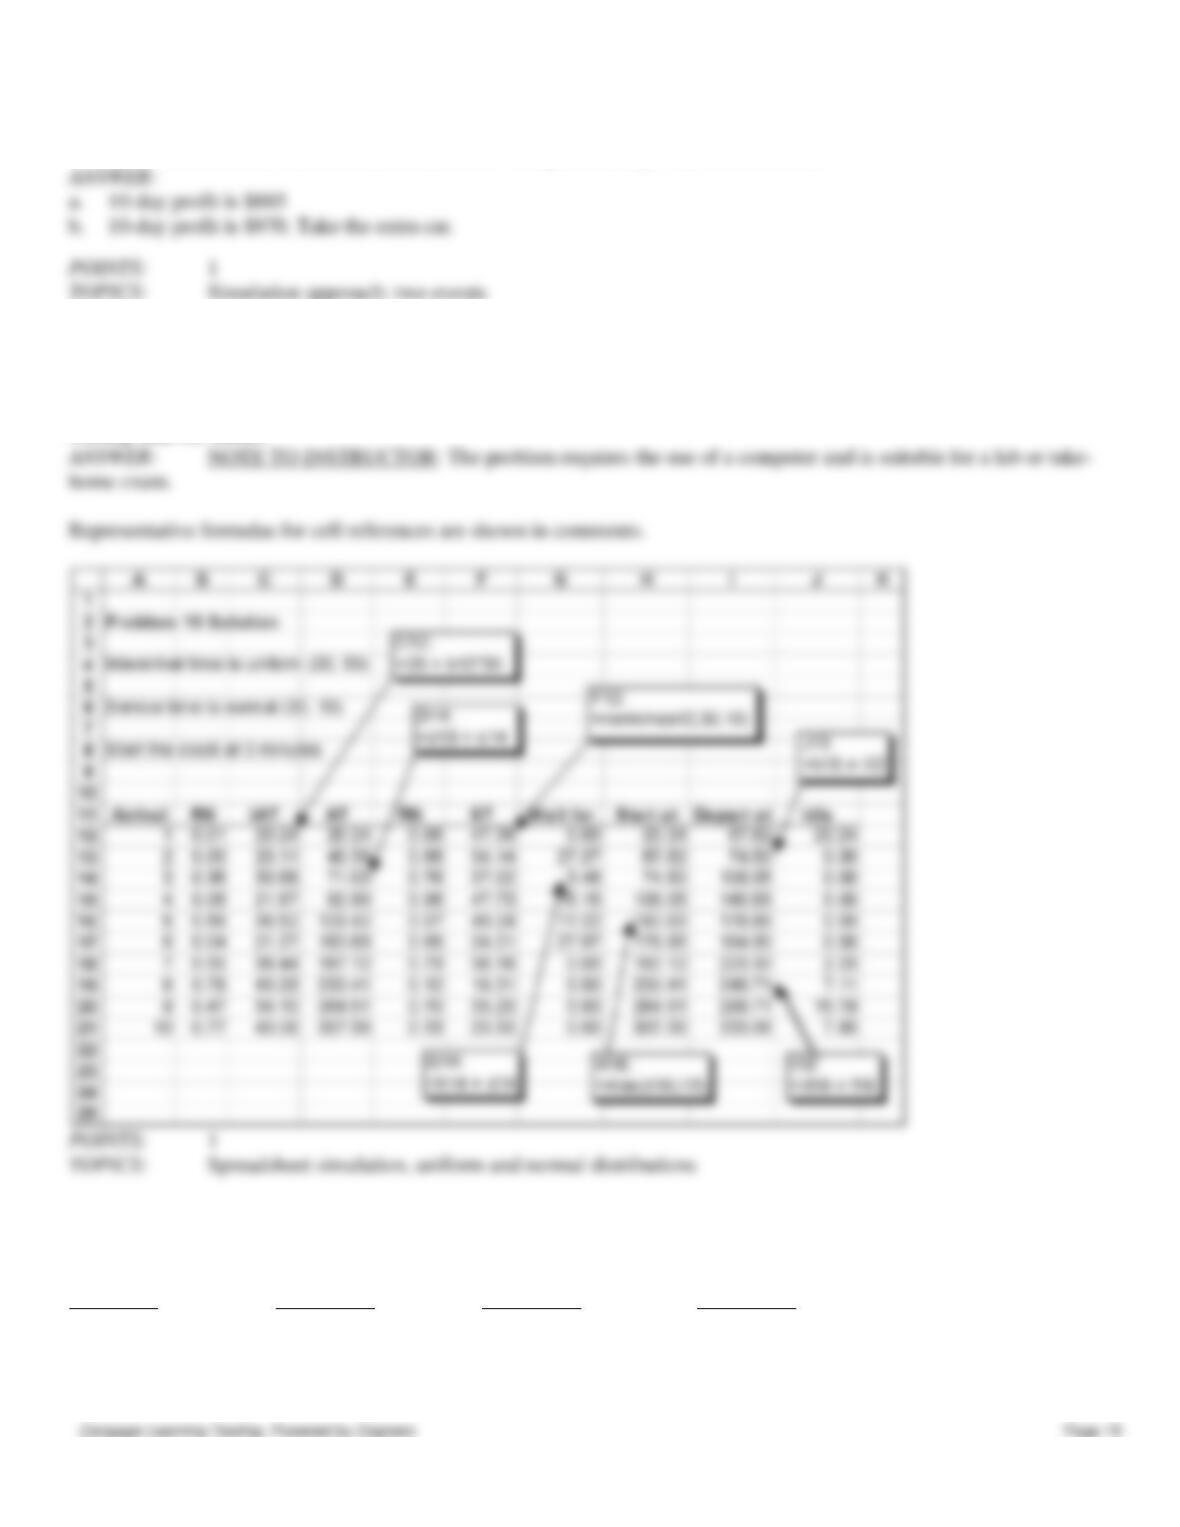
55. Arrivals to a truck repair facility have an interarrival time that is uniformly distributed between 20 and 50 minutes.
Service times are normally distributed with mean 30 minutes and standard deviation 10 minutes. Develop a spreadsheet
model to simulate the arrival of 100 trucks. Collect information on the time the repair facility is idle and on the average
56. Susan Winslow has two alternative routes to travel from her home in Olport to her office in Lewisburg. She can travel
on Freeway 5 to Freeway 57 or on Freeway 55 to Freeway 91. The time distributions are as follows:
Freeway 5 Freeway 57 Freeway 55 Freeway 91
Relative Relative Relative Relative
Time Frequency Time Frequency Time Frequency Time Frequency
5 .30 4 .10 6 .20 3 .30
6 .20 5 .20 7 .20 4 .35
Chapter 16 – Simulation
7 .40 6 .35 8 .40 5 .20
8 .10 7 .20 9 .20 6 .15
8 .15
Do a five-day simulation of each of the two combinations of routes using the random numbers below. Based on this
simulation, which routes should Susan take if her objective is to minimize her total travel time?
Freeway 5 63 88 55 46 55
Freeway 57 59 09 57 87 07
Freeway 55 71 95 83 44 34
Freeway 91 51 79 09 67 15
57. Three airlines compete on the route between New York and Los Angeles. Stanton Marketing has performed an
analysis of first class business travelers to determine their airline choice. Stanton has modeled this choice as a Markov
process and has determined the following transition probabilities.
Next Airline
Last Airline A B C
A .50 .30 .20
B .30 .45 .25
C .10 .35 .55
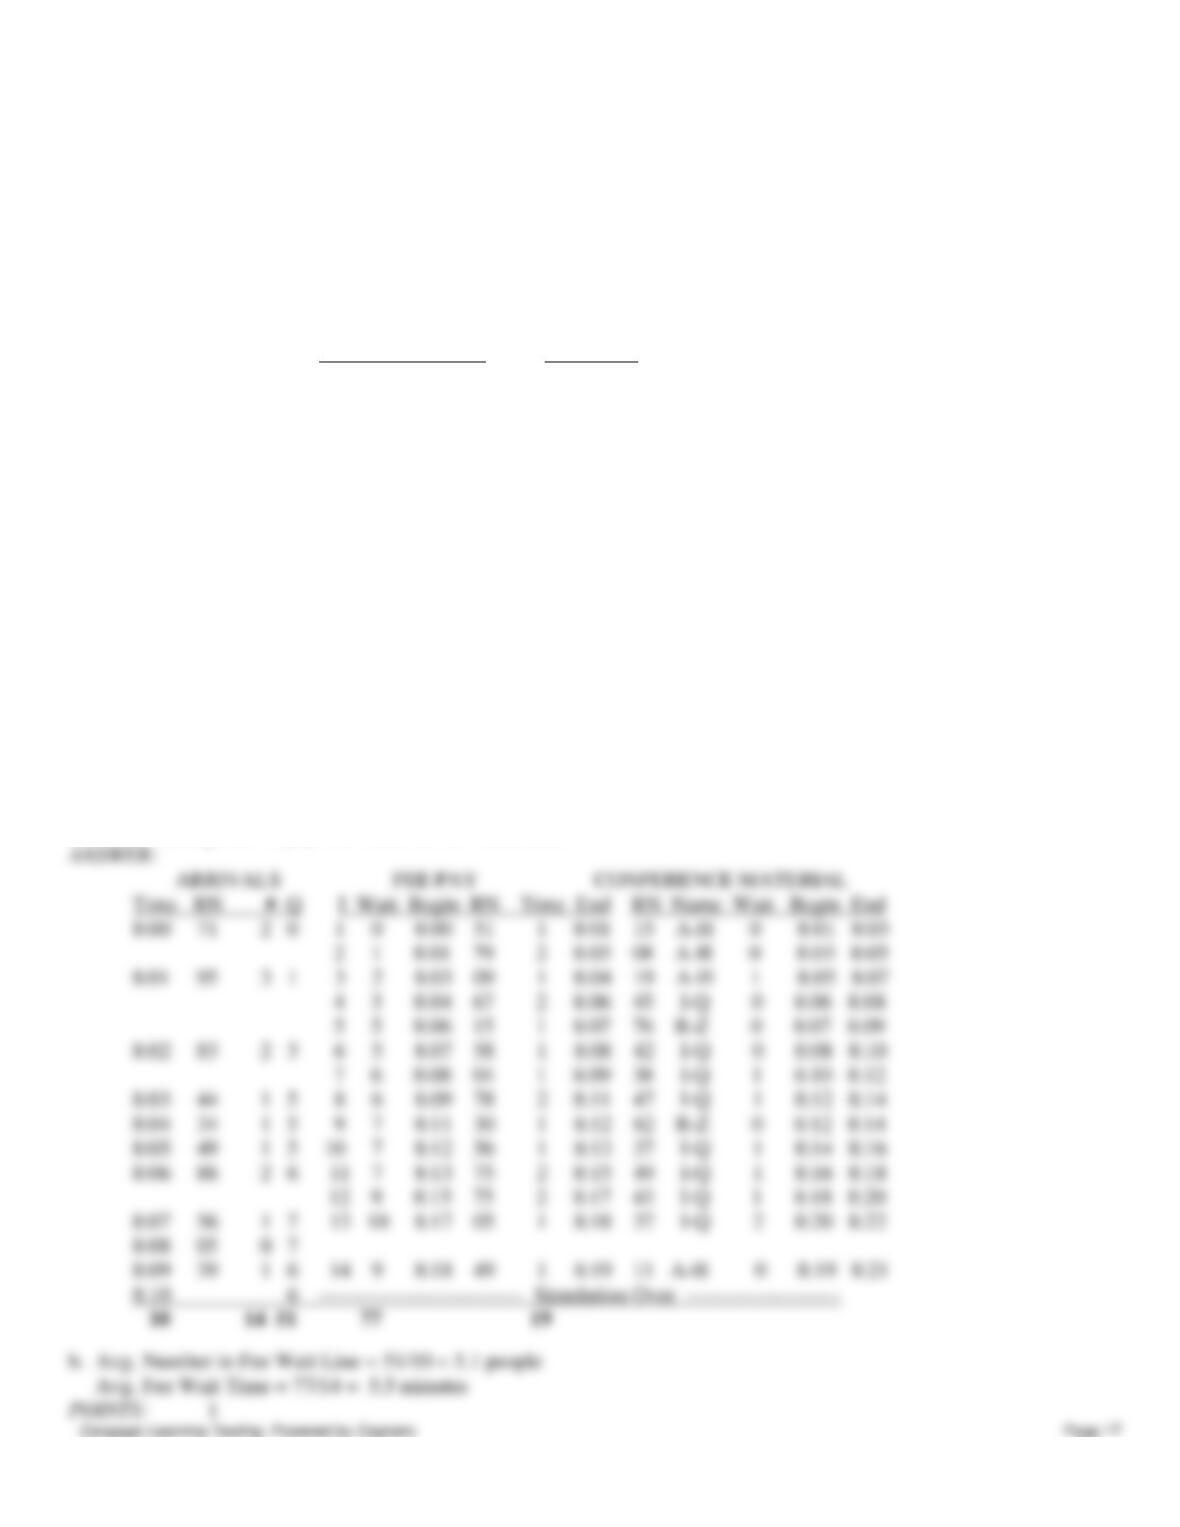
a. Show the random number assignments that can be used to simulate the first class business traveler’s next airline when
her last airline is A, B, and C.
b. Assume the traveler used airline C last. Simulate which airline the traveler will be using over her next 25 flights. What
percent of her flights are on each of the three airlines? Use the following random numbers, going from left to right, top to
bottom.
71 95 83 44 34
49 88 56 05 39
75 12 03 59 29
77 76 57 15 53
37 46 85 24 53
Chapter 16 – Simulation
58. Attendees at the National Management Science Society (NMSS) Conference register by first standing in line to pay
their fees. They then proceed to a designated line based on the first letter of their last name to collect their conference
materials.
At the conference, it is planned to have three different parallel lines for the collection of materials: one each for people
whose last names begin with A-H, I-Q, and R-Z respectively.
During each minute of the morning registration period it is anticipated that attendees will arrive to pay their fees according
to the following distribution:
Number of Arrivals Probability
0 .30
1 .30
2 .30
3 .10
The time to pay one’s fees is either one minute or two minutes depending upon whether one uses a check or credit card.
The probability of a one-minute time is .60.
After paying his fees, an attendee then goes to the correct line for the conference materials. At this year’s conference 35%
of the attendees have last names beginning with A-H, 36% with last names beginning with I-Q, and 29% with last names
beginning with R-Z. The time required to pick up conference materials is fixed at 2 minutes.
a. Simulate the waiting line for the first 10 minutes of the morning registration that begins at 8:00 AM. Use the
following random numbers to generate:
Number of arrivals in any given minute: 71, 95, 83, 44, 34, 49, 88, 56, 05, 39
Registration fee service time: 51, 79, 09, 67, 15, 58, 04, 78, 30, 56
First letter of the last name: 15, 08, 19, 45, 76, 42, 38, 47, 82, 37
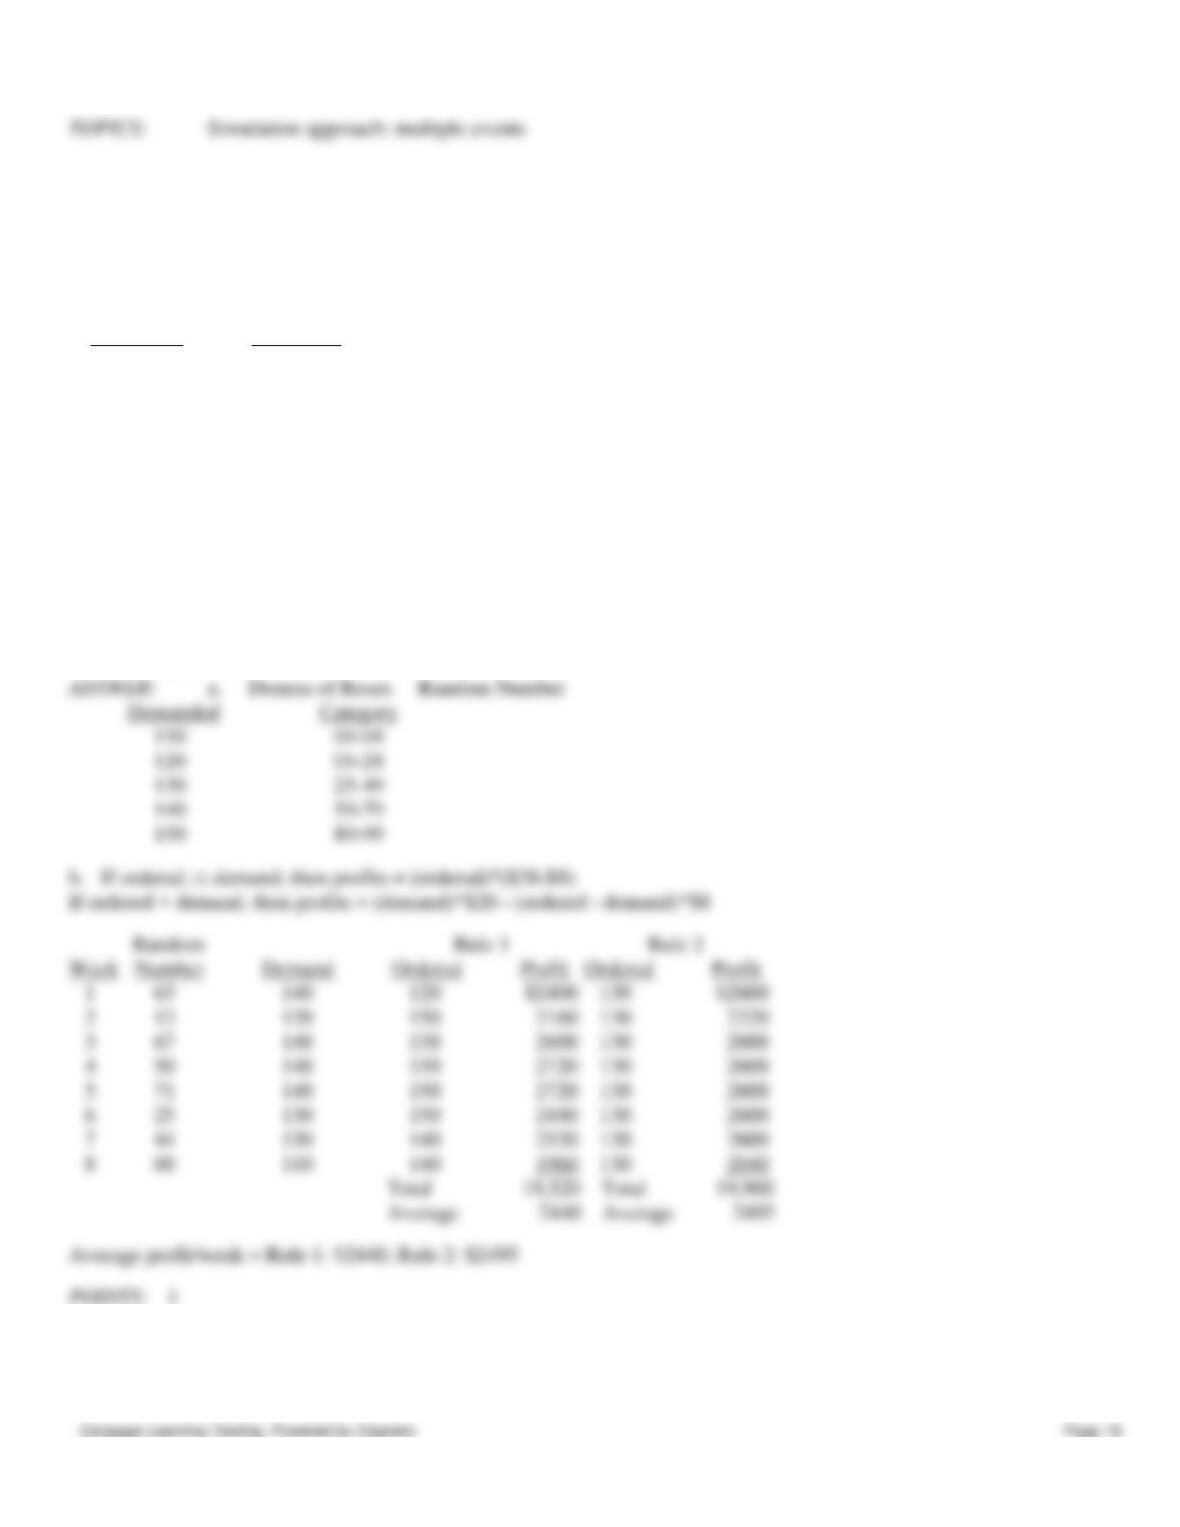
b. What is the average size of the waiting line to pay fees (not including the person being served), and the average
customer waiting time to pay fees based on this simulation?
Chapter 16 – Simulation
59. The Rose Warehouse buys roses each week from Panama. A toll‑free long distance call is made on Saturday night,
and early Monday morning roses arrive at the airport in a box refrigerated with dry ice. The roses cost $8 a dozen and are
sold on a cash-and-carry basis for $28 a dozen. Roses left over at the end of the week are put in a trash collector in an
alley behind the store. Past sales (rounded to the nearest ten dozen) are as follows:
Dozens of Roses Relative
Demanded Frequency
110 5
120 20
130 25
140 30
150 20
The owner of the Rose Warehouse wants to compare two ordering rules for ordering roses: (1) order last week’s demand
plus 10 dozen extra (as safety stock), (2) order 130 dozen every week. He wants to run an eight-week simulation to
compare the average weekly profit for the two rules. Last week’s demand was for 110 dozen. He generated the following
random numbers for weeks 1‑8, respectively: 63, 13, 67, 50, 71, 25, 44, and 00.
a. What is the random number range corresponding to each of the five demand quantities?
b. Simulate eight weeks of operation using each of the ordering rules and compute the average weekly profit resulting
from each rule.
60. A pastry store wants to know how many dozen muffins to bake each day. Every dozen they sell fresh in the shop
returns a profit of $5.00. Every dozen they bake but do not sell on the day they are baked is given to a local charity at a
Chapter 16 – Simulation
loss of $3.00 a dozen. The business is fairly stable in that they never sell less than 50 dozen nor more than 80 dozen
muffins. Their sales history, rounded to the nearest ten dozen muffins is as shown:
Dozens of Number of Days
Muffins Sold That many Sold
50 12
60 37
70 45
80 18
They want to run a ten day simulation for production rates of 50, 60, 70, and 80 muffins to determine the profit (loss) for
each. They generated the following random numbers for days 1‑10 respectively: 63, 13, 67, 50, 71, 25, 44, 00, 56, and 68.
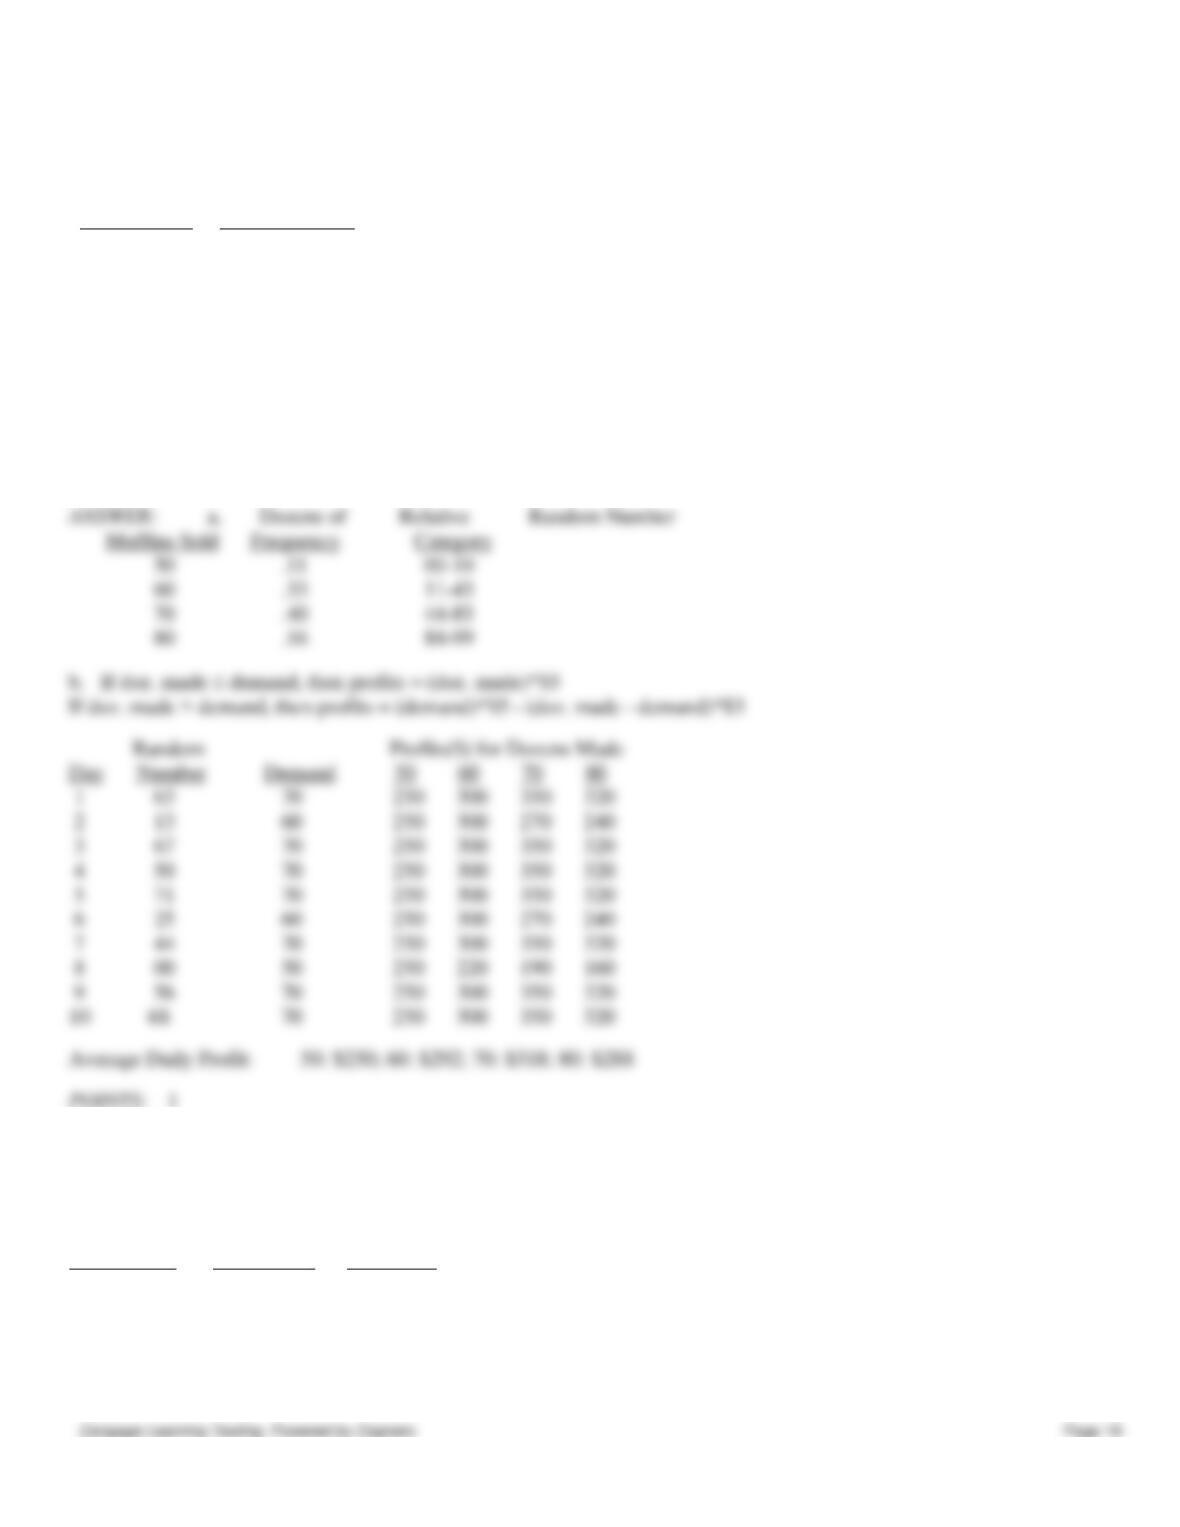
a. Specify the random numbers range corresponding to each muffins-sold quantity.
b. Simulate 10 days of sales using four different daily production quantities: 50, 60, 70, and 80 muffins per day. For each
production quantity, compute the average daily profit.
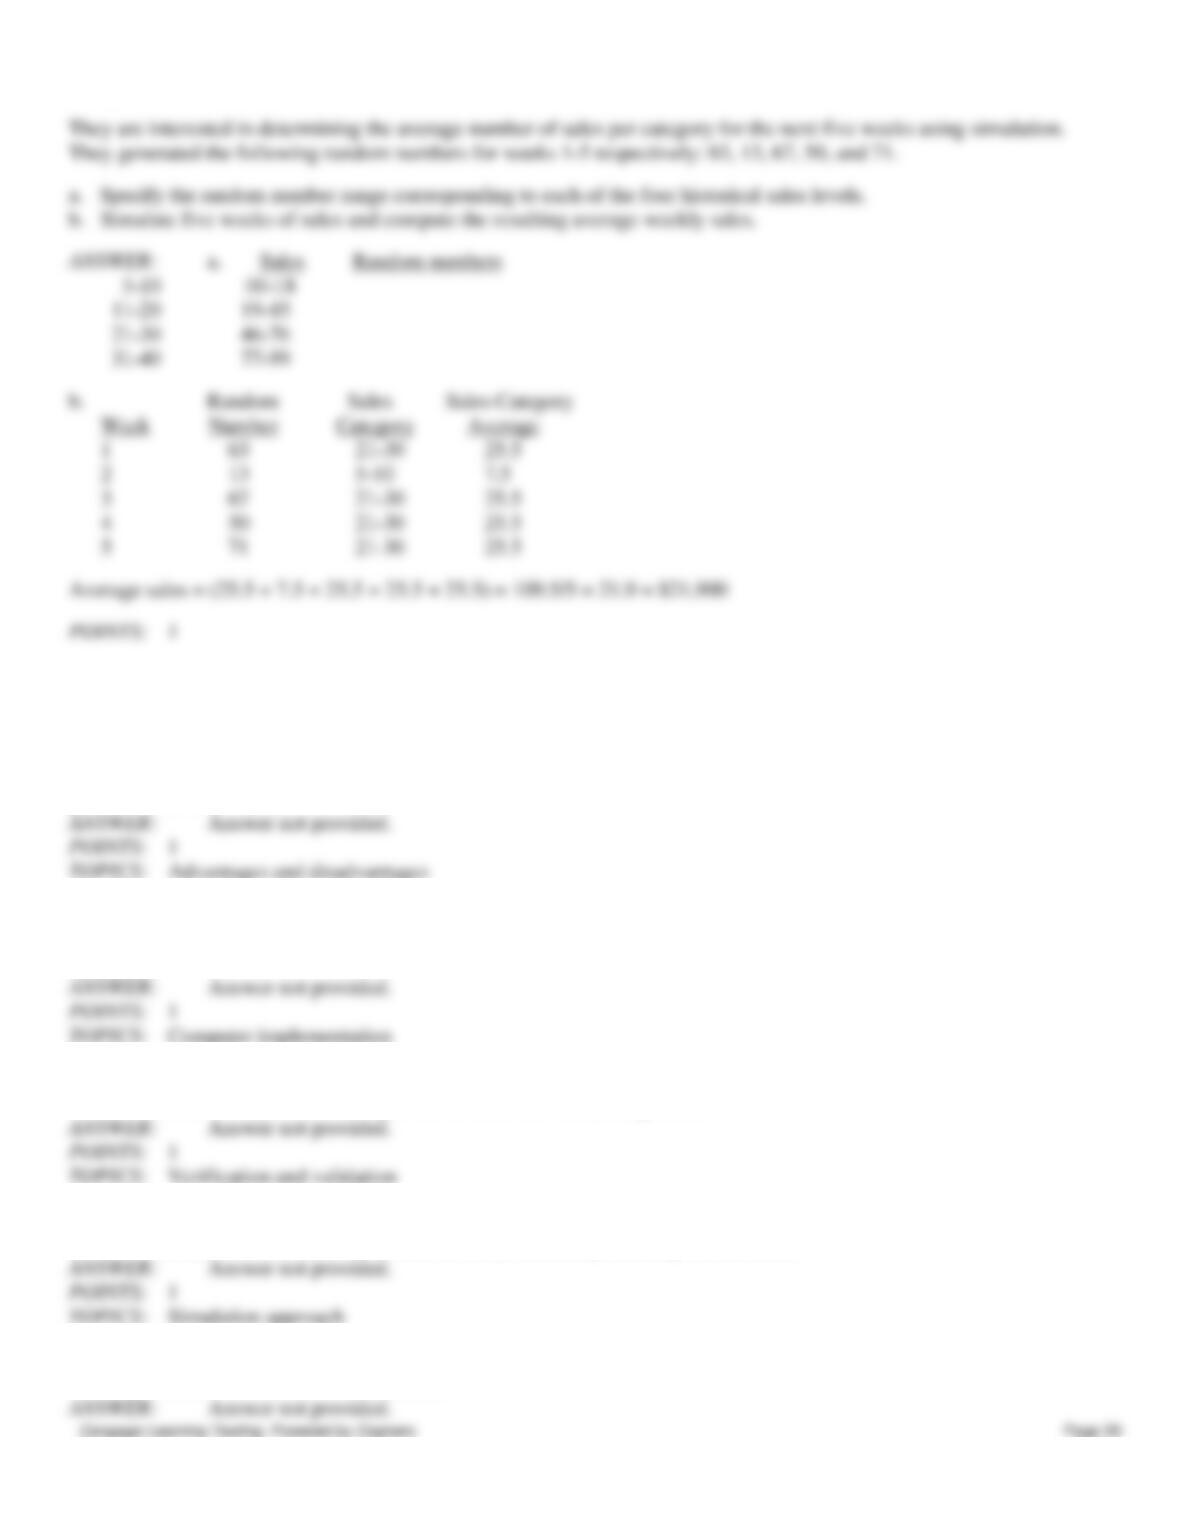
61. A lumber company sells 8‑foot 2×4’s to construction companies in three states. They have historical sales demand (in
thousands) for the past 26 weeks, as shown below:
Historical Number of Relative
Sales ($000) Weeks Sold Frequency
5‑10 5 .19
11‑20 7 .27
21‑30 8 .31
31‑40 6 .23
Chapter 16 – Simulation
Essay
62. Simulation is to be used to study customer waiting patterns at several branches of an organization. Acknowledging
that arrivals and service times follow different distributions over the branches, of what use is the development of a
general simulation model?
63. Why would one want to use a general purpose programming language rather than a spreadsheet to develop a
simulation?
64. How are both analysts and managers involved in the validation process?
65. How can historical information be used to create discrete probability distributions?
66. Why is a flowchart useful in simulation?
Chapter 16 – Simulation
67. Explain the difference between verification and validation as they relate to a simulation model.