Unlock document.
This document is partially blurred.
Unlock all pages and 1 million more documents.
Get Access
Quantitative Analysis for Management, 11e (Render)
Chapter 16 Statistical Quality Control
1) W. Edwards Deming introduced control charts in the 1920s.
2) Statistical process control uses regression and other forecasting tools to help control processes.
3) The U.S. government awards for quality achievement are called the Malcolm Baldrige National Quality
Awards.
4) Technically, to achieve Six Sigma quality, there would have to be fewer than 3.4 defects per million
opportunities.
5) It is impossible to develop a process that has zero variability.
6) If all of the control points on a control chart lie between the UCL and the LCL, the process is always in control.
7) Assignable variations in a process are also called natural variations.
8) An x-bar chart would be appropriate to monitor the number of defects in a production lot.
9) The central limit theorem provides the statistical foundation for control charts.
10) If we are tracking quality of performance for a class of students, we should plot the individual grades on an x-
bar chart, and the pass/fail result on a p-chart.
11) Samples sizes of five are often used when building control charts.
12) A p-chart could be used to monitor the average weight of cereal boxes.
13) If we are attempting to control the diameter of bowling bowls, we will find a p-chart to be quite helpful.
14) A c-chart would be appropriate to monitor the number of weld defects on the steel plates of a ship's hull.
15) Which of the following is not a popular definition of quality?
A) Quality is the totality of features and characteristics of a product or service that bears on its ability to satisfy
stated or implied needs.
B) Quality is defined as a competitively priced product that surpasses customer needs.
C) Quality is the degree to which a product conforms to design or specification.
D) Quality is fitness for use.
E) Even though quality cannot be defined, you know what it is.
16) Variations that need not occur in production processes are referred to as
A) assignable variations.
B) control variations.
C) natural variations.
D) process variations.
E) None of the above
17) Variations that usually occur in a process are called
A) process variations.
B) natural variations.
C) control variations.
D) assignable variations.
E) None of the above
18) A company believes a process monitored by an x-bar chart to be in control. When the most recent control
point exceeded the UCL value by 20%, the company should
A) believe that a random bad luck chance occurred and proceed.
B) suspect that an assignable cause of variation now exists and can be found.
C) ignore the control point completely, as it is simply an outlier.
D) wait for the next four samples to be taken to see if a trend develops.
E) All of the above
19) Bags of pretzels are sampled to ensure proper weight. The overall average for the samples is 9 ounces. Each
sample contains 25 bags. The standard deviation is estimated to be 3 ounces. The upper control chart limit (for
99.7% confidence) for the average would be ________ ounces.
A) 9.4
B) 18.0
C) 10.2
D) 7.2
E) 10.8
20) The inspection of cans of juice involves sampling some cans and weighing them. The overall average for the
samples is 39 ounces. Each sample contains 36 cans. The standard deviation is estimated to be 2 ounces. The
99.7% lower control chart limit for the average would be ________.
A) 37.67
B) 38.00
C) 39.33
D) 40.00
E) none
21) -charts indicate changes in
A) variation.
B) central tendency.
C) natural variations.
D) numbers of defects.
E) None of the above
22) Who introduced control charts in 1924?
A) W. Edwards Deming
B) Philip Crosby
C) J.M. Juran
D) William Shewhart
E) Malcolm Baldrige
23) The -chart would be useful when we
A) took a number of measurements and computed the average.
B) took a number of measurements and computed the ranges.
C) found the fraction of the production lot defective.
D) found the number of defective items in a production lot.
E) None of the above
24) The R-chart would be useful when we
A) took a number of measurements and computed the average.
B) took a number of measurements and computed the ranges.
C) found the fraction of the production lot defective.
D) found the number of defective items in a production lot.
E) None of the above
25) R-charts measure changes in
A) central tendency.
B) degree of variation.
C) number of defects per production lot.
D) natural variations.
E) None of the above
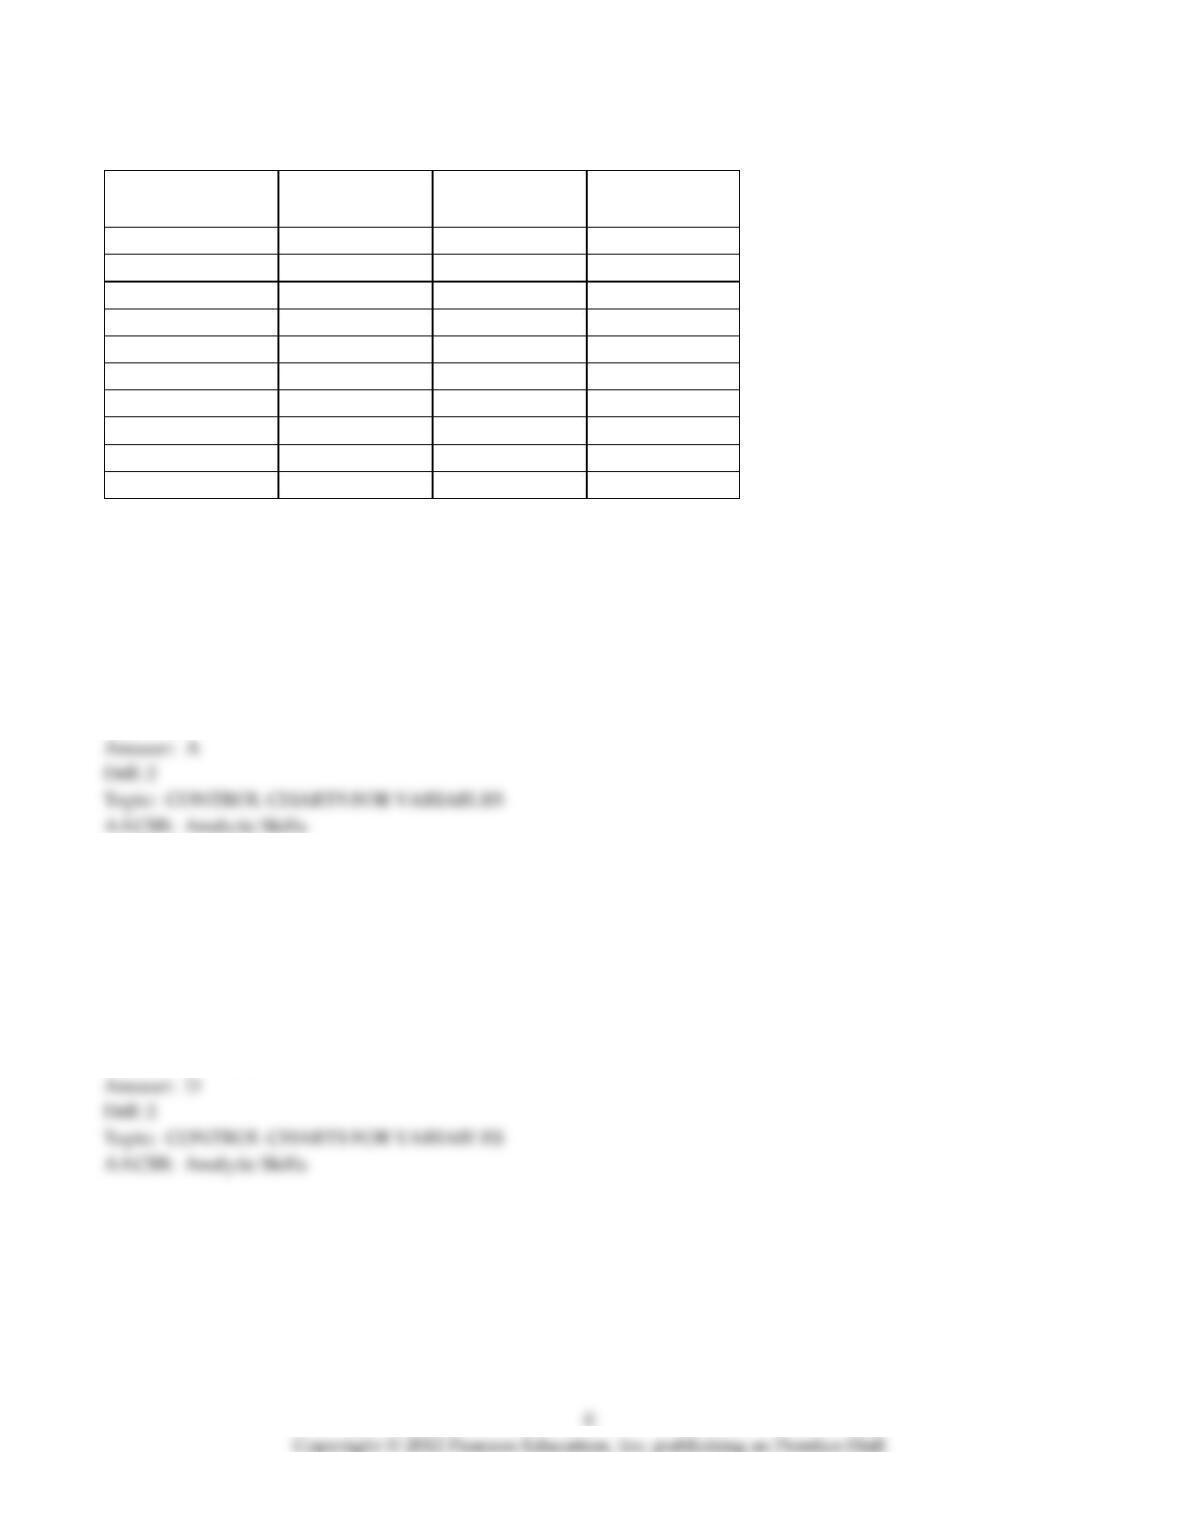
Table 16-1
Sample Size
n
Mean Factor
A2
Upper Range
D4
Lower Range
D3
2
1.880
3.628
0
3
1.023
2.574
0
4
0.729
2.282
0
5
0.577
2.114
0
6
0.483
2.004
0
7
0.419
1.924
0.076
8
0.373
1.864
0.136
9
0.337
1.816
0.184
10
0.308
1.777
0.223
12
0.266
1.716
0.284
26) Refer to Table 16-1. Bags of chocolate candy are sampled to ensure proper weight. The overall average for the
samples is 36 ounces. Each sample contains twelve bags. The average range is 1.3 ounces. The upper control
chart limit for the sample averages would be
A) 36.3458.
B) 35.6542.
C) 38.3101.
D) 36.6279.
E) 37.1258.
27) Refer to Table 16-1. Bags of chocolate candy are sampled to ensure proper weight. The overall average for the
samples is 36 ounces. Each sample contains eight bags. The average range is 1.3 ounces. The lower control chart
limit for the sample averages would be
A) 36.3730.
B) 36.4849.
C) 35.6270.
D) 35.5150.
E) None of the above
28) Refer to Table 16-1. To guarantee that cans of soup are properly filled, some cans are sampled and the
amounts measured. The overall average for the samples is 12 ounces. Each sample contains 10 cans. The average
range is 0.4 ounces. The upper control chart limit for the sample averages would be
A) 12.1232.
B) 11.8768.
C) 13.2.
D) 12.308.
E) None of the above
29) Refer to Table 16-1. To guarantee that cans of soda are properly filled, some cans are sampled and the
amounts measured. The overall average for the samples is 12 ounces. Each sample contains 10 cans. The average
range is 0.4 ounces. The lower control chart limit for the sample averages would be
A) 12.1232.
B) 11.8768.
C) 13.2.
D) 12.308.
E) None of the above
30) Refer to Table 16-1. Bags of tea are sampled to ensure proper weight. The overall average for the samples is 8
ounces. Each sample contains 10 bags. The average range is 0.1 ounces. What is the lower limit of the sample
averages chart?
A) 7.9692
B) 8.0308
C) 7.9076
D) 8.0924
E) None of the above
31) Refer to Table 16-1. The Pristine Paint Company produces paint in gallon cans. They have found that in more
than 10 samples of 8 cans each, the average gallon can contains 1.1 gallons of paint. The average range found
over these samples is 0.15 gallons. What is the upper control limit for the sample averages in this process?
A) 1.100
B) 1.150
C) 1.268
D) 1.156
E) None of the above
32) Refer to Table 16-1. The average range of a process for packaging cereal is 1.1 ounces. If the sample size is 10,
find the upper control chart limit for the range chart.
A) 0.245
B) 1.955
C) 1.777
D) 0.223
E) None of the above
33) Refer to Table 16-1. The average range of a process for packaging cereal is 1.1 ounces. If the sample size is 10,
find the lower control chart limit for the range chart.
A) 0.245
B) 1.955
C) 1.777
D) 0.223
E) None of the above
34) The U.S. government award for quality achievement is the ________.
A) Deming Prize
B) Shewhart Symbol of Excellence
C) Malcolm Baldrige National Quality Award
D) Bush Award for Quality Management
E) Six Sigma Certification
35) The p-chart would be useful when we
A) took a number of measurements and computed the average.
B) took a number of measurements and computed the ranges.
C) found the fraction of the production lot defective.
D) found the number of defective items in a production lot.
E) None of the above
36) A plant manager is concerned with the variability of beer being filled in 12 oz. cans. The most appropriate
control chart would be which of the following?
A) x-bar chart
B) R-chart
C) p-chart
D) c-chart
E) None of the above
37) An airline company tracks the number of lost bags that occur each day. This is best monitored by which of the
following control charts?
A) x-bar chart
B) R-chart
C) p-chart
D) c-chart
E) None of the above
38) When receiving a shipment from a supplier, inspection must be done to check the fraction of defective
products. This is best monitored by which of the following control charts?
A) x-bar chart
B) R-chart
C) p-chart
D) c-chart
E) None of the above
39) A coffee dispenser is supposed to dispense coffee into an 8 o.z. cup. The average amount of coffee filled into
the cup must be below 7.9. This is best monitored by which of the following control charts?
A) x-bar chart
B) R-chart
C) p-chart
D) c-chart
E) None of the above
40) Which of the following control charts is/are for attributes?
A) p-chart
B) x-bar chart
C) R-chart
D) A and B
E) A, B, and C
41) Defects in computer hard-drives will usually render the entire computer worthless. For a particular model,
the percent defective in the past has been 1%. If a sample size of 400 is taken, what would the 95.5% lower control
chart limit be?
A) 0.00995
B) 0.00005
C) 0.00000
D) 0.01000
E) 0.09550
42) A quality control program is being developed for batteries. The percent defective for these in the past has
been 3%. If a sample size of 120 is taken, what would the 99.7% upper control chart limit be?
A) 0.0812
B) 0.0767
C) 0.0611
D) 0.0307
E) 0.0471
43) Defects in marble countertops usually require the whole top to be reconstructed. In one kitchen shop, the
percent defective in the past has been one percent. If a sample size of 30 is taken, what should be the 95.5 percent
upper control limit be?
A) 0.030
B) 0.000
C) 0.046
D) 0.064
E) None of the above
44) Defects in the finish of new, custom, automobiles usually require the whole body to be repainted. In one
"custom" shop, the percentage of defective finishes has been 2 percent. If a sample size of 10 is taken, what
should be the 99.7 percent upper control limit be?
A) 0.1328
B) 0.1085
C) 0.0443
D) 0.1528
E) None of the above
Table 16-2
Given the sample results (100 units in each sample):
Sample
Number
Number of
Errors
Fraction
Defective
1
0
0.00
2
9
0.09
3
6
0.06
4
7
0.07
5
2
0.02
6
7
0.07
7
7
0.07
8
5
0.05
9
4
0.04
10
5
0.05
45) Find the 95.5% lower limit of the appropriate p-chart.
A) 0.0076
B) 0.0964
C) 0.2014
D) 0.1397
E) None of the above
46) The c-chart is be useful when we
A) take a number of measurements and compute the average.
B) take a number of measurements and compute the ranges.
C) find the fraction of the production lot defective.
D) find the number of defective items in a production lot.
E) None of the above
47) A company has been receiving complaints about the attitude of some sales clerks. Over a 10-day period, the
total number of complaints was 360. The company wishes to develop a control chart for the number of
complaints. What would the upper control limit on the number of complaints per day be for a 3 sigma (99.7%)
control chart?
A) 18
B) 36
C) 42
D) 54
E) None of the above
48) A company has been receiving complaints about the attitude of some sales clerks. Over a 10-day period, the
total number of complaints was 360. The company wishes to develop a control chart for the number of
complaints. What would the upper control limit on the number of complaints per day be for a 2 sigma (95.5%)
control chart?
A) 12
B) 42
C) 48
D) 54
E) None of the above
49) A company has been receiving complaints about the attitude of some sales clerks. Over a 10-day period, the
total number of complaints was 250. The company wishes to develop a control chart for the number of
complaints. What would the lower control limit on the number of complaints per day be for a 3 sigma (99.7%)
control chart?
A) 20
B) 0
C) 15
D) 10
E) 202.6
50) A company has been receiving complaints about the attitude of some sales clerks. Over a 10-day period, the
total number of complaints was 250. The company wishes to develop a control chart for the number of
complaints. What would the lower control limit on the number of complaints per day be for a 2 sigma (95.5%)
control chart?
A) 20
B) 0
C) 15
D) 10
E) 202.6
51) A company has been receiving complaints about the attitude of some sales clerks. Over a 10-day period, the
total number of complaints was 250. The company wishes to develop a control chart for the number of
complaints. What would the upper control limit on the number of complaints per day be for a 2 sigma (95.5%)
control chart?
A) 35
B) 40
C) 50
D) 200
E) None of the above
52) Technically, to achieve Six Sigma quality, there would have to be fewer than ________ defects per million
opportunities.
A) 6
B) 166,667
C) 667
D) 67
E) 3.4
53) A company is producing cylindrical blocks for a children's toy. The average diameter of a block is 3.5 inches.
Sixteen blocks are inspected and the diameters are measured. The standard deviation is estimated to be 0.02
inches. What are the 99.7% upper and lower control limits for the x-bar chart?
54) A coffee company is attempting to make certain that all its packaged coffee beans contain the same amount of
coffee bean by weight. Over the last few days, it has taken several samples. The overall average weight of the
sampled packages is 16 ounces, with an average range of 4 ounces. Each sample was of five packages. What
would be the 99.7 upper and lower control limits for an chart?
55) A coffee company is attempting to make certain that all its packaged coffee beans contain the same amount of
coffee bean by weight. Over the last few days, it has taken several samples. The overall average weight of the
sampled packages is 16 ounces, with an average range of 3 ounces. Each sample was of four packages. What
would be the 99.7 upper and lower control limits for an R chart?
56) A local children's boutique specializes in formal wear for young girls. It has recently hired a new seamstress.
To assure the dresses have standard sizes, twenty samples of each 12 dresses that were labeled 3T were sampled.
The average length from shoulder to hemline measured 21 inches with a range of 0.5 inches. A sample has just
been taken with the following lengths: 21.25, 22.0, 21.5, 20.75, 21.25, 21.35, 21.35, 21.35, 21.35, 21.35, 21.35, and
21.35. Is the new seamstress performing at an acceptable quality level?
57) A computer diskette manufacturer is concerned that some diskettes have bad sectors that would cause a
diskette to hold less information than it was intended to hold. In the past, only 5% of these diskettes have had
bad sectors. If the company wishes to set 95.5% control limits based on samples of size 500, what would these
limits be?
58) A p-chart has been developed for a particular item. In the past, 4% of such items have been found to be
defective. If a sample of 100 is taken, and 9 of these are found to be defective, should the process be considered
out of control based on 99.7% control limits? Explain
59) A p-chart has been developed for a particular item. In the past, 4% of such items have been found to be
defective. If a sample of 100 is taken, and 9 of these are found to be defective, should the process be considered
out of control based on 95.5% control limits? Explain.
60) A computer software manufacturer has a toll-free telephone number that customers may use if they have
problems or questions about the software. In the past, the company has averaged four calls per hour on a
particular product. If a 95.5% c-chart is developed for this, what would the limits be?
61) Leo Phan is the new business manager at PC Priced Right. He is concerned that his register is incorrectly
ringing items. For those items sold during the last seven days, he has counted 10 that were incorrectly charged.
What would be the 99.7% control limits for number of incorrect rings per week on this process?
62) A retail store charts the number of customer returns per day. Under normal conditions, the store expects 10
customer returns per day. During the past 10 days, the observed customer returns were as follows: 12, 9, 8, 14, 8,
13, 8, 10, 9, 11. Using 99.7% control limits, is the process under control?
63) ________ refers to a quality emphasis that encompasses the entire organization, from supplier to customer.
64) When a process is out of control, ________ variations exist in the process.
65) ________ are graphs that show upper and lower limits for the process we want to control.
66) When a process is in control, only ________ variations exist in the process.
67) ________ introduced control charts in 1924.
68) The U.S. government award for quality achievement is called the ________.
69) Natural variation of a production process that follows a normal distribution is characterized by two
parameters: ________ and ________.
70) A(n) ________ chart is appropriate to monitor the weight of chocolate candy bars.
71) Technically, to achieve Six Sigma quality, there would have to be fewer than ________ defects per million
opportunities.
72) If we wish to monitor the average diameter of the hula hoops we are producing, the distribution we base our
statistics on is the ________ distribution.
73) A(n) ________ chart is appropriate to monitor the percent defective of a production process.
74) A(n) ________ chart is appropriate to monitor the number of needle sticks incurred inadvertently by nurses
who are administering medications.
75) A(n) ________ chart is appropriate to monitor the percent of mortalities due to heart problems.
76) The chart one might use to monitor the number of defects per roll of carpet is a ________.
77) If we wish to monitor the number of defects on a page in a printing process, the distribution we base our
statistics on is the ________ distribution.
Match the following.
A) Graphical presentation of process data
B) Range of variables
C) Count of attributes
D) Average of variables
E) Fraction of attributes
78) R-chart
79) p-chart
80) chart
81) c-chart
82) Control chart
Match the following.
A) Control limits for an chart
B) Upper control limit for a range chart
C) Control limits for a c-chart
D) Lower control limit for a range chart
E) Control limits for a p-chart
83) ± 3
84) D4
85) ± A2
86) ± z σp
87) D3


