Quantitative Analysis for Management, 11e (Render)
Chapter 15 Markov Analysis
1) Markov analysis is a technique that deals with the probabilities of future occurrences by analyzing currently
known probabilities.
2) In the matrix of transition probabilities, Pij is the conditional probability of being in state i in the future, given
the current state j.
3) The probabilities in any column of the matrix of transition probabilities will always sum to one.
4) The vector of state probabilities for any period is equal to the vector of state probabilities for the preceding
period multiplied by the matrix of transition probabilities.
5) An equilibrium condition exists if the state probabilities for a future period are the same as the state
probabilities for a previous period.
6) Equilibrium state probabilities may be estimated by using Markov analysis for a large number of periods.
7) Creating the fundamental matrix requires a partition of the matrix of transition.
8) When absorbing states exist, the fundamental matrix is used to compute equilibrium conditions.

APPLICATION
9) For any absorbing state, the probability that a state will remain unchanged in the future is one.
10) The four basic assumptions of Markov analysis are:
1. There are a limited or finite number of possible states.
2. The probability of changing states remains the same over time.
3. A future state is predictable from previous state and transition matrix.
4. The size and makeup of the system are constant during analysis.
11) In Markov analysis, states must be collectively exhaustive and mutually exclusive.
12) (n+1) = nP
13) In Markov analysis, the row elements of the transition matrix must sum to 1.
14) “Events” are used to identify all possible conditions of a process or a system.
15) Once a Markov process is in equilibrium, it stays in equilibrium.
16) In Markov analysis, initial–state probability values determine equilibrium conditions.
17) Markov analysis assumes that there are a limited number of states in the system.

18) Markov analysis assumes that while a member of one state may move to a different state over time, the
overall makeup of the system will remain the same.
19) The vector of state probabilities gives the probability of being in particular states at a particular point in time.
20) The matrix of transition probabilities gives the conditional probabilities of moving from one state to another.
21) Collectively exhaustive means that a system can be in only one state at any point in time.
22) A Markov process could be used as a model of how a disease progresses from one set of symptoms to another.
23) One of the problems with using the Markov model to study population shifts is that we must assume that the
reasons for moving from one state to another remain the same over time.
24) Markov analysis is a technique that deals with the probabilities of future occurrences by
A) using the simplex solution method.
B) analyzing currently known probabilities.
C) statistical sampling.
D) the minimal spanning tree.
E) None of the above

25) Markov analysis might be effectively used for
A) market share analysis.
B) university enrollment predictions.
C) machine breakdowns.
D) bad debt prediction.
E) All of the above
26) Which of the following is not an assumption of Markov processes?
A) The state variable is discrete.
B) There are a limited number of possible states.
C) The probability of changing states remains the same over time.
D) We can predict any future state from the previous state and the matrix of transition probabilities.
E) The size and the makeup of the system do not change during the analysis.
27) In Markov analysis, we also assume that the sates are
A) collectively exhaustive.
B) mutually exclusive.
C) independent.
D) A and B
E) A, B, and C
28) The probability that we will be in a future state, given a current or existing state, is called
A) state probability.
B) prior probability.
C) steady state probability.
D) joint probability.
E) transition probability.
29) A state probability when equilibrium has been reached is called
A) state probability.
B) prior probability.
C) steady state probability.
D) joint probability.
E) transition probability.
30) In Markov analysis, the likelihood that any system will change from one period to the next is revealed by the
A) cross–elasticities.
B) fundamental matrix.
C) matrix of transition probabilities.
D) vector of state probabilities.
E) state of technology.
31) Occasionally, a state is entered that will not allow going to any other state in the future. This is called
A) status quo.
B) stability dependency.
C) market saturation.
D) incidental mobility.
E) an absorbing state.
32) A collection of all state probabilities for a given system at any given period of time is called the
A) transition probabilities.
B) vector of state probabilities.
C) fundamental matrix.
D) equilibrium condition.
E) None of the above
33) In a matrix of transition probabilities (where i equals the row number and j equals the column number),
A) each number represents the conditional probability of being in state j in the next period given that it is
currently in the state of i.
B) each number represents the probability that if something is in state i, it will go to state j in the next period.
C) the number in row 3, column 3 represents the probability that something will remain in state 3 from one
period to the next.
D) the probabilities are usually determined empirically.
E) All of the above
34) In a matrix of transition probabilities,
A) the probabilities for any column will sum to 1.
B) the probabilities for any row will sum to 1.
C) the probabilities for any column are mutually exclusive and collectively exhaustive.
D) All of the above
E) None of the above
35) In Markov analysis, to find the vector of state probabilities for any period,
A) one should find them empirically.
B) subtract the product of the numbers on the primary diagonal from the product of the numbers on the
secondary diagonal.
C) find the product of the vector of state probabilities for the preceding period and the matrix of transition
probabilities.
D) find the product of the vectors of state probabilities for the two preceding periods.
E) take the inverse of the fundamental matrix.
36) In the long run, in Markov analysis,
A) all state probabilities will eventually become zeros or ones.
B) generally, the vector of state probabilities, when multiplied by the matrix of transition probabilities, will yield
the same vector of state probabilities.
C) the matrix of transition probabilities will change to an equilibrium state.
D) All of the above
E) None of the above
37) To find the equilibrium state in Markov analysis,
A) it is necessary to know both the vector of state probabilities and the matrix of transition probabilities.
B) it is necessary only to know the matrix of transition probabilities.
C) it is necessary only to know the vector of state probabilities for the initial period.
D) one should develop a table of state probabilities over time and then determine the equilibrium conditions
empirically.
E) None of the above
38) A state that when entered, cannot be left is called
A) transient.
B) recurrent.
C) absorbing.
D) steady.
E) None of the above
39) In a(n) ________ state, you cannot go to another state in the future.
A) transition
B) equilibrium
C) prison
D) locked
E) absorbing
40) In Markov analysis, the fundamental matrix
A) is necessary to find the equilibrium condition when there are absorbing states.
B) can be found but requires, in part, partitioning of the matrix of transition probabilities.
C) is equal to the inverse of the I minus B matrix.
D) is multiplied by the A matrix in order to find the probabilities that amounts in non–absorbing states will end
up in absorbing states.
E) All of the above
41) If we want to use Markov analysis to study market shares for competitive businesses,
A) it is an inappropriate study.
B) simply replace the probabilities with market shares.
C) it can only accommodate one new business each period.
D) only constant changes in the matrix of transition probabilities can be handled in the simple model.
E) None of the above
42) Where P is the matrix of transition probabilities, π(4) =
A) π(3) P P P.
B) π(3) P P.
C) π(2) P P P.
D) π(1) P P P.
E) None of the above
43) At equilibrium,
A) state probabilities for the next period equal the state probabilities for this period.
B) the state probabilities are all equal to each other.
C) the matrix of transition probabilities is symmetrical.
D) the vector of state probabilities is symmetrical.
E) the fundamental matrix is the same as the matrix of transition probabilities.
44) What do we do when solving for equilibrium conditions?
A) conduct a statistical t–test
B) drop one equation
C) partition the matrix of transition probabilities
D) subtract matrix B from the identity matrix
E) multiply the fundamental matrix by the A matrix
45) If in an absorbing state, the probability of being in an absorbing state in the future is ________.
A) 0%
B) 25%
C) 50%
D) 75%
E) 100%
46) The copy machine in an office is very unreliable. If it was working yesterday, there is an 80% chance it will
work today. If it was not working yesterday, there is a 10% chance it will work today. If it is working today,
what is the probability that it will be working 2 days from now?
A) 0.16
B) 0.64
C) 0.66
D) 0.80
E) None of the above
47) The copy machine in an office is very unreliable. If it was working yesterday, there is an 80% chance it will
work today. If it was not working yesterday, there is a 10% chance it will work today. If it is not working today,
what is the probability that it will be working 2 days from now?
A) 0.16
B) 0.17
C) 0.34
D) 0.66
E) None of the above
Table 15–1
The following data consists of a matrix of transition probabilities (P) of three competing companies, and the initial
market share π(0). Assume that each state represents a company (Company 1, Company 2, Company 3,
respectively) and the transition probabilities represent changes from one month to the next.
P = π(0) = (0.3, 0.6, 0.1)
48) Using the data in Table 15–1, determine Company 1’s estimated market share in the next period.
A) 0.10
B) 0.20
C) 0.42
D) 0.47
E) None of the above
49) Using the data in Table 15–1, determine Company 2’s estimated market share in the next period.
A) 0.26
B) 0.27
C) 0.28
D) 0.29
E) None of the above
50) Using the data in Table 15–1, and assuming that the transition probabilities do not change, in the long run
what market share would Company 2 expect to reach? (Rounded to two decimal places.)
A) 0.30
B) 0.32
C) 0.39
D) 0.60
E) None of the above
51) The weather is becoming important to you since you would like to go on a picnic today. If it was sunny
yesterday, there is a 70% chance it will be sunny today. If it was raining yesterday, there is a 30% chance it will be
sunny today. What is the probability it will be rainy today, if it was sunny yesterday?
A) 0.1
B) 0.2
C) 0.7
D) 0.8
E) 0.3
52) The initial values for the state probabilities ________.
A) are always greater than the equilibrium state probabilities
B) are always less than the equilibrium state probabilities
C) do not influence the equilibrium state probabilities
D) heavily influence the equilibrium state probabilities
E) None of the above
53) The matrix that is needed to compute equilibrium conditions when absorbing states are involved is called a(n)
A) transition matrix.
B) fundamental matrix.
C) identity matrix.
D) equilibrium matrix.
E) absorbing matrix.
54) The weather is becoming important to you since you would like to go on a picnic today. If it was sunny
yesterday, there is a 70% chance it will be sunny today. If it was raining yesterday, there is a 30% chance it will be
sunny today. If the probability that it was raining yesterday is 0.25, what is the probability that it will rain today?
A) 0.1
B) 0.3
C) 0.4
D) 0.7
E) None of the above
55) The weather is becoming important to you since you would like to go on a picnic today. If it was sunny
yesterday, there is a 65% chance it will be sunny today. If it was raining yesterday, there is a 30% chance it will be
sunny today. If the probability that it was raining yesterday is 0.4, what is the probability that it will be sunny
today?
A) 0.650
B) 0.390
C) 0.510
D) 0.490
E) None of the above

Table 15–2
The following data consists of a matrix of transition probabilities (P) of three competing retailers, the initial
market share π(0). Assume that each state represents a retailer (Retailer 1, Retailer 2, Retailer 3, respectively) and
the transition probabilities represent changes from one month to the next.
P = π(0) = (0.3, 0.6, 0.1)
56) Using the data given in Table 15–2, find the market shares for the three retailers in month 1.
A) π(1) = (0.09, 0.42, 0.49)
B) π(1) = (0.55, 0.33, 0.12)
C) π(1) = (0.18, 0.12, 0.70)
D) π(1) = (0.55, 0.12, 0.33)
E) π(1) = (0.33, 0.33, 0.33)
57) Using the data given in Table 15–2, find the market shares for the three retailers in month 2.
A) π(2) = (0.30, 0.60, 0.10)
B) π(2) = (0.55, 0.33, 0.12)
C) π(2) = (0.44, 0.43, 0.12
D) π(2) = (0.55, 0.12, 0.33)
E) π(2) = (0.47, 0.40, 0.13)
58) Using the data given in Table 15–2, what is the equilibrium market share?
A) (0.30, 0.60, 0.10)
B) (0.55, 0.33, 0.12)
C) (0.44, 0.43, 0.11)
D) (0.55, 0.12, 0.33)
E) (0.47, 0.40, 0.13)

Table 15–3
Cuthbert Wylinghauser is a scheduler of transportation for the state of Delirium. This state contains three cities:
Chaos (C1), Frenzy (C2), and Tremor (C3). A transition matrix, indicating the probability that a resident in one
city will travel to another, is given below. Cuthbert’s job is to schedule the required number of seats, one to each
person making the trip (transition), on a daily basis.
C F T
Transition matrix: π(0) = [100, 100, 100]
59) Using the data given in Table 15–3, how many seats should Cuthbert schedule for travel from Chaos to Tremor
for tomorrow?
A) 80
B) 70
C) 20
D) 60
E) None of the above
60) Using the data given in Table 15–3, how many people can we expect to find in each city tomorrow evening?
A) Chaos = 90, Frenzy = 110, Tremor = 100
B) Chaos = 110, Frenzy = 100, Tremor = 90
C) Chaos = 80, Frenzy = 90, Tremor = 130
D) Chaos = 100, Frenzy = 130, Tremor = 70
E) None of the above
61) Using the data given in Table 15–3, find the equilibrium travel population for Frenzy (rounded to the nearest
whole person).
A) 126
B) 95
C) 79
D) 100
E) None of the above
62) Using the data given in Table 15–3, what is the equilibrium travel population of Chaos (rounded to the nearest
whole person)?
A) 79
B) 95
C) 126
D) 100
E) None of the above
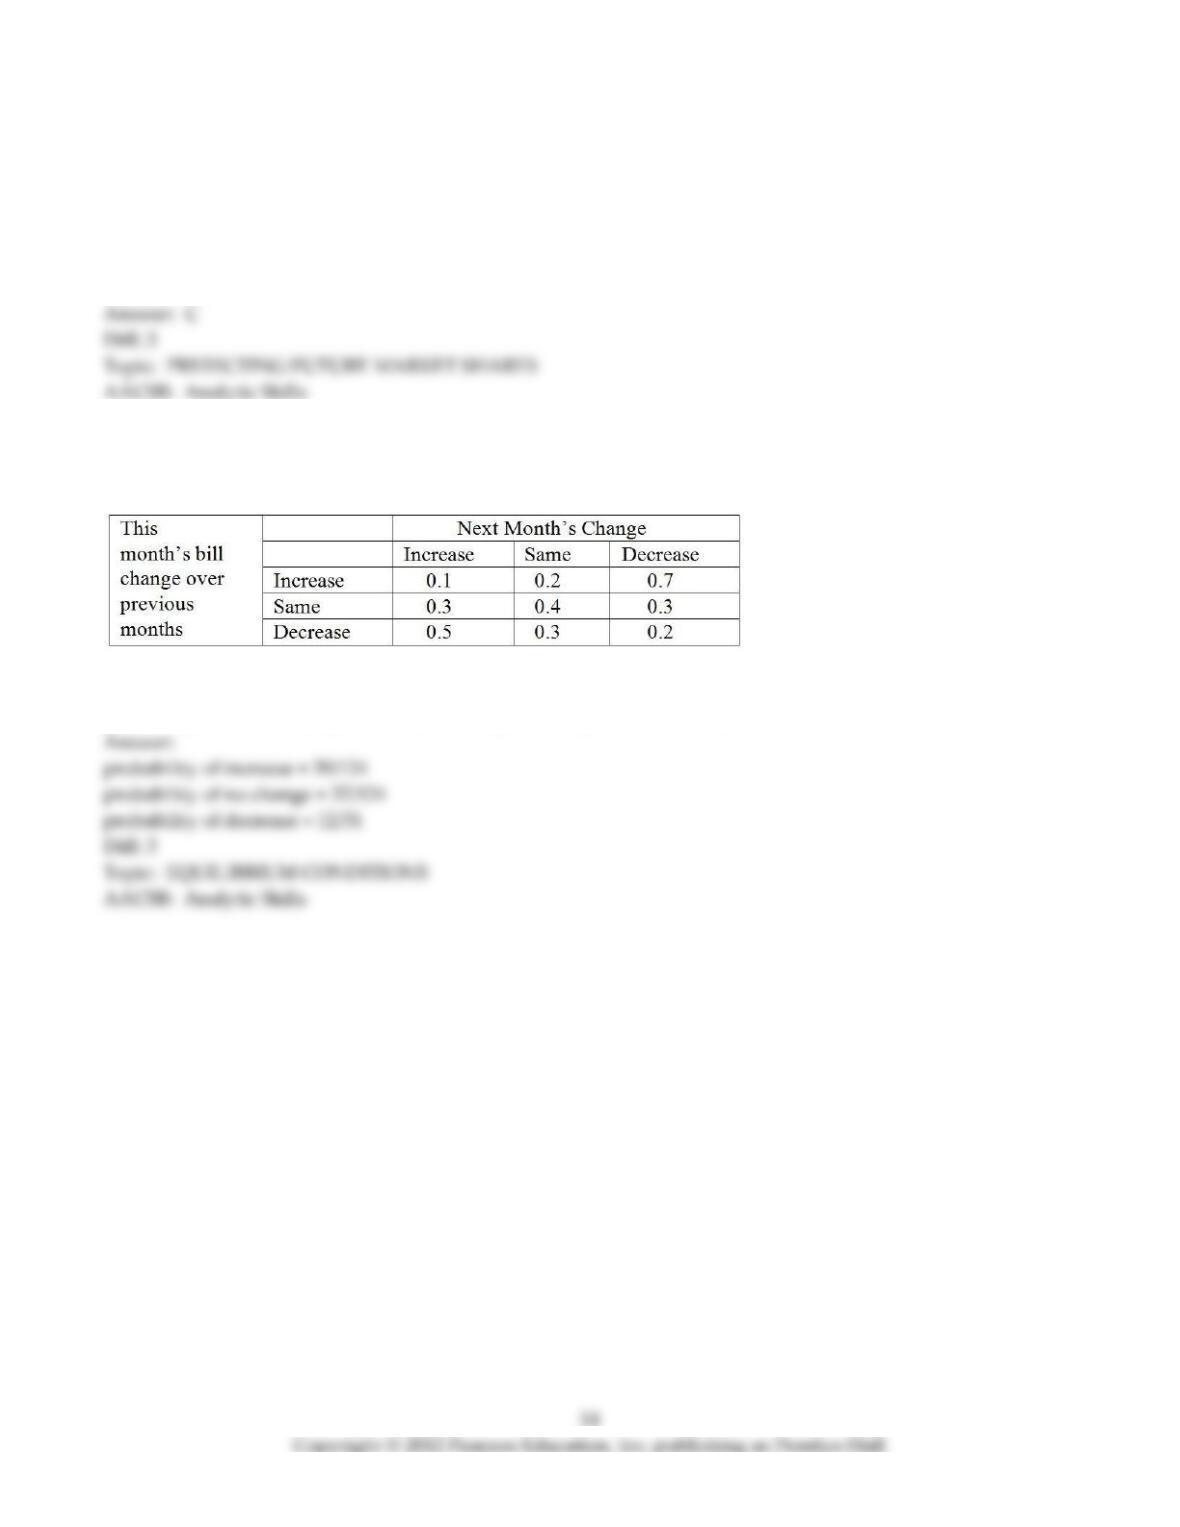
63) A certain utility firm has noticed that a residential customer‘s bill for one month is dependent on the previous
month’s bill. The observations are summarized in the following transition matrix.
The utility company would like to know the long–run probability that a customer’s bill will increase, the
probability the bill will stay the same, and the probability the bill will decrease.
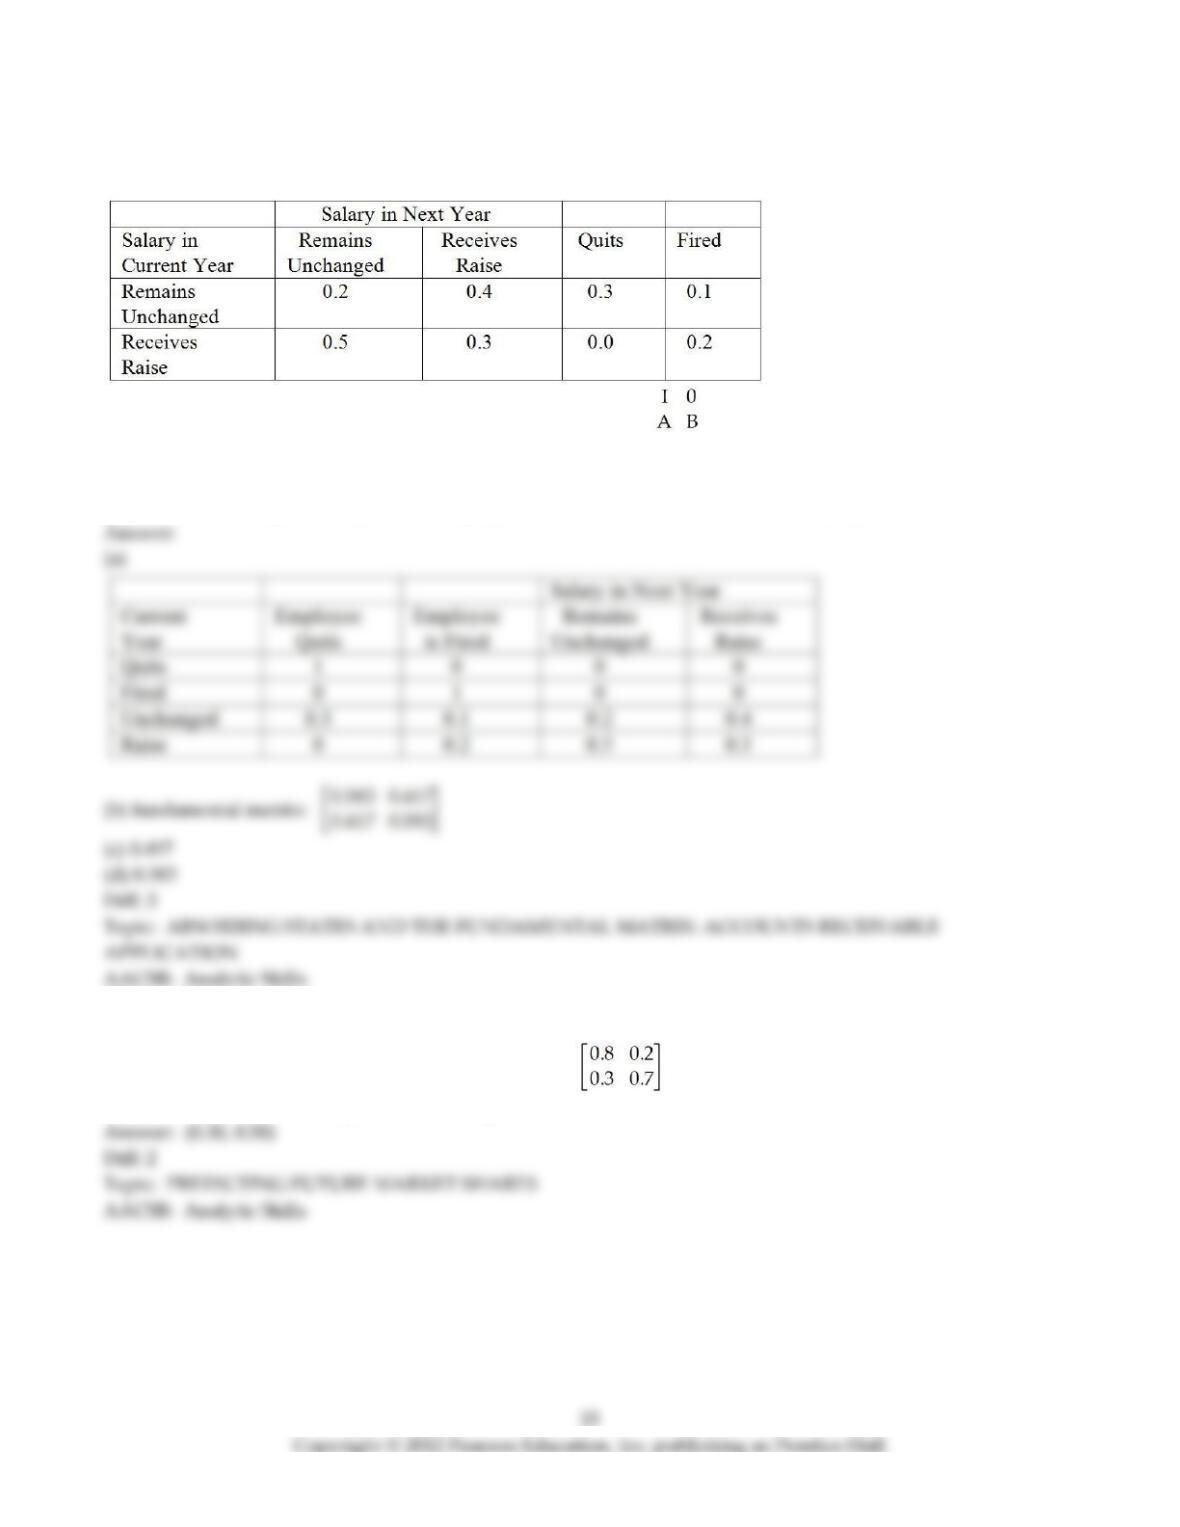
64) A certain firm has noticed that employees’ salaries from year to year can be modeled by Markov analysis. The
matrix of transition probabilities follows.
(a) Set up the matrix of transition probabilities in the form:
(b) Determine the fundamental matrix for this problem.
(c) What is the probability that an employee who has received a raise will eventually quit?
(d) What is the probability that an employee who has received a raise will eventually be fired?
65) The vector of state probabilities for period n is (0.4, 0.6).
The accompanying matrix of transition probabilities is:
Calculate the vector of state probabilities for period n+1.

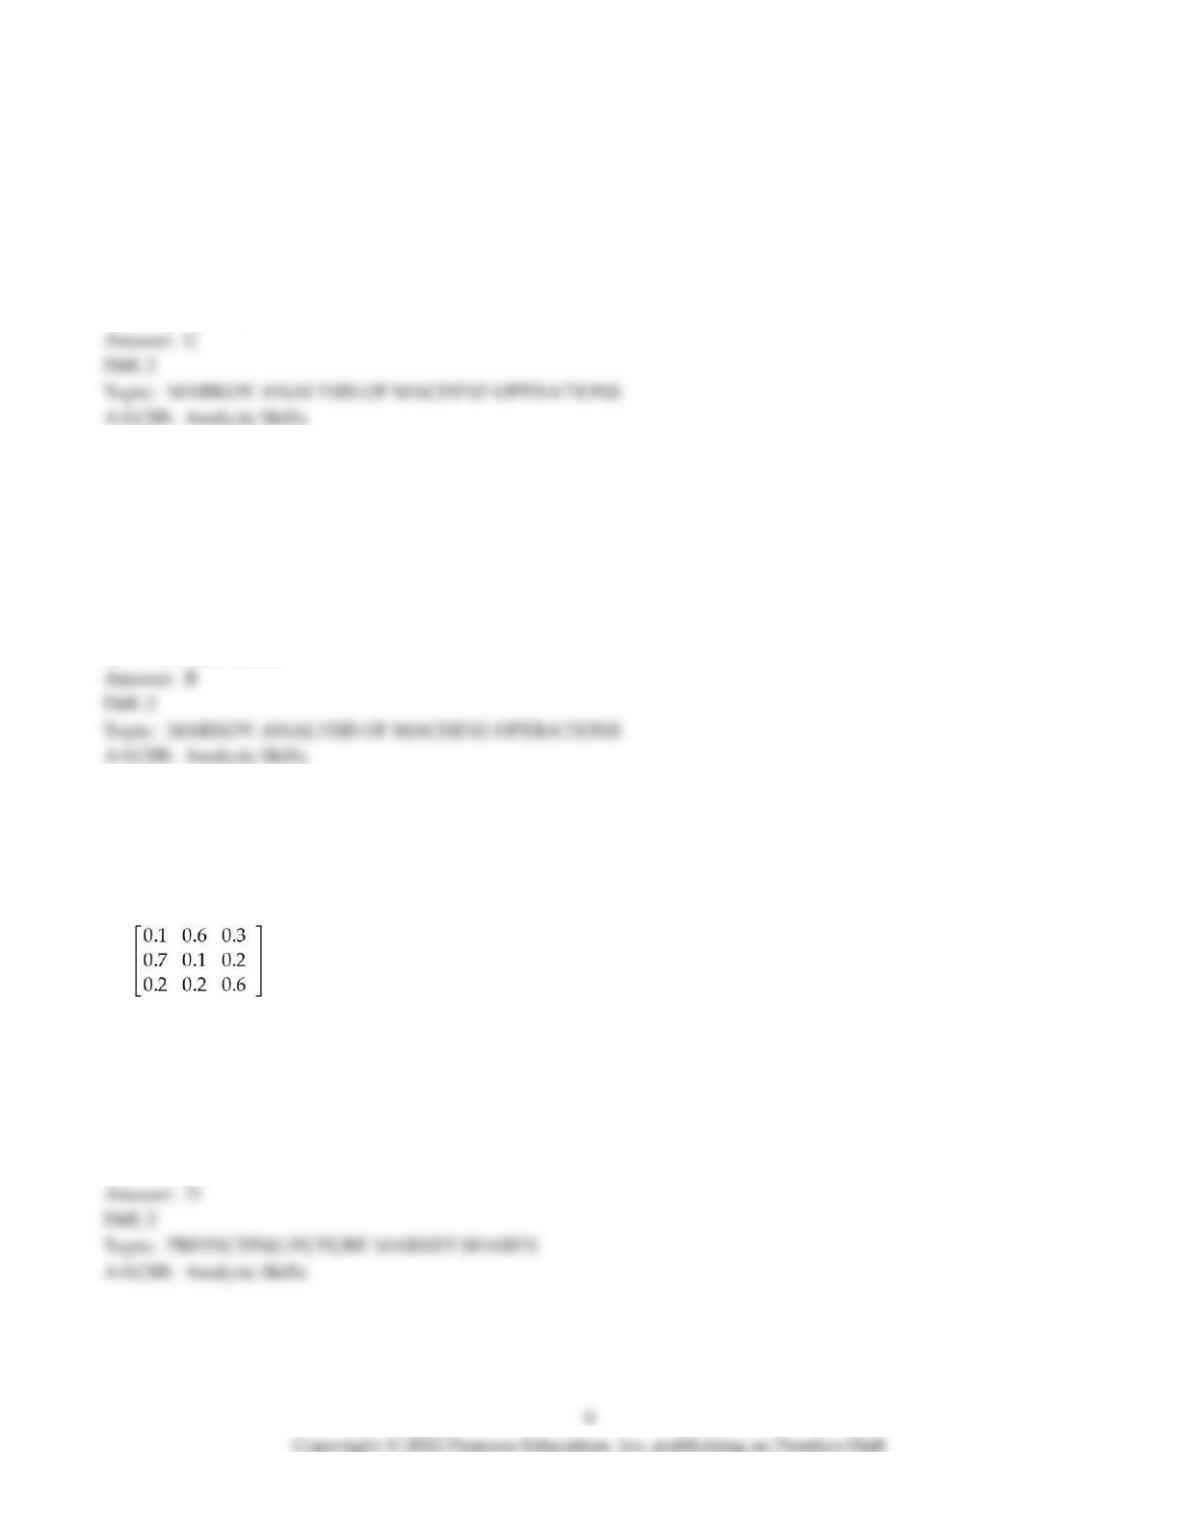
66) Given the following matrix of transition probabilities, find the equilibrium states.
67) Given the following vector of state probabilities and the accompanying matrix of transition probabilities, find
the next period vector of state probabilities.
(0.4 0.4 0.2)
68) There is a 30% chance that any current client of company A will switch to company B this year. There is a 40%
chance that any client of company B will switch to company A this year. If these probabilities are stable over the
years, and if company A has 500 clients and company B has 300 clients,
(a) how many clients will each company have next year?
(b) how many clients will each company have in two years?
69) Over any given month, Hammond Market loses 10% of its customers to Otro Plaza and 20% to Tres Place.
Otro Plaza loses 5% to Hammond and 10% to Tres Place. Tres Place loses 5% of its customers to each of the two
competitors. At the present time, Hammond Market has 40% of the market, while the others have 30% each.
(a) Next month, what will the market shares be for the three firms?
(b) In two months, what will the market shares be for the three firms?

70) The fax machine in an office is very unreliable. If it was working yesterday, there is an 90% chance it will
work today. If it was not working yesterday, there is a 5% chance it will work today.
(a) What is the probability that it is not working today, if it was not working yesterday?
(b) If it was working yesterday, what is the probability that it is working today?
71) There is a 30% chance that any current client of company A will switch to company B this year. There is a 20%
chance that any client of company B will switch to company A this year. If these probabilities are stable over the
years, and if company A has 1000 clients and company B has 1000 clients, in the long run (assuming the
probabilities do not change), what will the market shares be?
72) There is a 60% chance that customer without a smart phone will buy one this year. There is a 95% chance that
a customer with a smart phone will continue with a smart phone going into the next year. If 30% of target market
currently own smart phones, what proportion of the target market is expected to own a smart phone next year?
73) There is a 60% chance that customer without a smart phone will buy one this year. There is a 95% chance that
a customer with a smart phone will continue with a smart phone going into the next year. If 30% of target market
currently own smart phones, what is the long run percentage of the target market that will own smart phones?
74) Three fast food hamburger restaurants are competing for the college lunch crowd. Burger Bills has 40% of the
market while Hungry Heifer and Salty Sams each have 30% of the market. Burger Bills loses 10 % of its
customers to Hungry Heifer and 10% to Salty Sams each month. Hungry Heifer loses 5% of its customers to
Burger Bills and 10% to Salty Sams each month. Salty Sams loses 10% of its customers to Burger Bills while 20%
go to Hungry Heifer. What will the market shares be for the three businesses next month?
75) A firm currently has a 20% market share for its product, lint pickers. It has identified 2 plans to improve its
market share. The transition matrices for both plans are listed below. Plan 1 costs $1 million and Plan 2 costs $1.5
million. The company’s goal is to determine what its demand will be in the long–term.
Plan 1: 20% Share 40% Share 60% Share
20 Share 0.25 0.40 0.35
40 Share 0.20 0.35 0.45
60 Share 0.10 0.50 0.40
Plan 2: 20% Share 40% Share 60% Share
20 Share 0.30 0.30 0.40
40 Share 0.10 0.50 0.40
60 Share 0.20 0.30 0.50
A single percentage point of market share translates into an annual demand of 1,000 units per year. Also, each
percentage point of market share means $100,000 of profit for the firm. Choose the plan that maximizes the firm’s
net income.
76) Describe the concept of “collectively exhaustive” in the context of Markov analysis.
77) Describe the concept of “mutually exclusive” in the context of Markov analysis.
78) Describe the situation of the existence of an equilibrium condition in a Markov analysis.
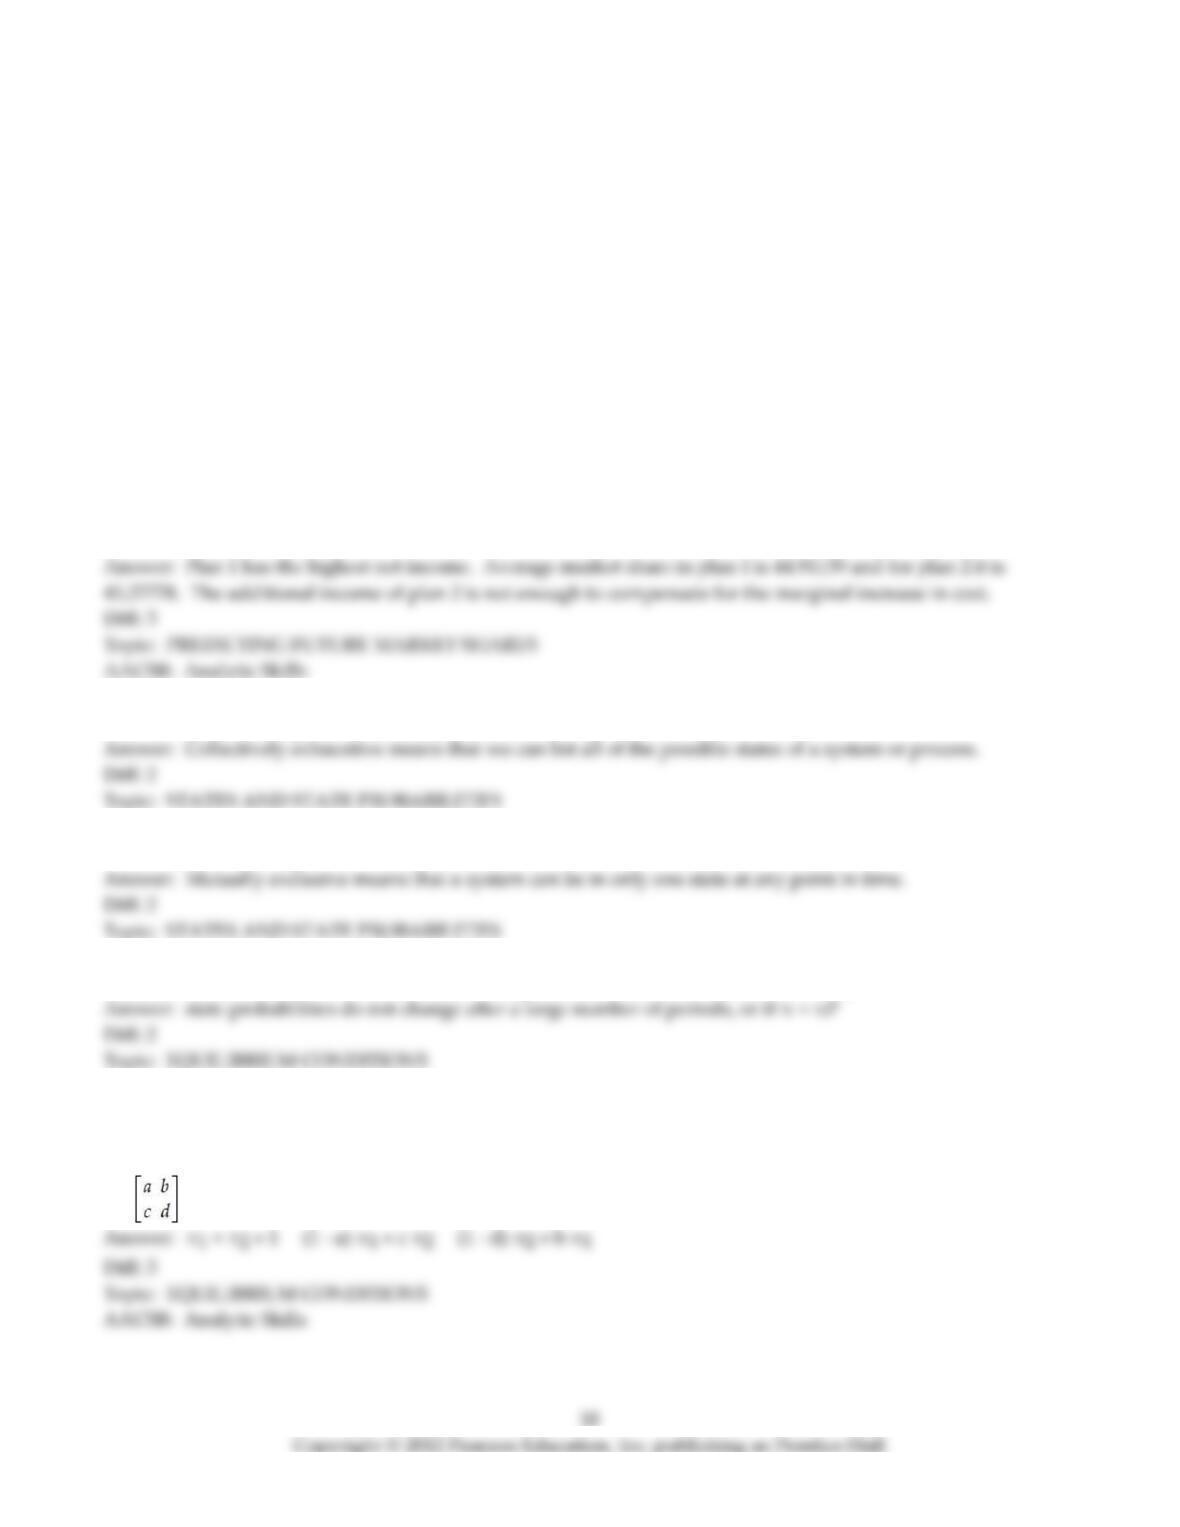
79) Given the following matrix of transition probabilities, write three equations that, when solved, will give the
equilibrium state values.
P =