CHAPTER 11
QUALITY MANAGEMENT MODELS
TRUE/FALSE QUESTIONS
1. Fishbone diagrams are potentially as effective in analyzing
service quality as they are in analyzing product quality.
2. The flow in a process flow diagram is functional rather than
3. In process control, if there are multiple production lines or
machines, those from which the samples are to be drawn, are to be
4. In process control, sample ranges may be used to approximate
5. In establishing control limits for an R control chart, the
6. Control limits for the mean are symmetrical around
X
, and
control limits for the range around
R
are also symmetrical.
7. When testing sample observations the values (
X
and R) of the
observations are relevant, but their sequence is not.
8. The standard techniques used in attribute quality control may
9. Deming and some other experts contend that multiple sourcing
impedes the interests of quality because multiple sourcing creates
an adversarial relationship between supplier and customer.
10. Deming’s points discourage inspection for quality control.
11. Fishbone diagrams do not include a category for “software.”
12. Six Sigma refers to plus or minus three standard deviations.
13. Both Deming’s 14 points and the Six Sigma concept promote risk
14. Walter Shewhart, the developer of control charts, believed
15. According to the central limit theorem, sample values follow a
MULTIPLE CHOICE QUESTIONS
1. Multiple (vendor) sourcing typically does not provide:
a. closer supplier/customer relations.
b. downward price pressure.
c. less chance for supply disruption.
d. a heavier quality assurance “burden” for the customer.
2. A fishbone diagram for sources of quality is:
a. applicable to products but not services.
b. chronological, as opposed to functional.
c. diagnostic, not descriptive.
d. a cause-and-effect representation.
3. Process variation, the measurable change in the output of a
process:
a. is always subject to elimination.
b. is not management’s responsibility.
c. may be uncontrollable.
d. generates output of unacceptable quality.
4. Process flow diagrams:
a. are chronological, as opposed to functional.
b. were first developed by K. Ishikawa.
c. generate quality control limits.
d. use PERT/CPM symbols.
5. Control charts:
a. rely strictly on multi-item samples.
b. record sample means, ranges, or proportions.
c. deal with numerical measurements, not attributes.
d. help to evaluate products, not processes.
6. Sources of random error in monitoring a production process for
quality control purposes include:
a. miscalibration of measuring devices.
b. transposition of numbers in recording measurements.
c. not sampling from each of multiple production lines.
d. sampling at exactly the same time each hour.
7. The larger the sample size, the more the values of ___________
approach a normal distribution.
a. X
b.
X
c. R
d. σ
8. Over a twenty hour period forty samples of five items each
were collected. From this data, the values calculated for
X
and
R
were 120.10 and 45.75 respectively. Based on this data, the upper
control limit for the X bar control chart should be set at
approximately:
a. 120.10
b. 129.43
c. 146.49
d. 165.85
9. In establishing control limits for
X
charts:
a.
R
is used in the estimation of σ.
b. a two-standard deviation range is typical.
c. μ is the center line.
d. the range between limits is independent of sample size.
10. Before an
X
chart can be used properly, the production
process should be verified as being under control, as determined by
its:
a. central value.
b. variability.
c. distribution.
d. run length.
11. A sample value above the upper control limit (UCL) or below
the lower control limit (LCL) calls for:
a. process shutdown.
b. an immediate second sample.
c. additional tests.
d. further investigation.
12. Concerning the construction and use of R control charts:
a.
R
is the centerline.
b. The control range is symmetrical.
c. Positive results are deemed conclusive.
d. Required sample size is different from
X
control
charts.
13. Additional tests, beyond observing sample data points falling
within the specified control limits, are available. None of these
additional tests evaluate:
a. consecutive values on the same side of the centerline.
b. consecutive increasing or decreasing values.
c. consecutive oscillating values.
d. consecutive constant values.
14. For
X
charts, a set of eight tests can be used to signify
that a process is out of control. “Out of control” is indicated if:
a. all eight tests are positive.
b. only one of eight is positive.
c. more than half the tests are positive.
d. half or more tests are “borderline.”
15. Which of the following is not a reason to prefer single-item
sampling to multi-item sampling?
a. Attributes, not measurements, are being evaluated.
b. Items sampled are necessarily destroyed.
c. Process output is known to be relatively homogeneous.
d. The cost of sampling each item is extremely high.
16. The probability distribution forming the basis for attribute
sampling is the ________distribution.
a. multinomial
b. binomial
c. normal
d. t
17. Of the costs relating to quality, probably the most difficult
to measure is:
a. production cost.

b. sampling cost.
c. scrap & rework cost.
d. customer satisfaction cost.
18. The quadratic loss function assumes that any deviation from
the ideal measurement for product conformance results in a potential
loss to:
a. the environment.
b. society
c. the producer.
d. the consumer.
19. If a process is to be sampled once each hour, the precise time
within the hour:
a. should be the same each hour of operation.
b. should change with shift changes.
c. should be determined randomly.
d. should be incremented on a constant basis.
20. Quality management:
a. applies to products more than services.
b. works for measurements, not attributes.
c. always requires random sampling.
d. may suggest 100% inspection.
SHORT ANSWER QUESTIONS
1. Why are there eight tests for control for
X
charts but only
four for R charts?
2. The Deming Prize is awarded to Japanese firms demonstrating
significant quality improvements. For whom is it named?
3. How does the advertising slogan “Quality is Job 1” compare to
Deming’s 14 points?
4. Which two groups can control process variation?
5. Two Rivers Paper Company measures the dampness of the paper
rolling off the mill once every minute. If the average of 60
measurements is within specifications, can we say the process is in
control?
6. Consider the following R chart.
8 AM 5 PM
As floor manger, you claim the process is in control. Your boss
asks about the 8:00 AM and 5:00 PM data points. What is your
response?
X
7. Quality testing at Jefferson Carpets is expensive but not
destructive. You recommend a sample size of 4. Why?
8. A full day’s quality control tests (24 points) all fall within
one standard deviation of the process mean. Why might you deem the
process to be “out of control”?
9. For the initial control charts, the mean and standard
deviation were estimated from specifications. After the first
results, how would you modify the mean and standard deviation for
the
X
X
and R charts?
10. Under what conditions can control test 7 (8 consecutive points
outside plus or minus one standard deviation) be applied to the X
and Rm control charts for single item sampling?
FORMULATION/SOLUTION/ANALYSIS QUESTIONS
1. Despite extensive quality control efforts, the Model Q
sparkplug production line produces plugs with an average defect rate
of 4%. Sparkplugs cost $.80 each to produce and the warranty cost
for each defective item shipped is estimated to be $2.50.
Management is considering the installation of a testing device for
identifying defective sparkplugs. The unit will correctly select
99% of the defective plugs but, unfortunately, will also incorrectly
show as defective 5% of the non-defective plugs. Any plug labeled
as defective will be discarded. Testing will cost $.025 per
sparkplug.
Should the firm install the testing unit?
2. Ten successive samples of 15 items each displayed the
following number of defectives:
Sample # of Defectives Sample # of Defectives
1 2 6 2
2 1 7 0
3 0 8 3
4 0 9 1
5 0 10 0
A. Determine the upper and lower control limits for a p chart for
this process.
B. The numbers of defectives in the next six samples of 15 items
are: 0, 1, 2, 2, 3, and 4. Would you conclude that the process is
out of control?
3. Fifteen random samples of size four yield the following
statistics:
Sample
X
R Sample
X
R Sample
X
R
1 331 8 6 333 4 11 332 6
2 333 5 7 332 13 12 335 7
3 335 8 8 331 5 13 330 7
4 337 7 9 334 6 14 330 5
5 336 9 10 332 9 15 334 6
For these data, determine the upper and lower control limits for the
X
and R charts.
4. Suppose that samples are selected every day from the assembly
line at Ropak and tested for quality. Over the past ten days, the
following data was determined:
Day Number Sampled Number Defective
1 50 2
2 78 4
3 120 3
4 160 6
5 254 10
6 65 3
7 180 7
8 84 4
9 72 2
10 66 3
Determine the standardized z-score value for the sample taken in day
3.
5. Suppose a manufacturer of canned corn randomly selects five
cans of corn each hour and counts the number of kernels in these
cans in order to assess quality. For the first thirty hours the
average number of kernels in the 150 cans tested was 245.26. The
average range for the thirty samples was 12.45. On the basis of this
data:
A. Determine the upper and lower control limits for the X-bar
B. Determine the upper and lower control limits for the R chart.
X
X
6. Suppose an X-bar chart has a centerline of 10.0 and upper and
lower control limits of 16.0 and 4.0 respectively. The sample mean
values over the next eight periods are 10.2, 9.3, 11.4, 11.8, 12.7,
14.2, 13.8, and 15.2. Would you conclude that the process is in
control during this time frame? If not, which period(s) indicate an
out of control process, and which tests are violated?
7. Every hour the quality control department at Herald Ski
company takes a ski at random from the production line and measures
the pressure at which it breaks. For the past twelve days the
pressure at which the ski has broken has been as follows:
Day Pressure Day Pressure Day Pressure
1 125 5 132 9 129
2 120 6 118 10 135
3 143 7 145 11 127
4 115 8 132 12 141
Herald uses a three period moving range to construct its X control
chart. Determine the upper and lower control limits for the X chart
based on this data.
8. What entries would you put into a fishbone diagram for Ross’
Gardening Service?
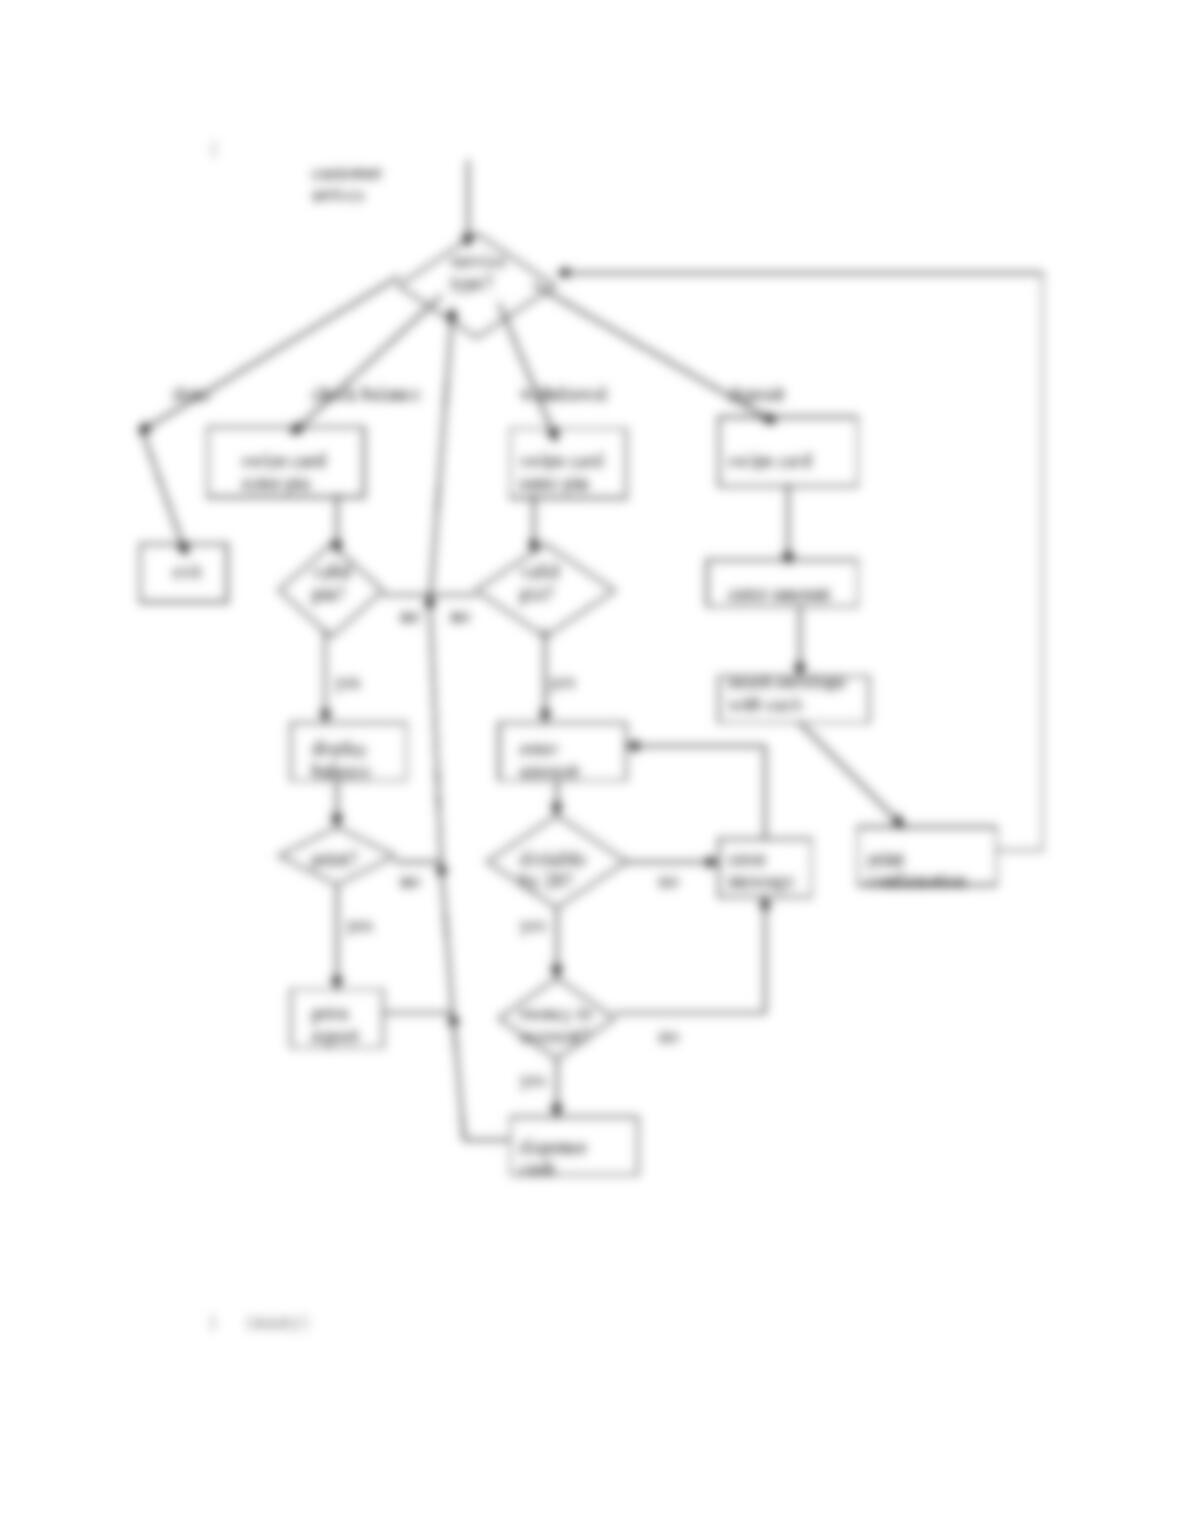
9. Create a process flow diagram for ATM use.
10. A bowling alley checks the timing of the ball returns daily
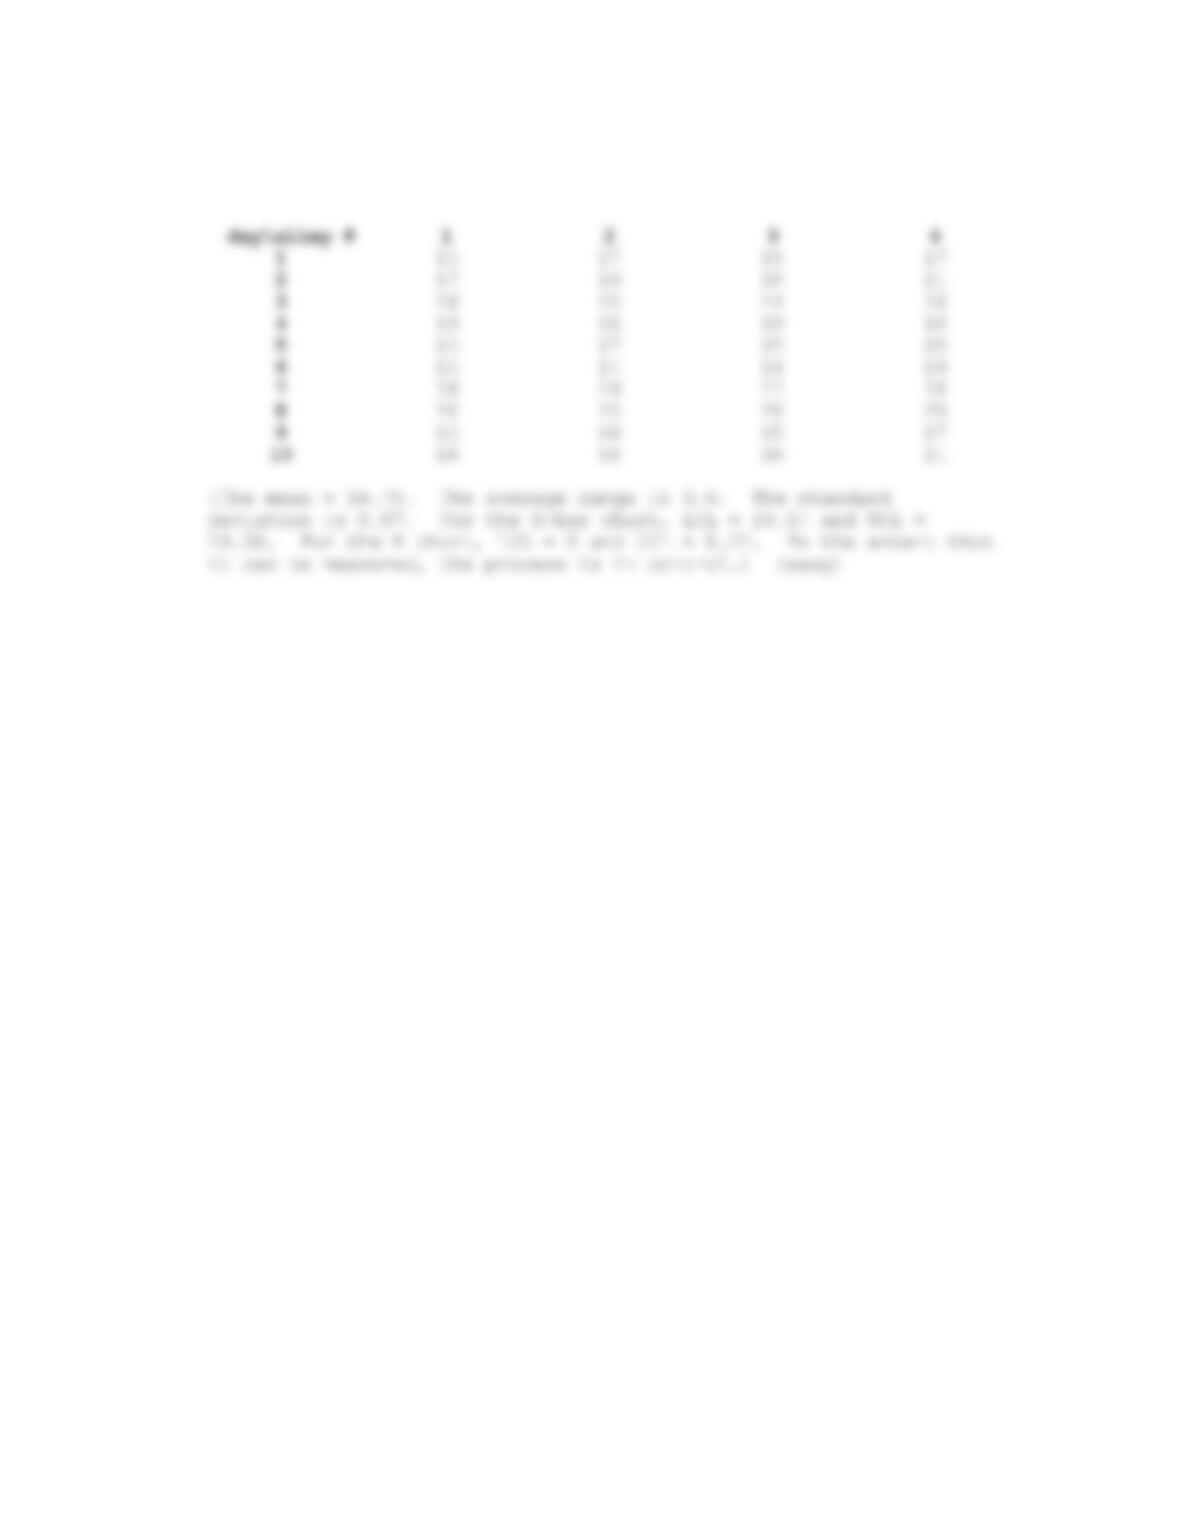
for four lanes. The times are given in seconds. Create X-bar and R
charts. Is the process in control?