47) The first step in setting up a fishbone diagram is to determine the independent and dependent
variables.
48) Control charts are used to determine whether a process will produce a product or service with
consistent measurable properties.
49) The cause-and-effect diagram is used to move to higher levels of abstraction in solving
problems.
50) The cause-and-effect diagram is also called a tree diagram.
51) Pareto charts are used to identify and prioritize problems to be solved.
52) Control charts are frequency charts that are aided by the 80/20 rule.
53) When using Pareto analysis, a frequency chart is constructed showing the number of
occurrences in ascending order.
54) The “ribs” of the fish on the fishbone diagram represent the problem while the “bones”
represent the causes.
55) What are Ishikawa’s seven basic tools of quality and how should they be used together?
56) Define check sheets and describe the steps involved in setting up a check sheet.
57) Define histograms and state the rules for developing histograms.
58) Define a scatter diagram and describe the steps involved in setting up a scatter plot.
59) What are cause-and-effect diagrams?
60) Describe the function of a Pareto chart. How does the 80/20 rule apply?
61) Which of the following is one of the new seven tools for management?
A) process map
B) cause-and-effect diagram
C) histogram
D) check sheet
E) affinity diagram
62) A(n) ________ is a tool that helps a group converge on a set number of themes or ideas that
can be addressed later.
A) tree diagram
B) affinity diagram
C) prioritization grid
D) matrix diagram
E) interrelationship digraph
63) The first step in completing a(n) ________ is to construct an affinity diagram to identify the
issues relating to a problem.
A) interrelationship digraph
B) matrix diagram
C) tree diagram
D) prioritization grid
E) activity network diagram
64) A(n) ________ is useful to identify the steps needed to address the given problem.
A) tree diagram
B) prioritization grid
C) activity network diagram
D) interrelationship digraph
E) affinity diagram
65) A(n) ________ is very similar to a work breakdown structure used in planning projects.
A) matrix diagram
B) prioritization grid
C) interrelationship digraph
D) affinity diagram
E) tree diagram
66) The first step in completing a(n) ________ is to assemble the header cards from the affinity
diagram.
A) matrix diagram
B) tree diagram
C) prioritization grid
D) activity network diagram
E) interrelationship digraph
67) A(n) ________ is used to make decisions based on multiple criteria.
A) tree diagram
B) matrix diagram
C) interrelationship digraph
D) prioritization grid
E) affinity diagram
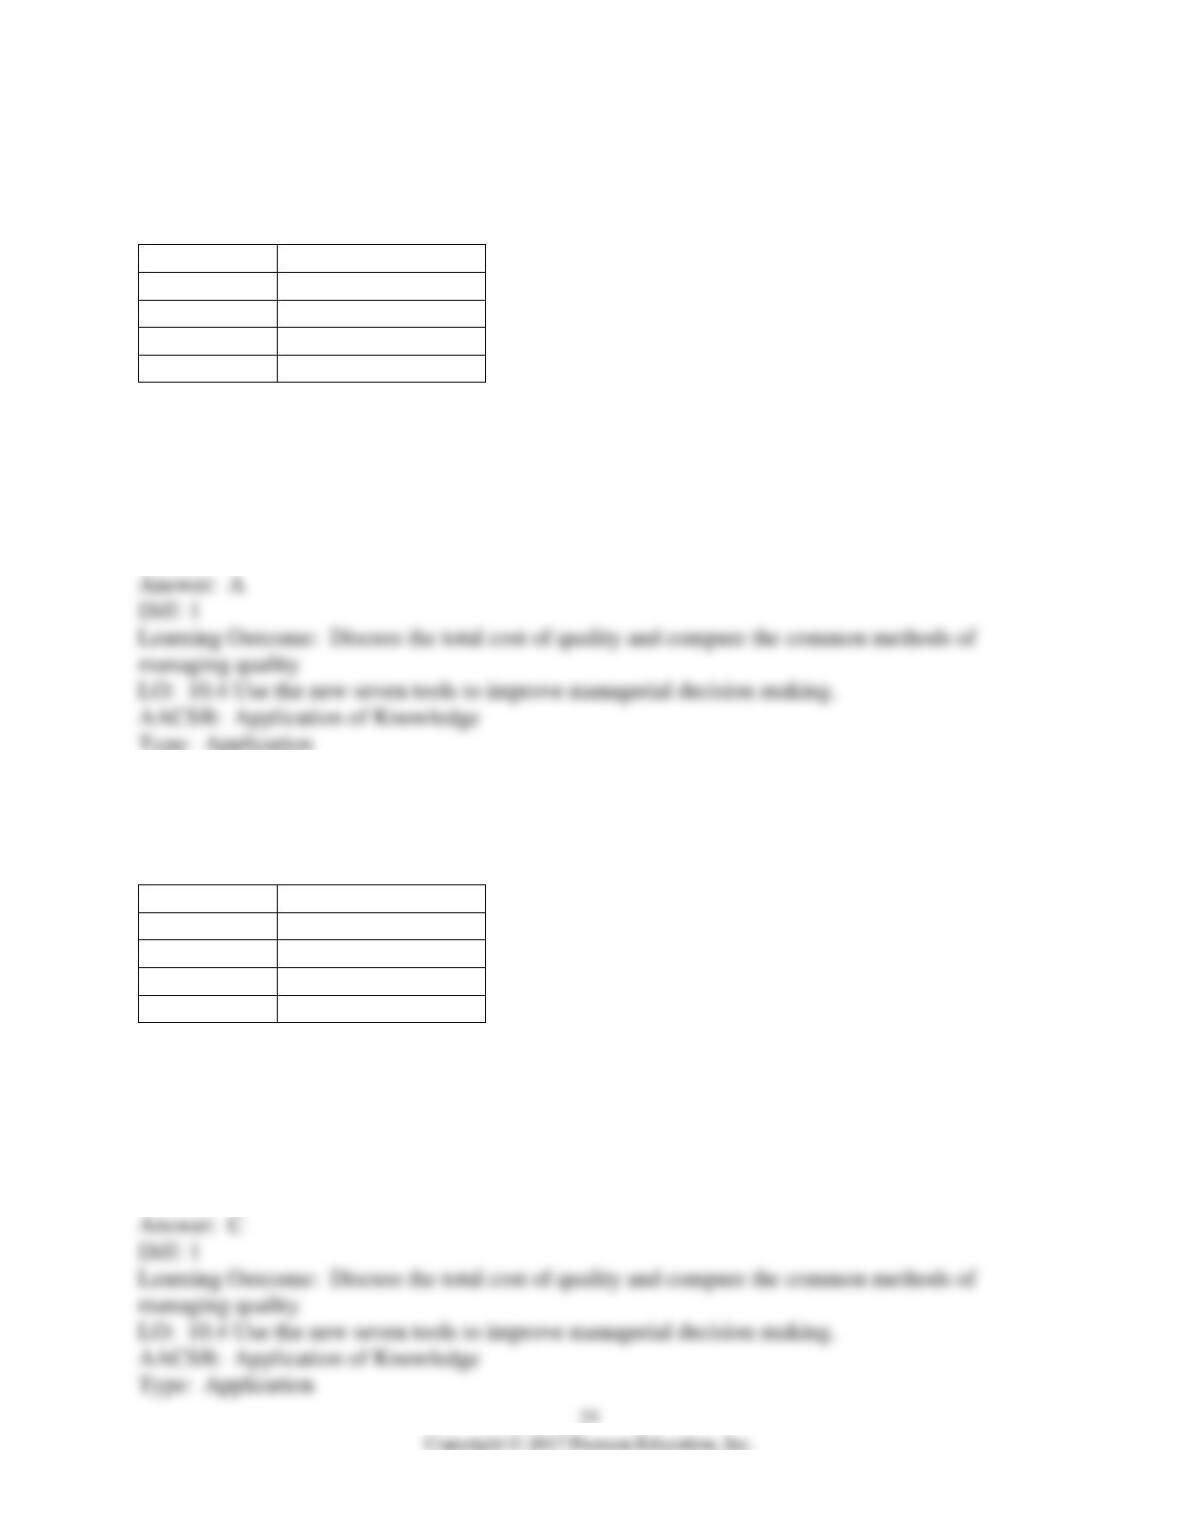
68) Cletus Inc. plans to overhaul the cafeteria menu and has formed a four-person team to
evaluate alternatives. The team identifies four criteria and their respective percentage weights as
shown in the table below:
Criteria
Percentage Weight
Price
0.30
Taste
0.40
Texture
0.20
Nutrition
What is the percentage weight for the Nutrition criterion?
A) 0.10
B) 0.30
C) 0.50
D) 0.70
E) 0.90
69) Cletus Inc. plans to overhaul the cafeteria menu and has formed a four-person team to
evaluate alternatives. The team identifies four criteria and their respective percentage weights as
shown in the table below:
Criteria
Percentage Weight
Price
Taste
0.43
Texture
0.21
Nutrition
0.27
What is the percentage weight for the Nutrition criterion?
A) 0.18
B) 0.91
C) 0.09
D) 0.57
E) 0.48
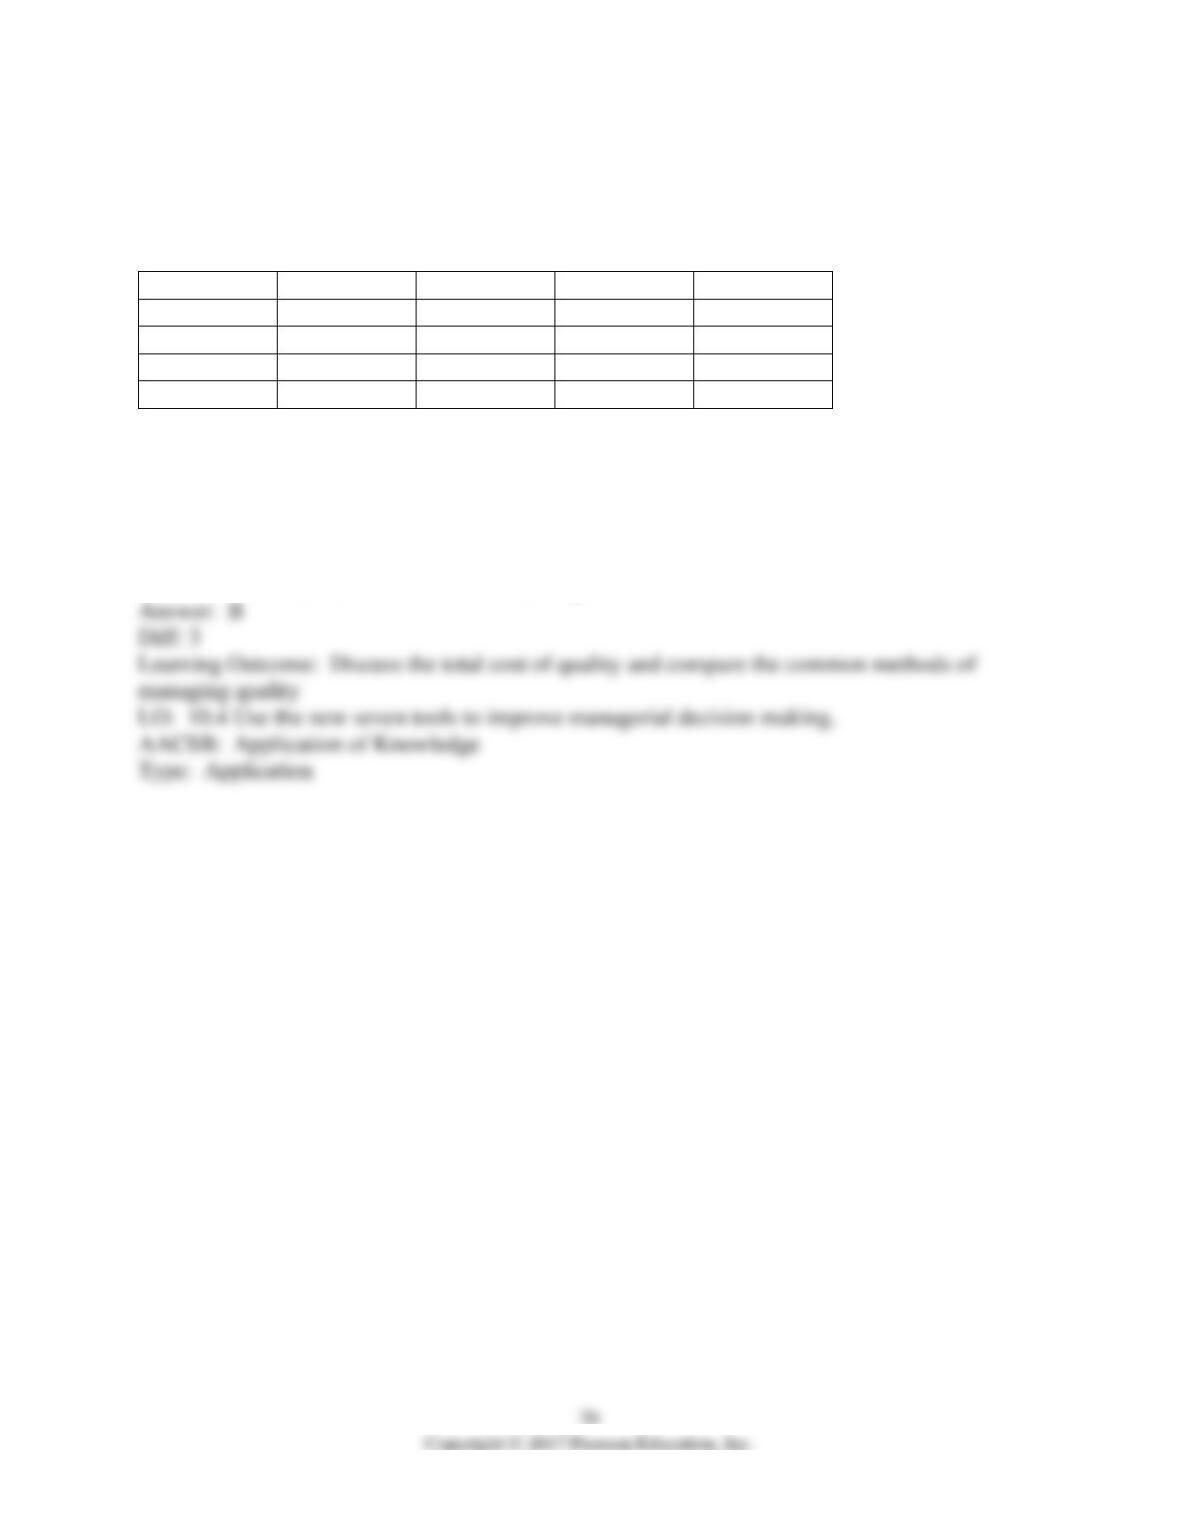
70) Cletus Inc. plans to overhaul the cafeteria menu and has formed a four-person team to
evaluate alternatives. The team identifies four criteria and has ranked the Price criteria as shown
in the table below:
Alternative
Person 1
Person 2
Person 3
Person 4
A
1
1
2
1
B
2
3
1
2
C
3
4
3
3
D
4
2
4
4
What is the final price ranking for alternative B?
A) first
B) second
C) third
D) fourth
E) cannot be determined from the information given
71) Cletus Inc. plans to overhaul the cafeteria menu and has formed a four-person team to
evaluate alternatives. The team identifies four criteria and has ranked the Price criteria as shown
in the table below:
Alternative
Person 1
Person 2
Person 3
Person 4
A
1
1
2
1
B
2
3
1
2
C
3
4
3
3
D
4
2
4
4
What is the final price ranking for alternative C?
A) first
B) second
C) third
D) fourth
E) cannot be determined from the information given
72) Cletus Inc. plans to overhaul the cafeteria menu and has formed a four-person team to
evaluate alternatives. The team identifies four criteria and their corresponding percentage
weights. Option A has ranks as shown in the table below:
Criteria
Percentage
Weight
Option A
Rank
Price
0.25
1
Taste
0.30
2
Texture
0.10
2
Nutrition
0.35
3
What is the importance score sum for option A?
A) 1.0
B) 2.1
C) 4.2
D) 8.0
E) 9.6
73) Cletus Inc. plans to overhaul the cafeteria menu and has formed a four-person team to
evaluate alternatives. The team identifies four criteria and their corresponding percentage
weights. Option C has ranks as shown in the table below:
Criteria
Percentage
Weight
Option C Rank
Price
0.20
3
Taste
0.15
2
Texture
0.20
2
Nutrition
0.45
3
What is the importance score sum for option C?
A) 1.35
B) 2.20
C) 2.65
D) 3.45
E) 4.80
74) The ________ is similar in concept to quality function deployment in its use of symbols, its
layout, and its application.
A) matrix diagram
B) tree diagram
C) prioritization grid
D) affinity diagram
E) activity network diagram
75) The ________ is also known as a PERT diagram or critical path diagram and is used in
controlling projects.
A) affinity diagram
B) tree diagram
C) activity network diagram
D) cause-and-effect diagram
E) matrix diagram
76) The Pareto chart is one of the new seven tools for management.
77) An activity network diagram helps a group converge on a set number of themes or ideas that
can be addressed later.
78) An affinity diagram creates a hierarchy of ideas on a large surface.
79) The first step to making a prioritization grid is to construct an affinity diagram to identify the
issues relating to a problem.
80) The tree diagram is useful to identify the steps needed to address a given problem.
81) A prioritization grid is used to make decisions based on a single criterion.
82) The matrix diagram is similar in concept to quality function deployment in its use of
symbols, its layout, and its application.
83) A control chart is a tool used to brainstorm possible contingencies or problems associated
with the implementation of some program or improvement.
84) The activity network diagram is also known as a PERT diagram or critical-path diagram and
is used in controlling projects.
85) The PDCA cycle, utilized with the seven new quality tools, stands for process-discovery-
conform-accept.
86) The final step in the process of making a prioritization grid is to apply percentage weights to
each of the criteria for each option.
87) Describe the function of an affinity diagram.
88) What is an interrelationship digraph and when should it be used?
89) Define a tree diagram and describe the steps used to complete a tree diagram.
90) What is a prioritization grid?
91) Define a matrix diagram. What are the steps involved in constructing a matrix diagram?
92) ________ are graphs that present multiple metrics simultaneously in a two-dimensional
plane.
A) Interrelationship digraphs
B) Spider charts
C) Tree diagrams
D) Activity network diagrams
E) Process decision program charts
93) ________ are usually spreadsheets that are communicated to management on a regular
basis—weekly, monthly, quarterly, and annually.
A) Matrix diagrams
B) Affinity diagrams
C) Process decision program charts
D) Balanced scorecards
E) Spider charts
94) A(n) ________ involves integrating financial measures of business success along with
nonfinancial, operational information about the business.
A) spider chart
B) balanced scorecard
C) affinity diagram
D) matrix diagram
E) process decision program chart
95) Process decision program charts are graphs that present multiple metrics simultaneously in a
two-dimensional plane.
96) The usefulness of the balanced scorecard comes from integrating financial measures of
business success along with nonfinancial, operational information about the business.
97) A dashboard quickly communicates performance levels by reflecting the metrics reported in
balanced scorecards.

36
98) State the importance of balanced scorecards in measuring performance.