CHAPTER 10—TECHNICAL ANALYSIS
TRUE/FALSE
1. Fundamentalists contend that past price movements will indicate future price movements.
2. Technical analysts believe that security prices do not adjust rapidly.
3. One of the potential disadvantages of technical analysis is that it can lead to investing too early, even
before fundamental analysts do.
4. The use of trading rules requires a great deal of subjective judgment.
5. Most technicians feel that since price patterns repeat themselves, a single trading rule is sufficient.
6. If technical trading rule is successful, more traders use it, causing the rule to become even more
successful.
7. For technical trading rules to consistently generate superior returns, the market would have to be
inefficient.
8. The majority of technicians follow many trading rules and attempt to arrive at a consensus among their
rules.
9. Two major classes of technicians include the contrarians and those who “follow the smart money”.
10. Contrary trading rules assert that investors tend to be wrong except at market peaks and troughs.
11. The confidence index increases as the yield on lower grade bonds decreases, everything else being
constant.

2
12. The T-Bill-Eurodollar yield spread widens during periods of international crisis.
13. An increase in debit balances in brokerage accounts is viewed by technicians as a bullish sign.
14. Technicians consider a high short interest ratio to be bearish.
15. The Dow theory contends that stock price movements are similar to the movement of tides, waves, and
ripples.
16. A resistance level is the price range at which the technician would expect an increase in the demand of
stock and a price reversal.
17. A high put/call ratio indicates a pervasive bearish attitude by sophisticated investors so it is a bearish
indicator.
18. The Confidence Index increases as the yield on lower grade bonds decreases, everything else being
constant.
19. An increase in debit balances means more investing by naive investors and would be a bearish
indicator.
20. If the aggregate market is rising, but the breadth index is declining, it is a bearish signal.
21. If the 50-day moving average line crosses the 200-day moving average line from below on good
volume, this would be a bullish signal.
22. The relative strength ratio for a stock can be computed by dividing the value of the S&P 500 stock
index by the price of a stock.

3
23. A rise in the Confidence Index published by Barron’s is an indication investors will purchase more
lower-quality bonds.
24. The breadth of the market measures the daily volume for a particular market.
25. A support level is the price range at which the technician would expect an increase in the supply of
stock and a price reversal.
26. Candlestick charts indicate the price change from open to close by shading whether the market went
down or up for the day.
MULTIPLE CHOICE
1. Technical analysis differs from fundamental analysis in that
a.
Technical analysts contend that in-depth assessments of basic aggregate market, industry,
and company performance is necessary; past price movements indicate future price
movements.
b.
Technical analysts believe the market value of common stocks is determined by the
interaction of supply and demand.
c.
Technical analysts argue that the market constantly weighs rational and irrational factors
and that both of these affect price.
d.
Technical analysts depend far more heavily on objective, data-based approaches than the
fundamentalists do.
e.
Technical analysts hold that the price of a security is determined by an expected return
risk.
2. Which of the following is not considered an assumption of technical analysis?
a.
Market value is determined solely by supply and demand.
b.
Supply and demand are governed by both rational and irrational factors.
c.
Security prices tend to move in trends that persist for an appreciable length of time.
d.
Stock prices follow a random walk.
e.
Changes in trend are caused by the shifts in supply and demand relationships.

4
3. For technical trading rules to generate returns that are superior to a buy-and-hold strategy, net of
transaction costs, the market would have to be
a.
Rising.
b.
Falling.
c.
Inefficient.
d.
Overvalued.
e.
Undervalued.
4. Technical analysts feel that financial accounting statements lack information, or report it in a way that
makes comparisons difficult. Which of the following does not constitute a problem?
a.
Detailed information concerning sales and expenses by product line.
b.
Statements of change in financial position.
c.
Alternative ways of reporting expenses.
d.
Alternative ways of reporting assets and liabilities.
e.
The availability of psychological and nonquantitative variables.
5. All of the following are classified as contrary trading rules, except:
a.
Odd lot short sales.
b.
Investment advisory opinions.
c.
Relative OTC volume.
d.
Montreal Exchange put/call ratio.
e.
Confidence index.
6. According to contrary opinion technicians, the ratio of mutual funds cash to total assets ____ near
troughs in the market cycle and ____ near peaks.
a.
Level out, spikes
b.
Remains low, remains high
c.
Is published near, is not published
d.
Increases, decreases
e.
Decreases, increases
7. What would analysts following what the smart, sophisticated investor is doing examine?
a.
Mutual fund cash positions.
b.
Debit balances in brokerage houses.
c.
Investment advisory opinions.
d.
Breadth of market.
e.
Stocks above their 200 day moving average.

5
8. What are the indicators that tell what smart investors are doing?
a.
The put/call ratio.
b.
Mutual fund cash position.
c.
The Dow theory.
d.
Short sales by specialists.
e.
Head and tail indicator.
9. The confidence index published by Barron’s is the ratio of the average yield on 10 top grade corporate
bonds to the
a.
Average yield on 30 blue chip corporate stocks.
b.
Average yield on 40 convertible corporate bonds.
c.
Yield on Treasury bills.
d.
Yield on intermediate-grade bonds.
e.
Yield on the Scotia Capital Bond Universe Index
10. What is the cumulative number of shares that have been sold short by investors and not covered
called?
a.
Margin interest.
b.
Short interest.
c.
Short ratio.
d.
Short/long ratio.
e.
Naked short ratio.
11. The short interest ratio is the ratio between the number of shares sold short and not covered, and the
a.
Average number of stocks reaching new highs.
b.
Average daily number of stocks that increased in value.
c.
Average daily volume of trading on the exchange.
d.
Average monthly volume of trading on the exchange.
e.
Average number of shares outstanding in those stocks.
12. Technicians believe that an industry or stock that is outperforming the market will tend to
a.
Continue to outperform the market.
b.
Return to normal.
c.
Reverse trend.
d.
Meet a resistance level.
e.
Form head and shoulder patterns.

6
13. The ratio of the price of a stock or an industry group to the value of the market index is called the
a.
Company to market ratio.
b.
Composite stock ratio.
c.
Relational proportion ratio.
d.
Stock to market ratio.
e.
Relative strength ratio.
14. ____ charts show time series of price while ____ charts only reflect change regardless of time.
a.
Relative strength, bar
b.
Relative strength, advance/decline
c.
Point and bar, figure
d.
Bar, point and figure
e.
Bar, multiple indicator
15. What is a type of charting which normally disregards both time and volume?
a.
Bar chart.
b.
Point and figure chart.
c.
Pie chart.
d.
Histogram.
e.
Linear regression graph.
16. What is the price range at which technicians would expect a substantial increase in the demand for a
stock called?
a.
Demand threshold.
b.
Resistance level.
c.
Support level.
d.
Resistance limit.
e.
Technical restraint.
17. What is the price range at which technicians feel that a significant increase in the price of the stock
will be resisted referred to as?
a.
Supply threshold.
b.
Support level.
c.
Short interest level.
d.
Advancement level.
e.
Resistance level.

7
18. Advances and declines are associated with market
a.
Efficiency.
b.
Position.
c.
Diffusion.
d.
Depth.
e.
Breadth.
19. In examining the properties of world market currencies or the spreads between currencies, an analyst is
most likely to use time series properties to determine all the following, except
a.
Volatility.
b.
Overbought condition.
c.
Resistance-support levels.
d.
Trend.
e.
An oversold condition.
20. Technicians believe, when the relative strength index is stable or ____, during a ____ market, the stock
should do well during a ____ market.
a.
Decreases, bull, bear.
b.
Increases, bear, bull.
c.
Decreases, bear, bull.
d.
Increases, bull, bear.
e.
None of the above.
21. When the 50-day moving average crosses the 200-day moving average from ____ on ____ volume,
this would be a ____ signal.
a.
Above, low, bullish.
b.
below, high, bearish.
c.
below, low, bullish.
d.
above, high, bullish.
e.
below, high, bullish.
22. When ____ of stocks are trading above the 200-day moving average, the market is considered ____,
and subject to a ____.
a.
20%, oversold, negative correction
b.
80%, overbought, negative correction
c.
80%, oversold, positive correction
d.
20%, overbought, positive correction
e.
10%, overbought, positive correction

8
23. A divergence between an increase in a stock market series and the rest of the stock market can be
detected using
a.
Debit balances in brokerage accounts
b.
Short interest
c.
The advance-decline line
d.
Confidence index
e.
None of the above.
24. A narrowing of the T-bill-Eurodollar and __________ signal, because ___________.
a.
Bearish, it signals falling investor confidence
b.
Bullish, it signal rising investor confidence
c.
Bearish, it signals a flight to quality
d.
Bullish, it signals a flight to quality
e.
None of the above.
25. What might a technical analyst consider as a bearish signal(s)?
a.
Investment advisory opinion is bearish
b.
Investment advisory opinion is bullish
c.
CBOE put-call ratio above 0.60
d.
CBOE put-call ratio below 0.40
e.
Choices b and d
26. How might a technical analyst use credit balances in brokerage accounts?
a.
Sell stock when credit balances rise
b.
Buy stock when credit balances rise
c.
Sell stock when credit balances decline
d.
Choices b and c.
e.
None of the above.
27. A technical analyst might use mutual fund cash positions as follows
a.
Sell stock when cash levels are low
b.
Buy stock when cash levels are low
c.
Sell stock when cash levels are high
d.
Buy stock when cash levels are high
e.
Choices c and d.

9
28. The ratio of OTC volume versus TSX volume a measure of ______. This ratio typically ______ at a
market ______.
a.
Speculative activity, bottoms, peak.
b.
Hedging activity, Bottoms, peak.
c.
Speculative activity, peaks, peak
d.
Speculative activity, bottoms, bottoms.
e.
None of the above.
29. What might a technical analyst consider a bearish signal?
a.
The percentage of speculators in stock index futures exceeds 70%.
b.
The percentage of speculators in stock index futures exceeds 30%.
c.
The percentage of speculators in stock index futures falls to 30%.
d.
The percentage of speculators in stock index futures remains flat.
e.
None of the above.
30. To technician that believed in the importance of volume, a bullish signal would occur when
a.
Prices increase on light volume.
b.
Prices decrease on light volume.
c.
Prices increase on heavy volume.
d.
Prices decrease on heavy volume.
e.
None of the above.
31. Which of the following is not a technical trading rule category?
a.
Contrary-opinion rules
b.
Follow the smart money rules
c.
Anti-fundamental and anti-portfolio approaches
d.
Stock price and volume techniques
e.
Other market environment indicators
32. Which of the following is not considered a contrary trading rules?
a.
Futures traders bullish on stock index futures
b.
Investment advisory opinions
c.
Credit balance in brokerage accounts
d.
Montreal Exchange put/call ratio
e.
Confidence index

10
33. According to technical analysts using mutual fund cash positions to guide investment decisions
a.
A low cash ratio position is a bullish indicator.
b.
A high cash position is a bullish indicator.
c.
A high cash position is a bearish indicator.
d.
A low cash position is neither bearish nor bullish.
e.
None of the above.
34. Technicians using the confidence index published by Barrons to make investment decisions
a.
Believe the ratio is a bullish indicator because during periods of high confidence investors
will invest in higher quality bonds.
b.
Believe the ratio is a bearish indicator because during periods of high confidence investors
will invest in higher quality bonds.
c.
Believe the ration is a bearish indicator because during periods of high confidence
investors will invest in lower quality bonds.
d.
Believe the ration is a bullish indicator because during periods of high confidence
investors will invest in lower quality bonds.
e.
None of the above.
35. When the 50-day moving average crosses the 200-day moving average from below on good volume
a.
This would be a bearish indicator because it signals a change to a negative trend.
b.
This would be a bullish indicator because it signals a change to a negative trend.
c.
This would be a bullish indicator because it signals a change to a positive trend.
d.
This would be a bearish indicator because it signals a change to a positive trend.
e.
None of the above.
36. The Dow Theory describes stock prices as moving in trends analogous to the movement of water.
Which of the following statements is not true?
a.
Major trends resemble tides.
b.
Intermediate trends resemble waves.
c.
Short-run movements are like ripples.
d.
Waves are the most important.
e.
None of the above (that is, all are true statements)
37. Which of the following statements is true?
a.
At a support level, the technician would expect an increase in the demand for a stock.
b.
At a resistance level, the technician would expect any price increase to reverse abruptly.
c.
At a resistance level, the technician would expect an increase in the demand for a stock.
d.
Choices a and b.
e.
All of the above.

11
38. A resistance level differs from a support level in that
a.
at a resistance level most investors would hold stock until the price improves; at a support
level a stock becomes overvalued and investor interest is likely to decrease.
b.
at a resistance level the analyst would expect a substantial increase in the demand for a
stock; at a support level the analyst would expect a substantial decrease in the demand for
a stock.
c.
at a resistance level most investors would sell a stock; at a support level most investors
would be willing to purchase a stock.
d.
Choices a and b.
e.
None of the above.
39. Which of the following assumptions regarding price movements summarized by Levy (1966) are
controversial?
a.
Supply and demand determine the market value of any good or service.
b.
Supply and demand are governed by numerous rational and irrational factors.
c.
The prices for individual securities and the overall value of the market tend to move in
trends.
d.
All of the above.
e.
None of the above.
40. Which of the following is not an advantage of technical analysis identified by technicians?
a.
Fundamental analysis depends heavily on financial accounting statements.
b.
The majority of investors can not consistently process new information correctly.
c.
Fundamental analysis may not time the investment properly when trading under- or over-
valued securities.
d.
The majority of investors cannot process new information quickly enough.
e.
All of the above are advantages identified by technicians.
41. According to Dow theory, a major market
a.
Advance has few price fluctuations indicate a new upward trend.
b.
Advance does not go straight up, because some investors will take profits.
c.
Decline is easier to predict than an advance.
d.
Decline typically has a higher level of volume than a major market advance.
e.
Choices a and d.
42. The relative strength index for a stock is equal to the price of the stock
a.
Divided by the value of a stock-market index.
b.
Multiplied by the value of a stock-market index.
c.
Divided by the value of a group of industry stocks.
d.
Multiplied by an industry peer group and divided by a market index.
e.
Divided by the 30 day moving average of prior stock movements.

12
43. A chart used to show only significant price changes, regardless of their timing, is the
a.
Candlestick chart
b.
Multiple indicator chart
c.
Bar chart
d.
Point-and-figure chart
e.
Point-and-click chart
44. The market is considered to be overbought and subject to a negative correction when more than
a.
60% of the stocks are selling above their 90 day average.
b.
70% of the stocks are selling above their 100 day average.
c.
80% of the stocks are selling above their 200 day average.
d.
700% of the stocks are selling above their 150 day average.
e.
90% of the stocks are selling above their 150 day average.
45. Based on the daily closings for the S&P/TSX Composite Index given in the table below, calculate a
four-day moving average for Day 4.
Day
Price
1
10500
2
10025
3
10125
4
10210
a.
10,500
b.
10,210
c.
10,215
d.
10,000
e.
11,000
46. Given the following three days of data, compute the daily net advance-decline line and cumulative
advance-decline line for each day. What is the final value at the end of the third day?
Day
Issues
Traded
Advances
Declines
Unchanged
1
8540
6500
1500
540
2
7535
5500
1230
805
3
6545
4554
1324
667
a.
5,000
b.
9,270
c.
12,500
d.
13,250
e.
11,667
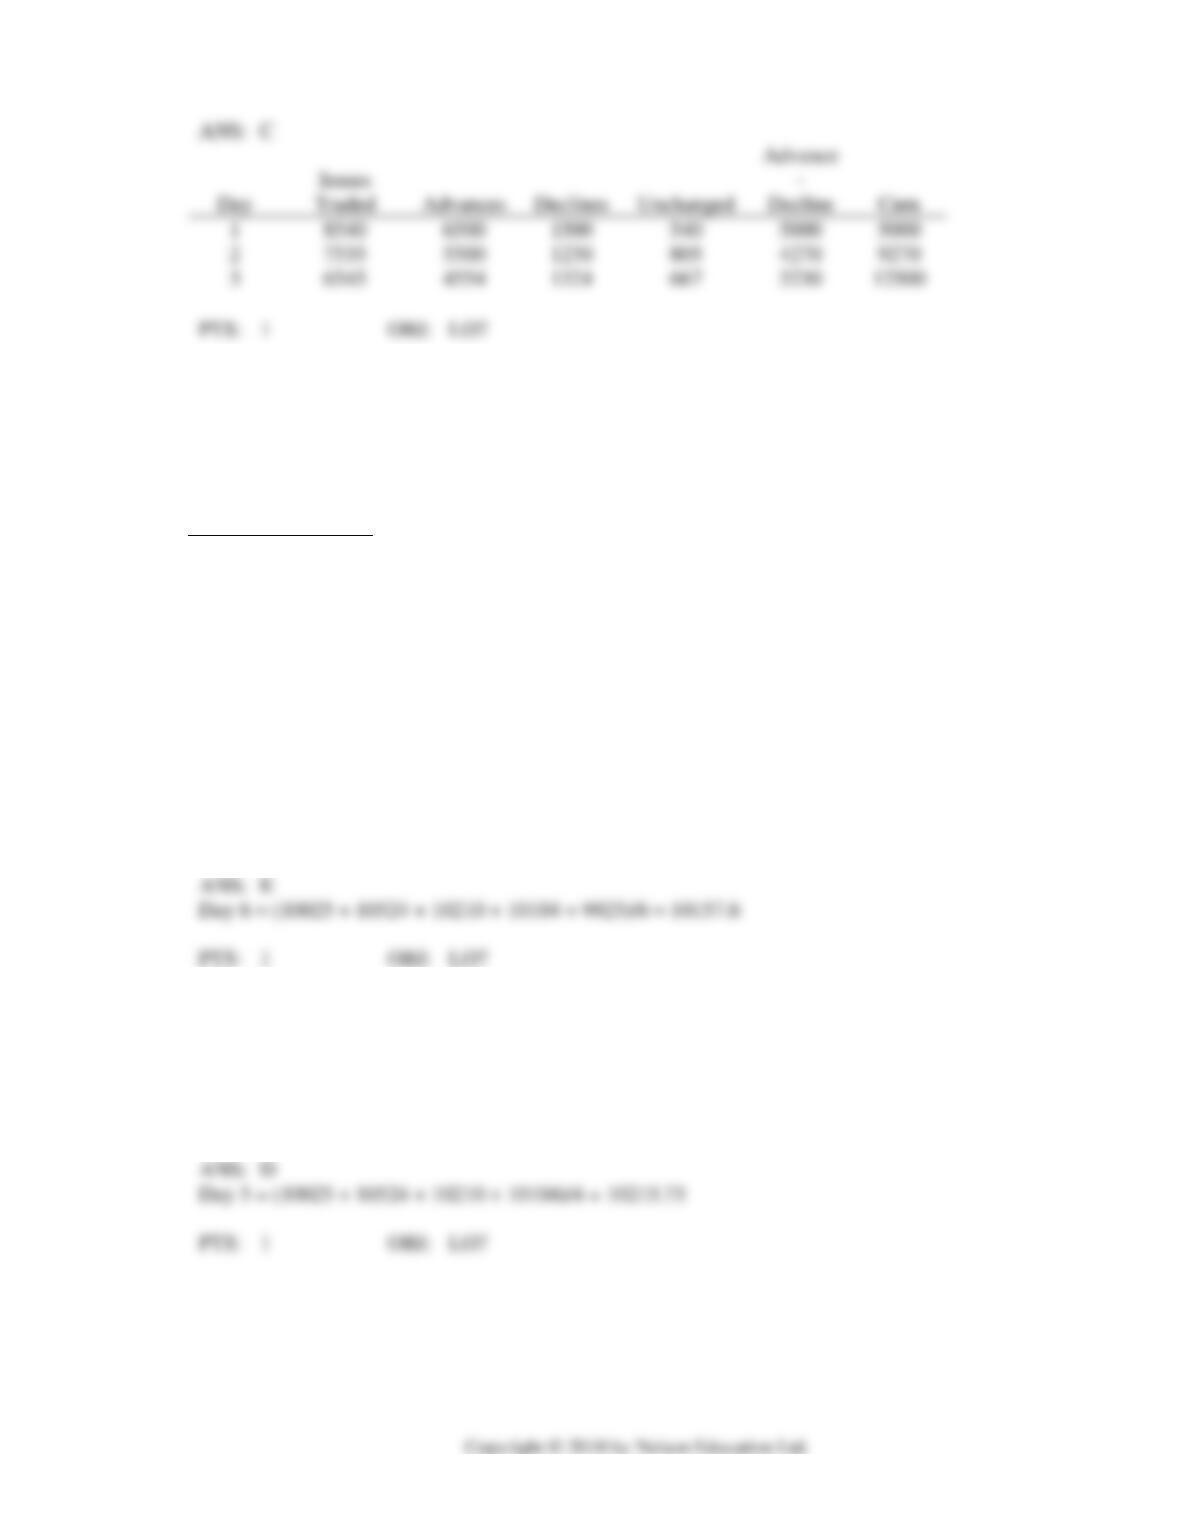
Decline
Cum
1
5000
2
9270
3
12500
13
Exhibit 10-1
THE FOLLOWING INFORMATION IS TO BE USED TO ANSWER THE NEXT QUESTION(S)
Daily closings for the S&P/TSX composite Index are given in the table below.
Day
Price
1
9867
2
10025
3
10524
4
10210
5
10104
6
9925
47. Refer to Exhibit 10-1. Calculate a 5-day moving average for day 6.
a.
10,102.3
b.
9905.6
c.
9875.4
d.
10,215.7
e.
10,157.6
48. Refer to Exhibit 10-1. Calculate a 4-day moving average for day 5.
a.
10,102.3
b.
9905.6
c.
9875.4
d.
10,215.7
e.
10,157.6
14
Exhibit 10-2
THE FOLLOWING INFORMATION IS TO BE USED TO ANSWER THE NEXT QUESTION(S)
The table below provides five days of trade data.
Day
Issues
Traded
Advances
Declines
Unchanged
1
22456
15698
6158
600
2
23013
14560
8210
243
3
23124
10324
12678
122
4
22678
9867
11567
1244
5
21897
8678
12561
658
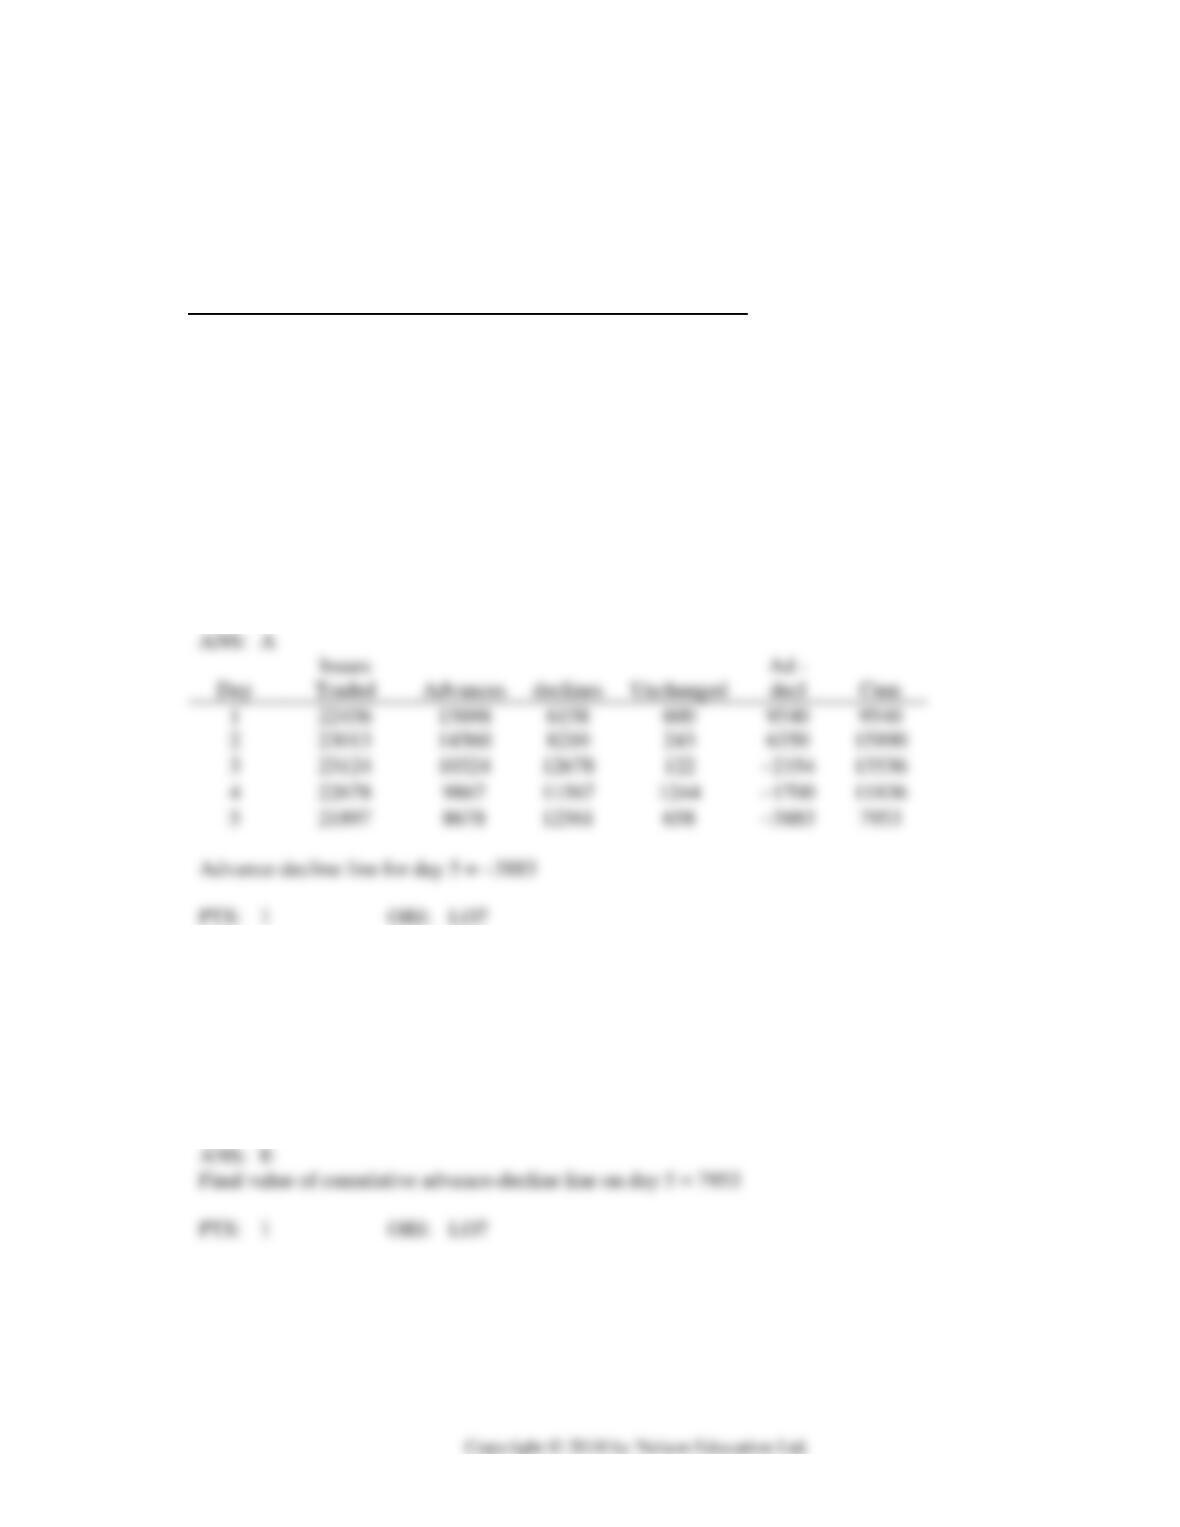
49. Refer to Exhibit 10-2. Calculate the net advance-decline for day 5.
a.
−3,883
b.
9,540
c.
−2,354
d.
13,356
e.
7,953
Day
Issues
Traded
decl
1
22456
15698
600
9540
9540
2
23013
14560
243
6350
3
23124
10324
122
4
22678
9867
1244
5
21897
8678
658
7953
50. Refer to Exhibit 10-2. Calculate the final value of the cumulative advance-decline line at the end of the
fifth day.
a.
−3,883
b.
9,540
c.
−2,354
d.
13,356
e.
7,953

15
51. Daily closings for the S&P/TSX Composite Index are provided in the table below.
Day
S&P/TSX
1
13,500
2
13,395
3
13,505
4
13,750
5
13,820
6
13,910
Calculate a 5-day moving average for day 6.
a.
11,397
b.
13,565
c.
13,594
d.
13,647
e.
13,676