Chapter 10 – Quality Control
119. If the process is known to have a mean of 15 and a standard deviation of 3, using three
sigma control limits, do any of the sample means indicate an out-of-control process mean?
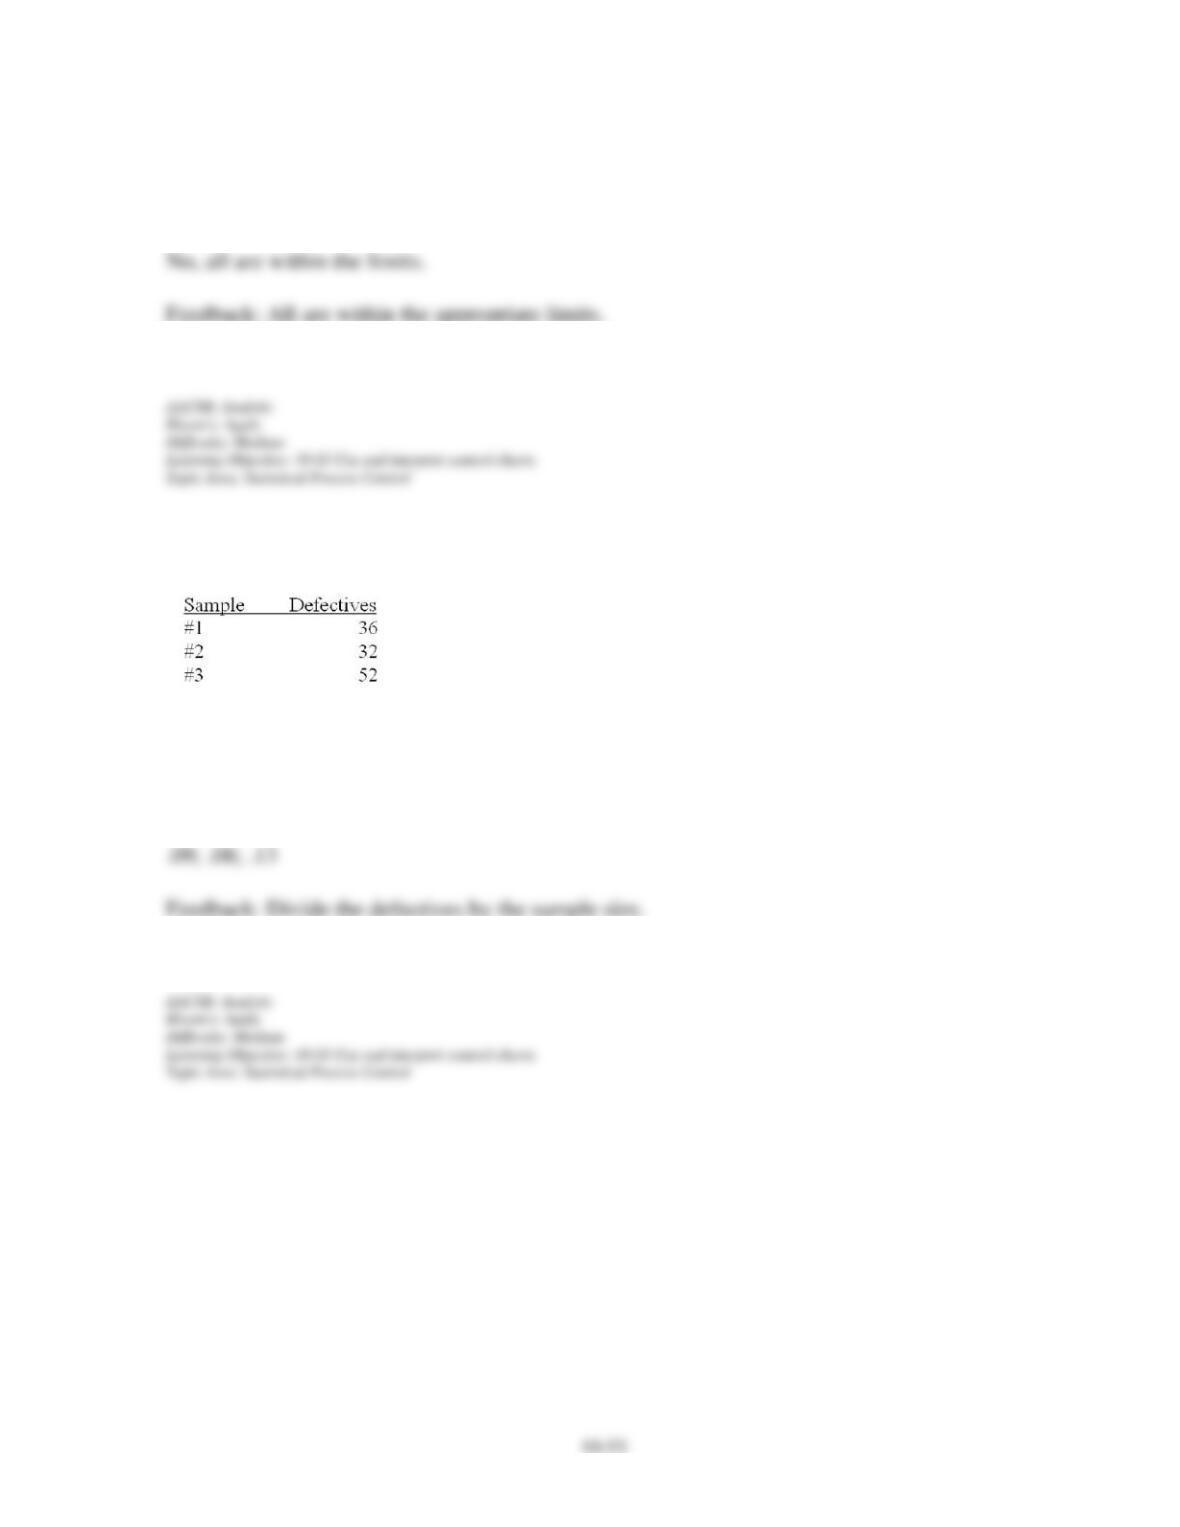
Given the following process control data for a quality attribute (three samples of size 400
each):
120. What is the sample proportion of defectives for sample #1? #2? #3?
Chapter 10 – Quality Control
121. If the process is known to produce 11 percent defectives on average, what is the mean of
the sampling distribution of sample proportions for whenever this process is under control?
The standard deviation?
122. If the process is known to produce 11 percent defectives on average, what is the alpha
risk (probability of Type I error) for upper and lower control limits of .1256 and .0944
respectively? .1412 and .0788? .1568 and .0632?
Chapter 10 – Quality Control
123. If the process is known to produce 11 percent defectives on average, what are the upper
and lower control limits for an alpha risk of .10? .05? .01?
124. If the process is known to produce 11 percent defectives on average, using three sigma
control limits, do any of the sample proportions indicate an out-of-control process proportion
of defectives?
125. If the process proportion of defectives is unknown, what is the estimate of it?
Chapter 10 – Quality Control
126. If the process proportion of defectives is unknown, what is the alpha risk (probability of
Type I error) for upper and lower control limits of .115 and .085 respectively? .13 and .07?
.145 and .055?
127. If the process proportion of defectives is unknown, what are the upper and lower control
limits for an alpha risk of .10? .05? .01?
128. If the process proportion of defectives is unknown, using .10 alpha risk control limits, do
any of the sample proportions indicate an out-of-control process proportion of defectives?
Chapter 10 – Quality Control
A stint for use is coronary surgery requires a special coating. Specifications for this coating
call for it to be at least 0.05 millimeters but no more than 0.15 millimeters.
129. If, when the coating process is in control, the long-run average is 0.09 millimeters, what
metric would be used to assess this process’ capability?
130. Suppose the long-run average of this coating process is 0.09 millimeters. Further suppose
this process’ standard deviation is 0.015 millimeters. What proportion of the output from this
process will fail to meet specifications?
Chapter 10 – Quality Control
131. Suppose the criterion for evaluating this process is that the appropriate capability index
must be at least 1.3. With a long-run process mean of 0.09 and a standard deviation of 0.015,
is this process capable?
132. Assuming that the process mean of 0.09 cannot be changed, what process standard
deviation would be required for this process to be considered capable (assuming that a
capable process must have a capability index of at least 1.3)?
Chapter 10 – Quality Control
133. Studies on a bottle-filling machine indicates it fills bottles to a mean of 16 ounces with a
standard deviation of 0.10 ounces. What is the process specification, assuming the Cpk index
of 1?
134. Studies on a machine that molds plastic water pipe indicate that when it is injecting 1-
inch diameter pipe, the process standard deviation is 0.05 inches. The one-inch pipe has a
specification of 1-inch plus or minus 0.10 inch. What is the process capability index (Cpk) if
the long-run process mean is 1 inch?
Chapter 10 – Quality Control
135. The specification limit for a product is 8 cm and 10 cm. A process that produces the
product has a mean of 9.5 cm and a standard deviation of 0.2 cm. What is the process
capability, Cpk?
136. The specifications for a product are 6 mm 0.1 mm. The process is known to operate at
a mean of 6.05 with a standard deviation of 0.01 mm. What is the Cpk for this process?
Chapter 10 – Quality Control
137. Organizations should work to improve process capability so that quality control efforts
can become more ________.
138. A process results in a few defects occurring in each unit of output. Long-run, these
defects should be monitored with ___________.
Chapter 10 – Quality Control
139. When a process is in control, it results in there being, on average, 16 defects per unit of
output. C-chart limits of 8 and 24 would lead to a _______ chance of a Type I error.
140. When a process is in control, it results in there being, on average, 16 defects per unit of
output. C-chart limits of 4 and 28 would lead to a _______ chance of a Type I error.
Chapter 10 – Quality Control
141. The basis for a statistical process control chart is a(the) __________.