Chapter 10 – Quality Control
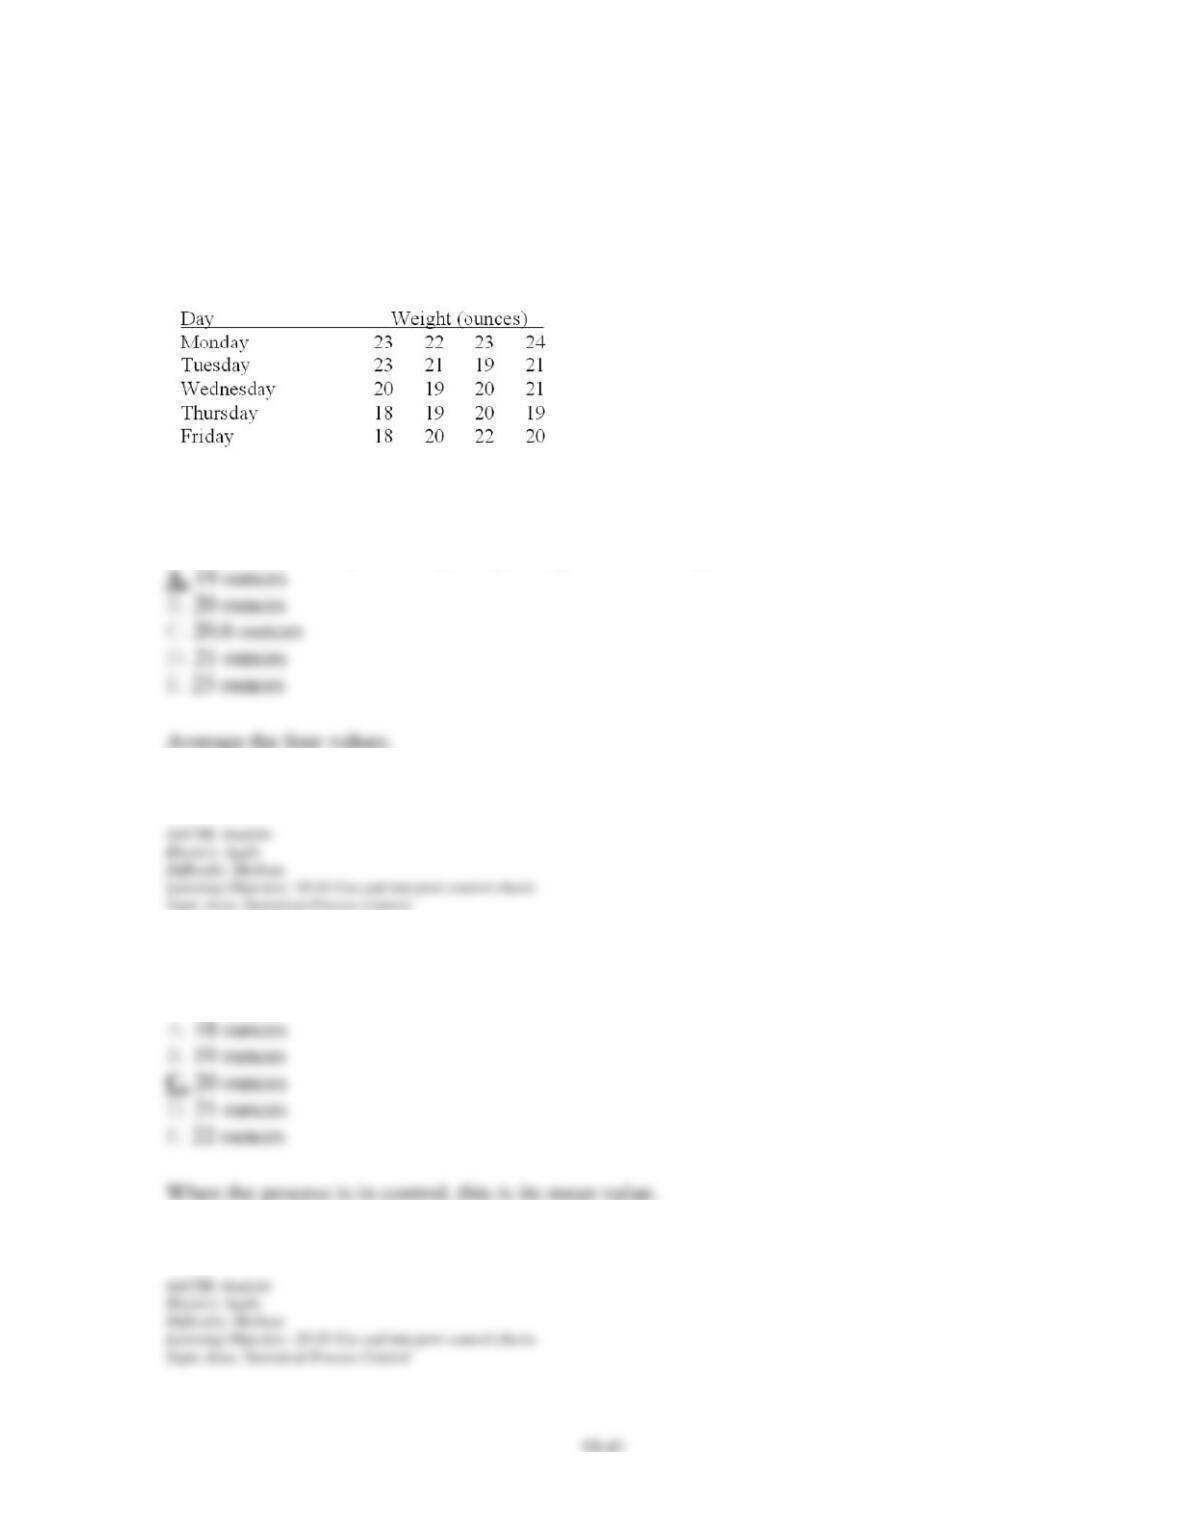
A Quality Analyst wants to construct a sample mean chart for controlling a packaging
process. He knows from past experience that whenever this process is under control, package
weight is normally distributed with a mean of twenty ounces and a standard deviation of two
ounces. Each day last week, he randomly selected four packages and weighed each:
95. What is the sample mean package weight for Thursday?
96. What is the mean of the sampling distribution of sample means when this process is under
control?
Chapter 10 – Quality Control
97. What is the standard deviation of the sampling distribution of sample means for whenever
this process is under control?
98. If he uses upper and lower control limits of 22 and 18 ounces, what is his risk (alpha) of
concluding this process is out of control when it is actually in control (Type I error)?
Chapter 10 – Quality Control
99. If he uses upper and lower control limits of 22 and 18 ounces, on what day(s), if any, does
this process appear to be out of control?
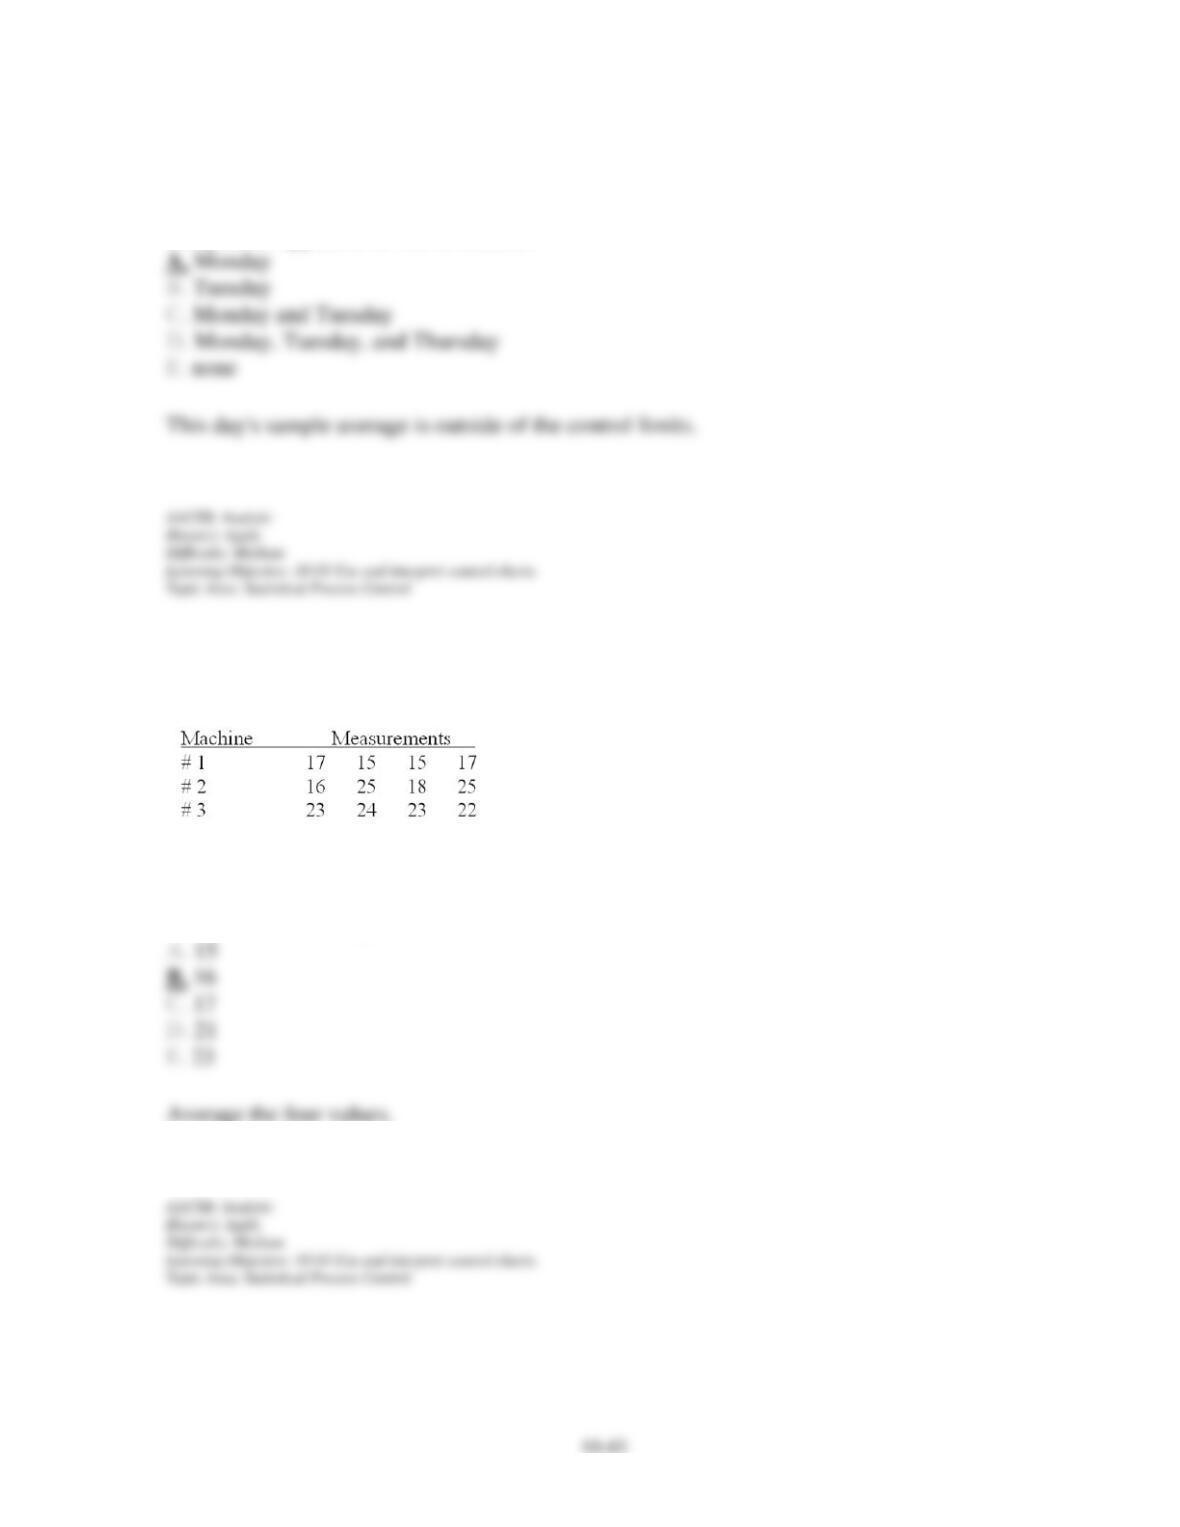
A Quality Analyst wants to construct a control chart for determining whether three machines,
all producing the same product, are under control with regard to a particular quality variable.
Accordingly, he sampled four units of output from each machine, with the following results:
100. What is the sample mean for machine #1?
Chapter 10 – Quality Control
101. What is the estimate of the process mean for whenever it is under control?
102. What is the estimate of the sample average range based upon this limited sample?
Chapter 10 – Quality Control
10–45
103. What are the x-bar chart three sigma upper and lower control limits?
104. For upper and lower control limits of 23.29 and 16.71, which machine(s), if any,
appear(s) to have an out-of-control process mean?
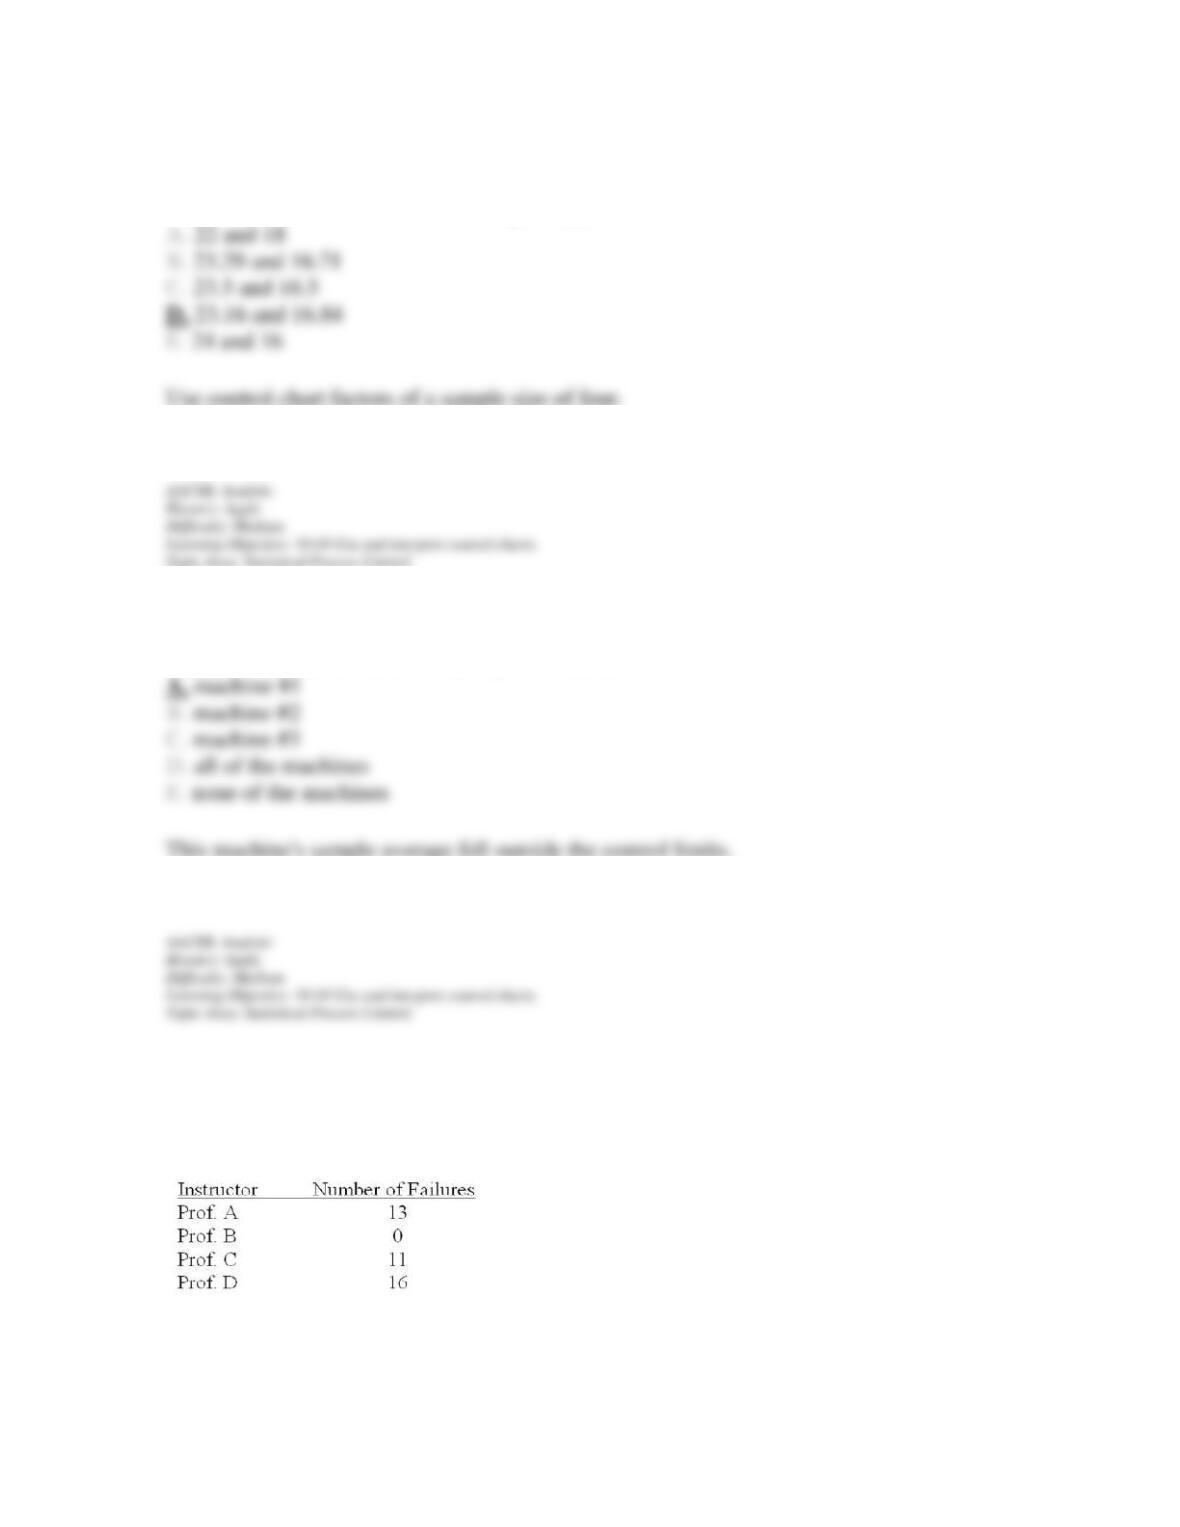
The Chair of the Operations Management Department at Quality University wants to
construct a p-chart for determining whether the four faculty teaching the basic P/OM course
are under control with regard to the number of students who fail the course. Accordingly, he
sampled 100 final grades from last year for each instructor, with the following results:
Chapter 10 – Quality Control
105. What is the sample proportion of failures (p) for Prof. D?
106. What is the estimate of the mean proportion of failures for these instructors?
Chapter 10 – Quality Control
107. What is the estimate of the standard deviation of the sampling distribution for an
instructor’s sample proportion of failures?
108. What are the .95 (5% risk of Type I error) upper and lower control limits for the p-chart?
Chapter 10 – Quality Control
109. Using .95 control limits, (5% risk of Type I error), which instructor(s), if any, should he
conclude is (are) out of control?
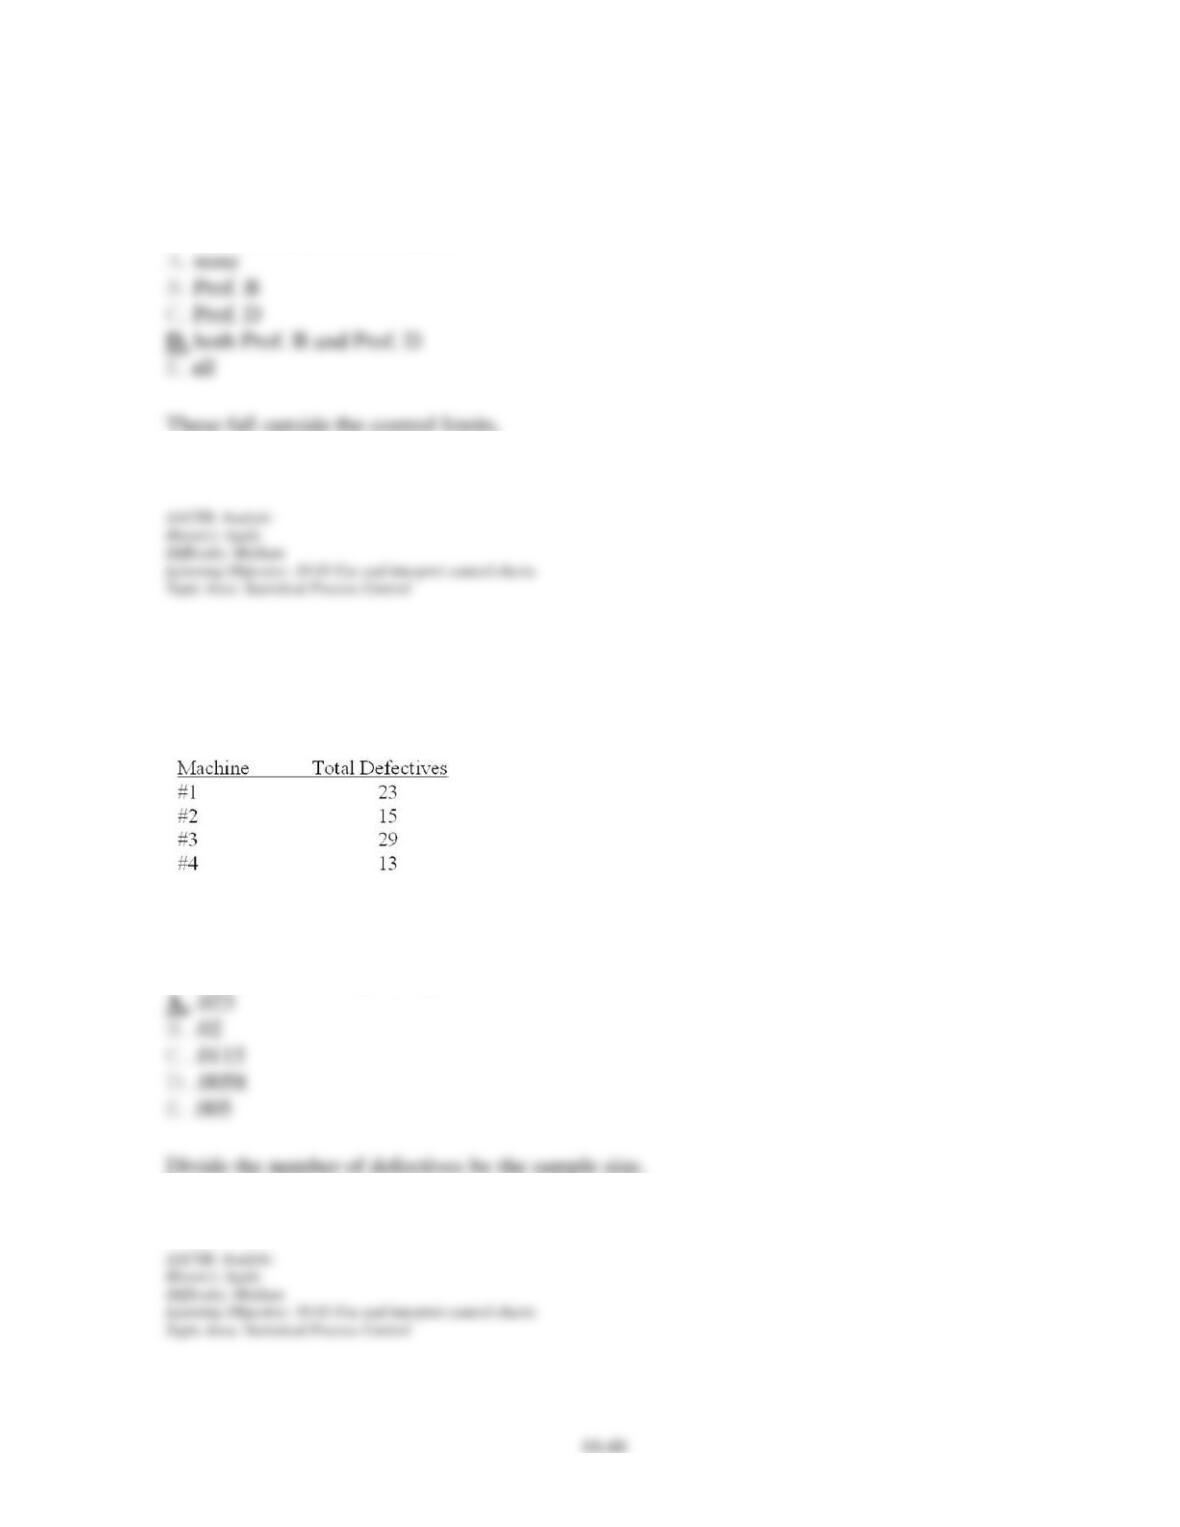
A Quality Analyst wants to construct a control chart for determining whether four machines,
all producing the same product, are under control with regard to a particular quality attribute.
Accordingly, she inspected 1,000 units of output from each machine in random samples, with
the following results:
110. What is the sample proportion of defectives for machine #1?
Chapter 10 – Quality Control
111. What is the estimate of the process proportion of defectives for whenever it is under
control?
112. What is the estimate of the standard deviation of the sampling distribution of sample
proportions for whenever this process is under control?
Chapter 10 – Quality Control
10–50
113. What are the control chart upper and lower control limits for an alpha risk of .05?
114. For upper and lower control limits of .026 and .014, which machine(s), if any, appear(s)
to be out-of-control for process proportion of defectives?
Given the following process control data for a normally distributed quality variable (three
samples of size four each):
Chapter 10 – Quality Control
115. What is the sample mean for sample #1? #2? #3?
116. If the process is known to have a mean of 15 and a standard deviation of 3, what is the
mean of the sampling distribution of sample means for whenever this process is under
control? The standard deviation?
Chapter 10 – Quality Control
117. If the process is known to have a mean of 15 and a standard deviation of 3, what is the
alpha risk (probability of Type I error) for upper and lower control limits of 16.5 and 13.5
respectively? 18 and 12? 19.5 and 10.5?
118. If the process is known to have a mean of 15 and a standard deviation of 3, what are the
three sigma upper and lower control limits for an x-bar chart?