Chapter 10 – Quality Control
59. A control chart used to monitor the fraction of defectives generated by a process is the:
60. A p-chart would be used to monitor _______.
Chapter 10 – Quality Control
61. A c-chart is used for:
62. A control chart used to monitor the number of defects per unit is the:
Chapter 10 – Quality Control
63. A point which is outside of the lower control limit on an R-chart:
64. If a process is performing as it should, it is still possible to obtain observations which are
outside of which limits?
(I) tolerances
(II) control limits
(III) process variability
Chapter 10 – Quality Control
65. Which of the following relationships must always be incorrect?
66. Which of the following is not a step in the quality control process?
Chapter 10 – Quality Control
67. The probability of concluding that assignable variation exists when only random variation
is present is:
(I) the probability of a Type I error
(II) known as the alpha risk
(III) highly unlikely
(IV) the sum of probabilities in the two tails of the normal distribution
68. _______ variation is a variation whose cause can be identified.
Chapter 10 – Quality Control
69. A plot below the lower control limit on the range chart:
(I) should be ignored since lower variation is desirable
(II) may be an indication that process variation has decreased
(III) should be investigated for assignable cause
70. A shift in the process mean for a measured characteristic would most likely be detected by
a:
Chapter 10 – Quality Control
71. The range chart (R-chart) is most likely to detect a change in:
72. The optimum level of inspection is where the:
Chapter 10 – Quality Control
73. The purpose of control charts is to:
74. The process capability index (Cpk) may mislead if:
(I) the process is not stable.
(II) the process output is not normally distributed.
(III) the process is not centered.
Chapter 10 – Quality Control
75. A time-ordered plot of sample statistics is called a(n) ______ chart.
76. A process that makes chocolate candy bars has an output that is normally distributed with
a mean of 6 oz. and a standard deviation of .01 oz. A job is to be run that requires 200 candy
bars.
Determine three sigma control limits for an x-bar chart assuming a sample size of 10.
If specifications are 5.98 to 6.02, what run size should be used for this job so that the expected
number of good candy bars is 200, assuming the process is in control?
Chapter 10 – Quality Control
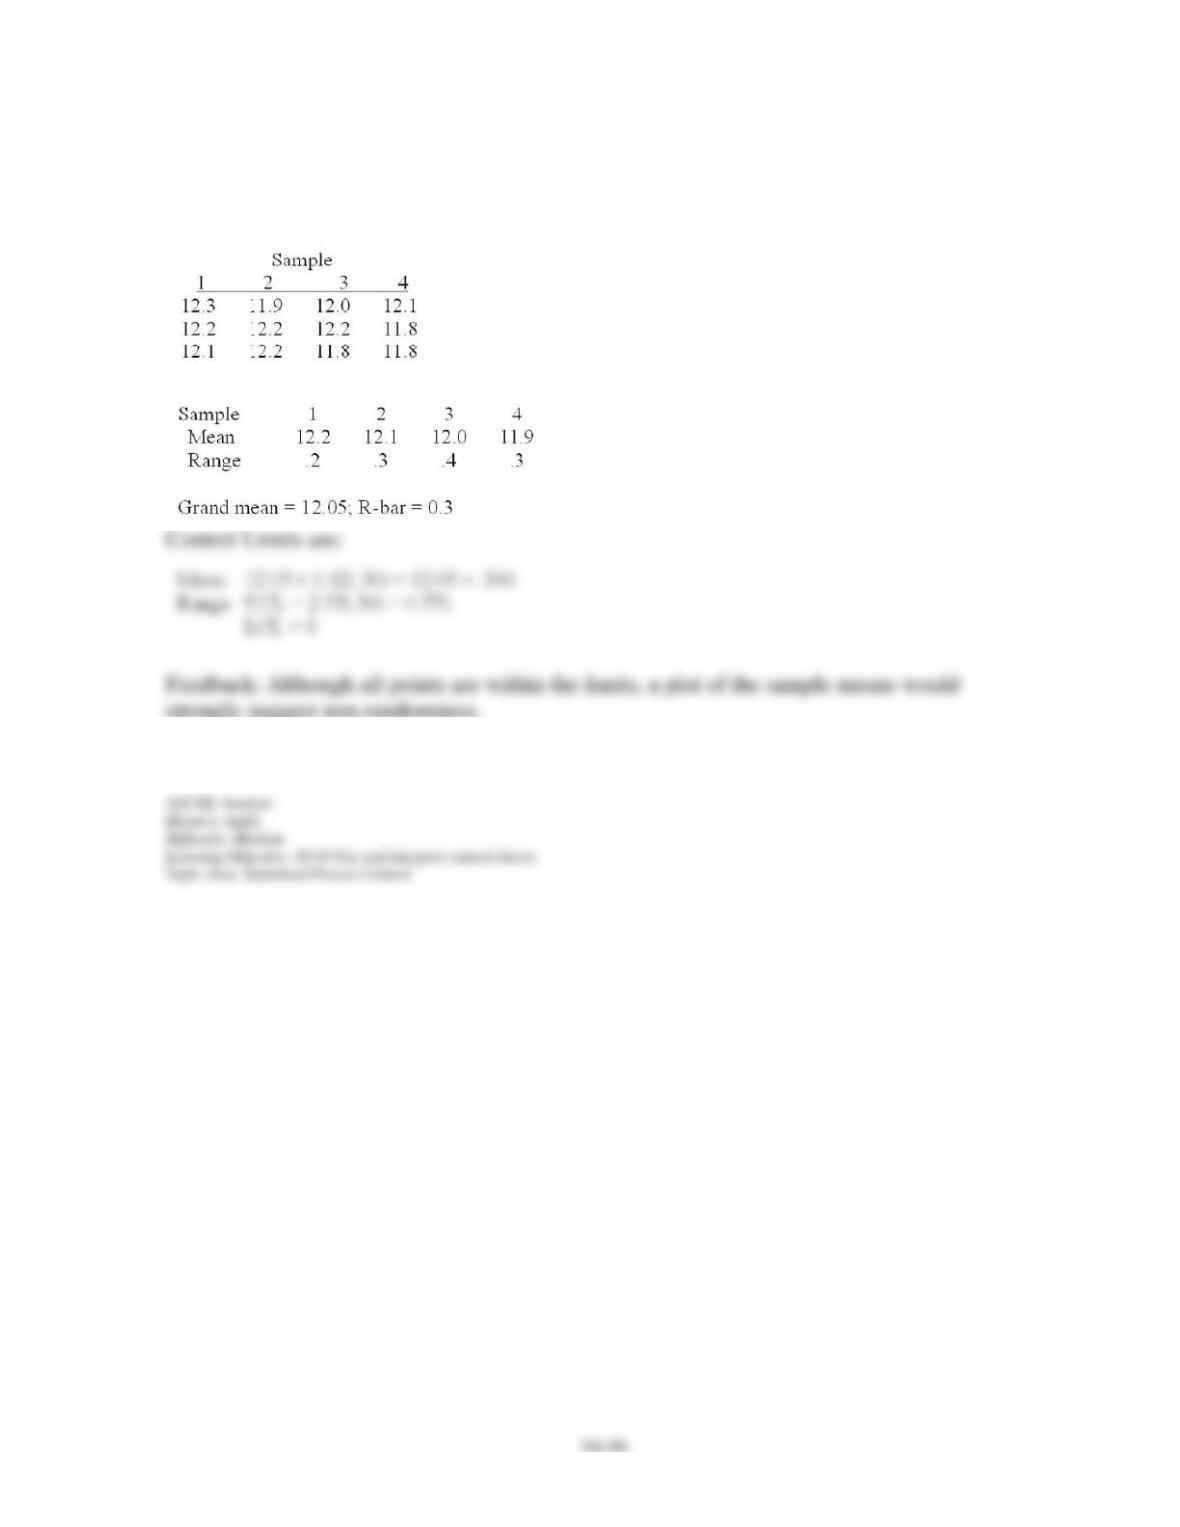
77. Four samples of three observations each have been taken, with actual measurements (in
centimeters) shown below. Construct three-sigma mean and range charts.
Chapter 10 – Quality Control
78. A town’s department of public works is concerned about adverse public reaction to a
sewer project that is currently in progress. Because of this, the Commissioner of Public Works
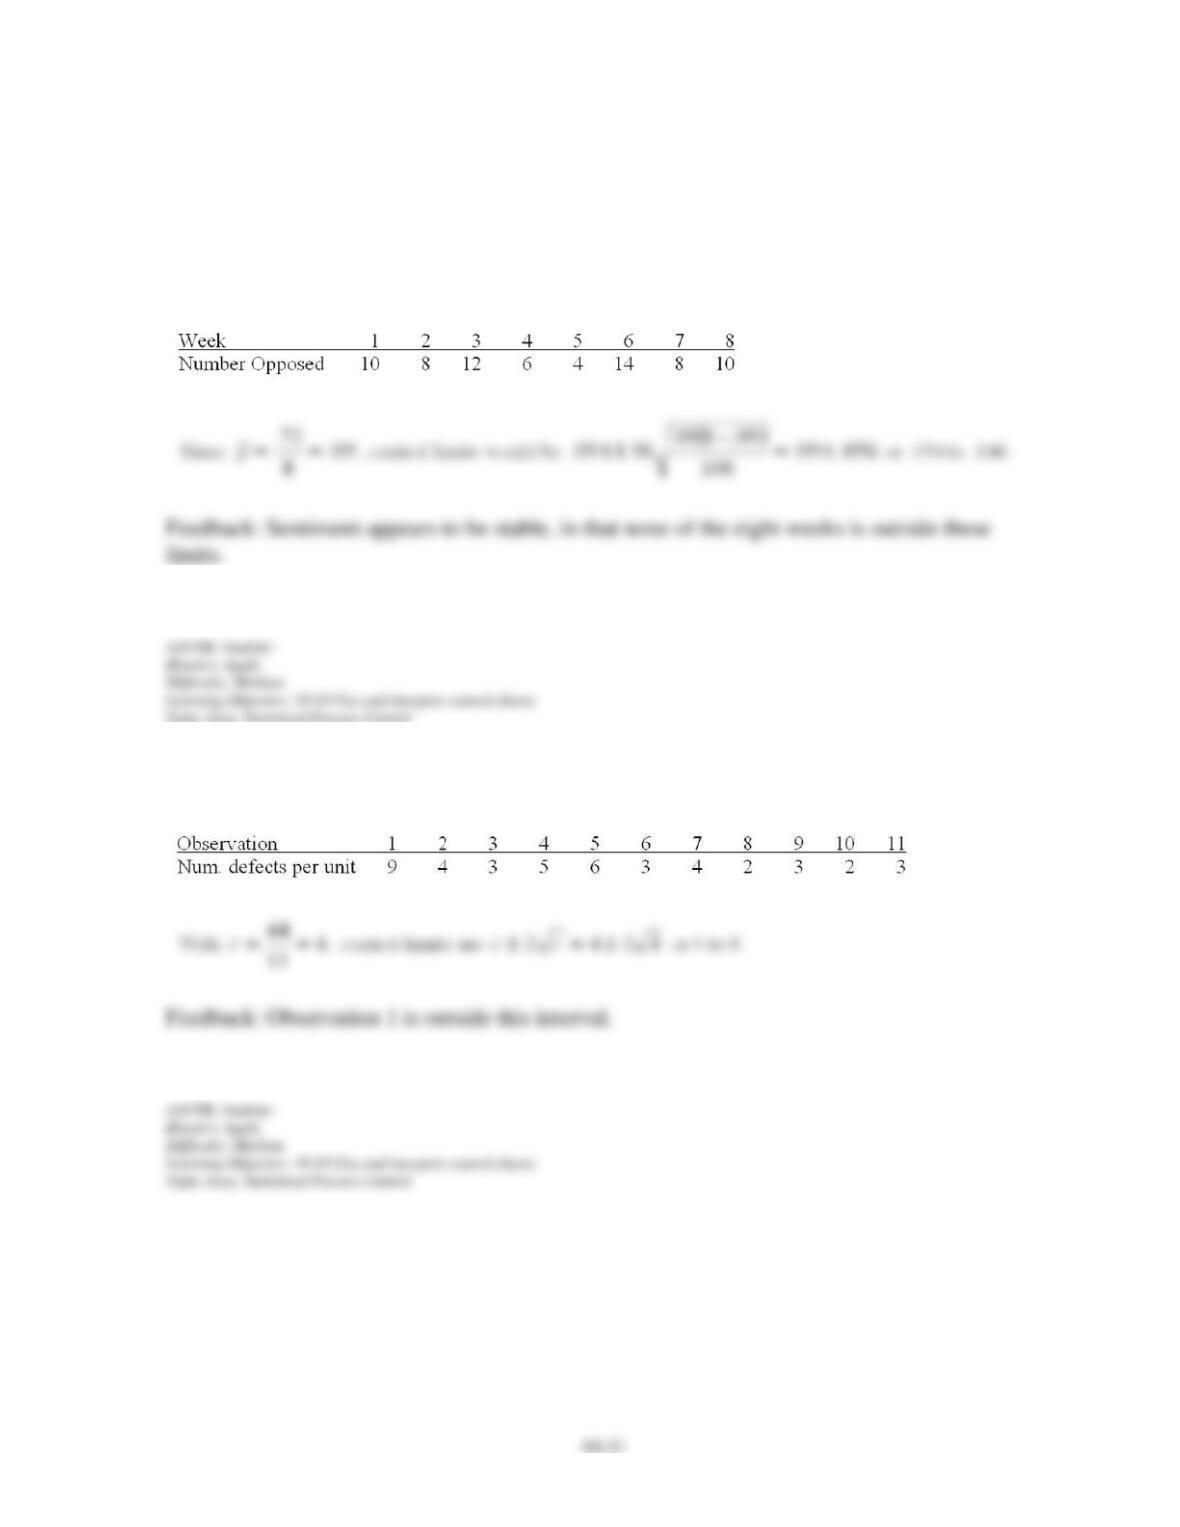
has authorized a weekly survey to be conducted of town residents. Each week, a sample of
100 residents is questioned on their feelings towards the project. The results to date are shown
below. Analyze this data using control charts that would provide for a 5% risk of Type I error.
79. Construct the appropriate two-sigma control chart for the sample observations listed
below.
Chapter 10 – Quality Control
80. Perform run tests on the given data. What can you conclude?
Chapter 10 – Quality Control
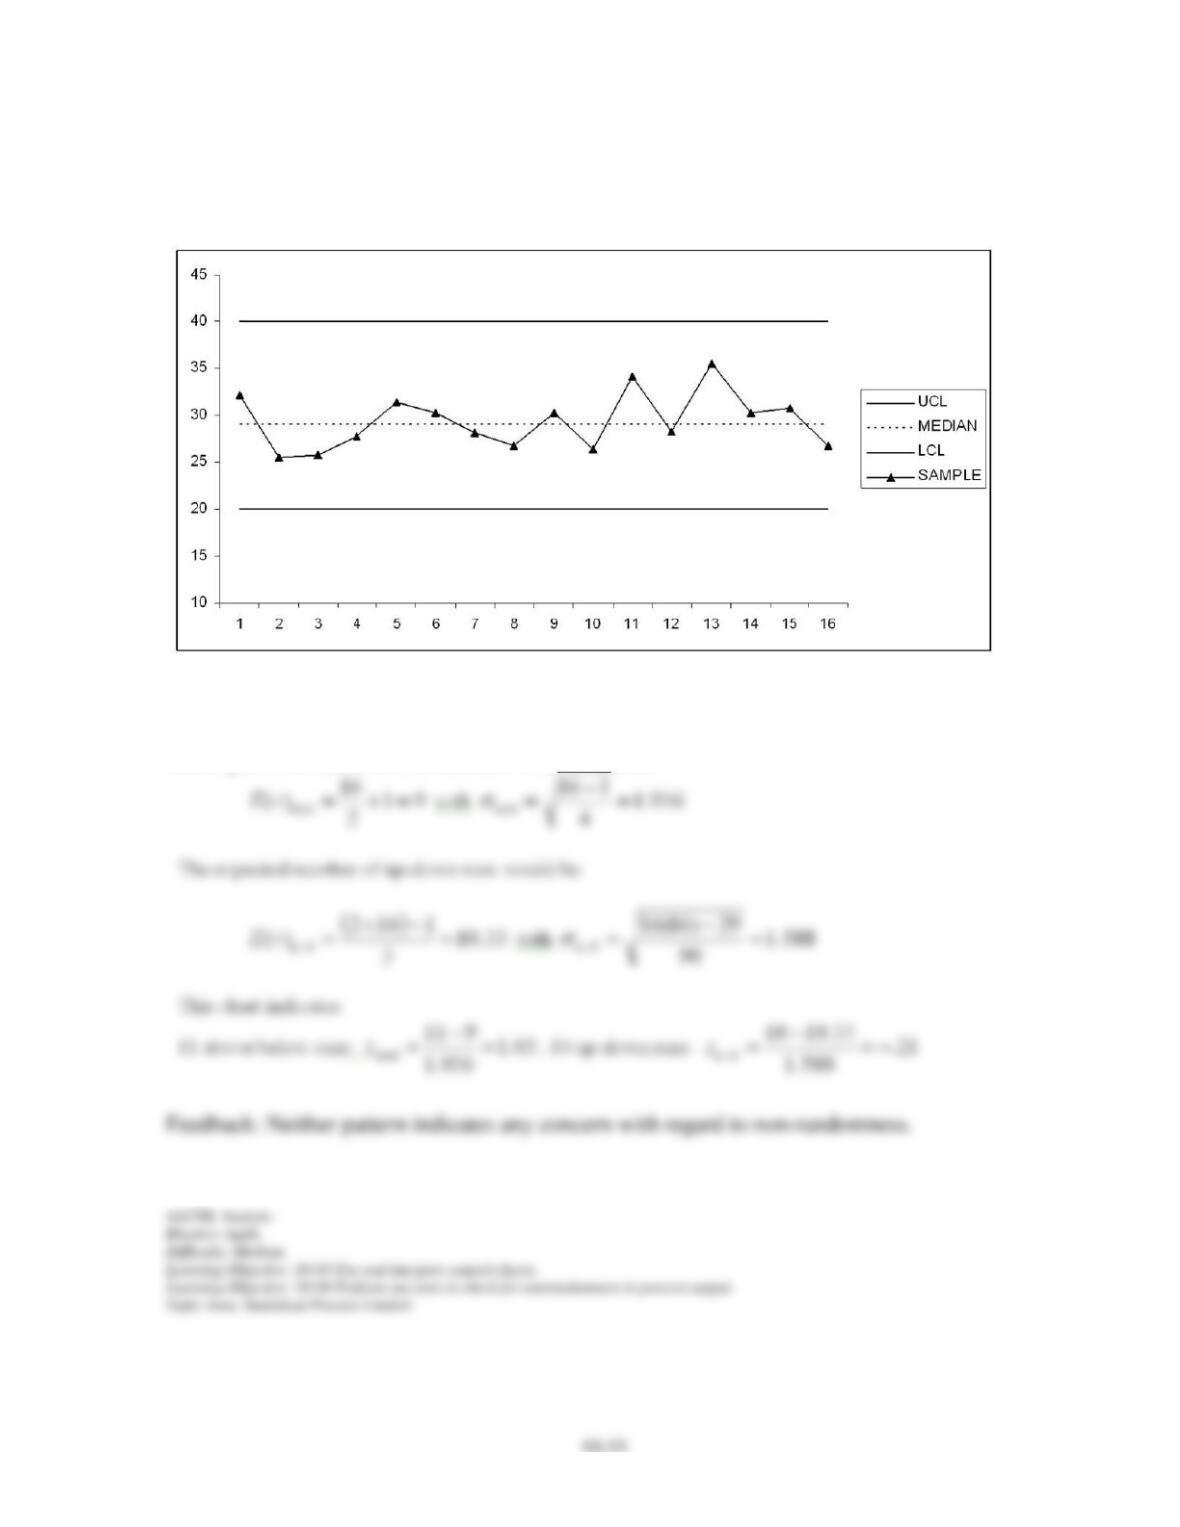
81. The chart below depicts 16 sample means that were taken at periodic intervals and plotted
on a control chart. Does the output appear to be random?
Since all points are within the control limits, this suggests an in-control process. To determine
whether it is truly random, runs tests should be performed.
The expected number of above/below runs would be:
Chapter 10 – Quality Control
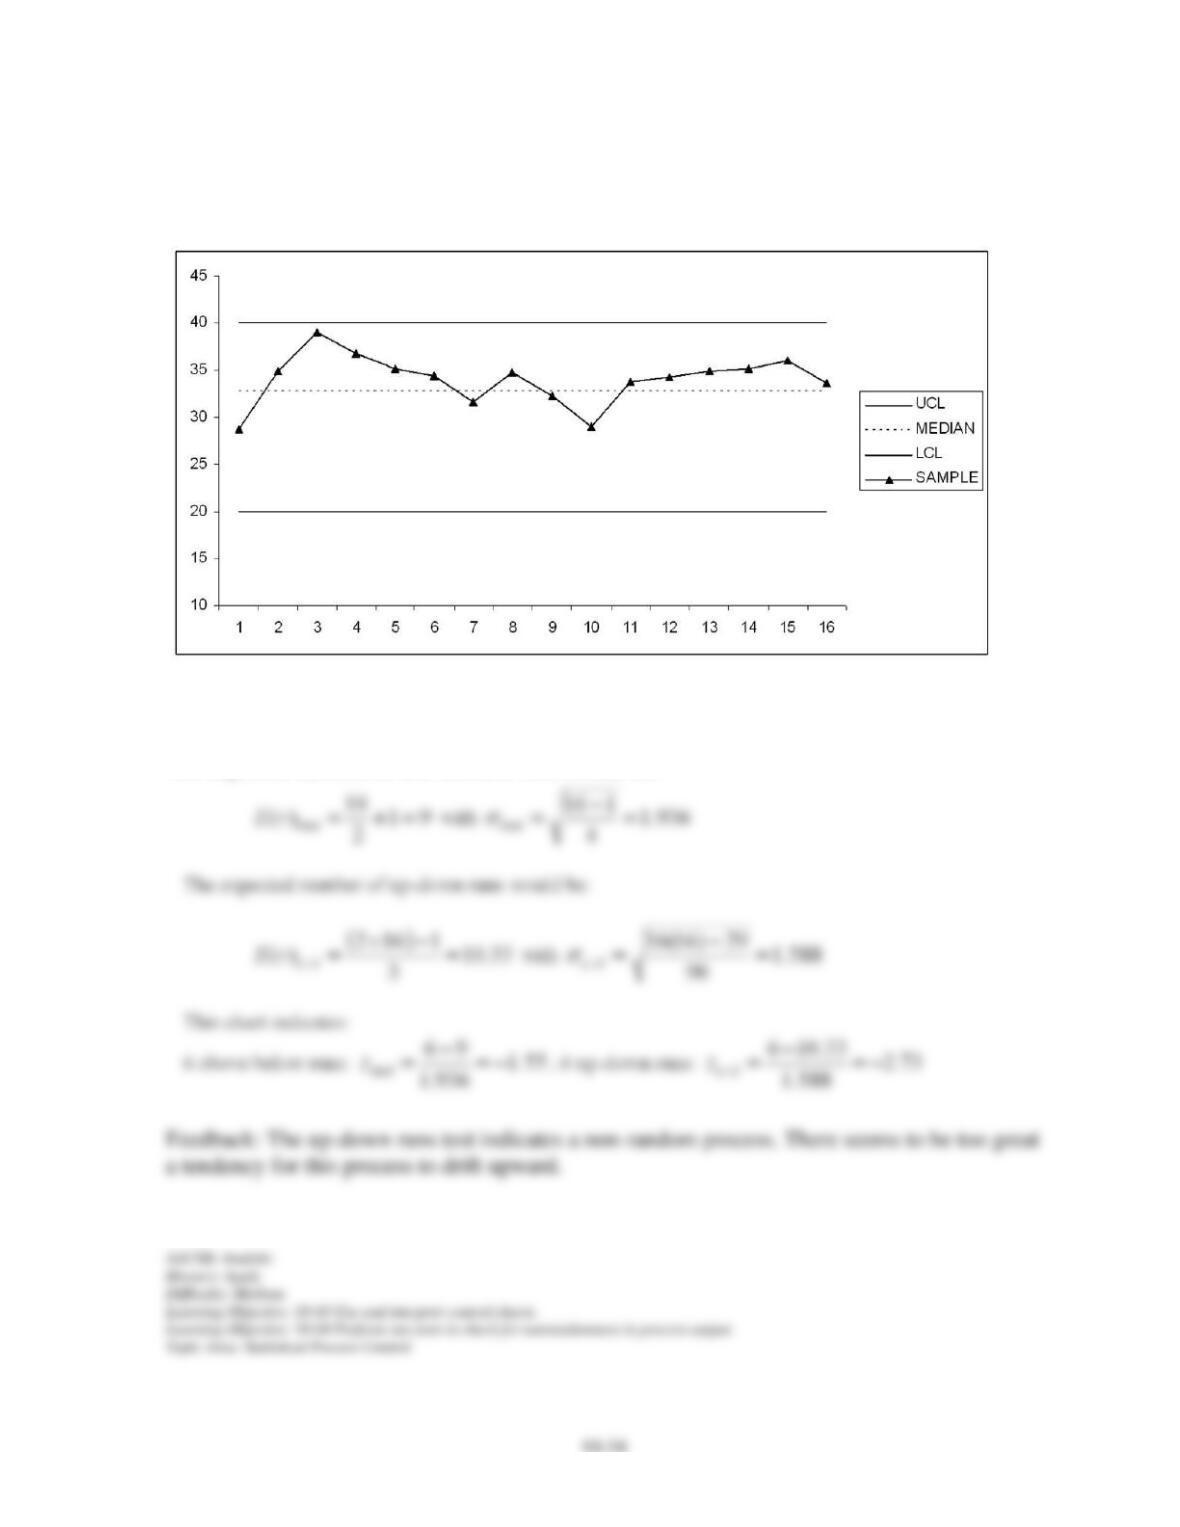
82. Given the following control chart, would you say that the process appears to be
performing appropriately?
Since all points are within the control limits, this suggests an in-control process. To determine
whether it is truly random, runs tests should be performed.
The expected number of above/below runs would be:
Chapter 10 – Quality Control
10–35
83. An analyst has gathered data and counted the number of runs with respect to the median.
There were 60 observations and 22 runs. What can the analyst conclude given this
information?
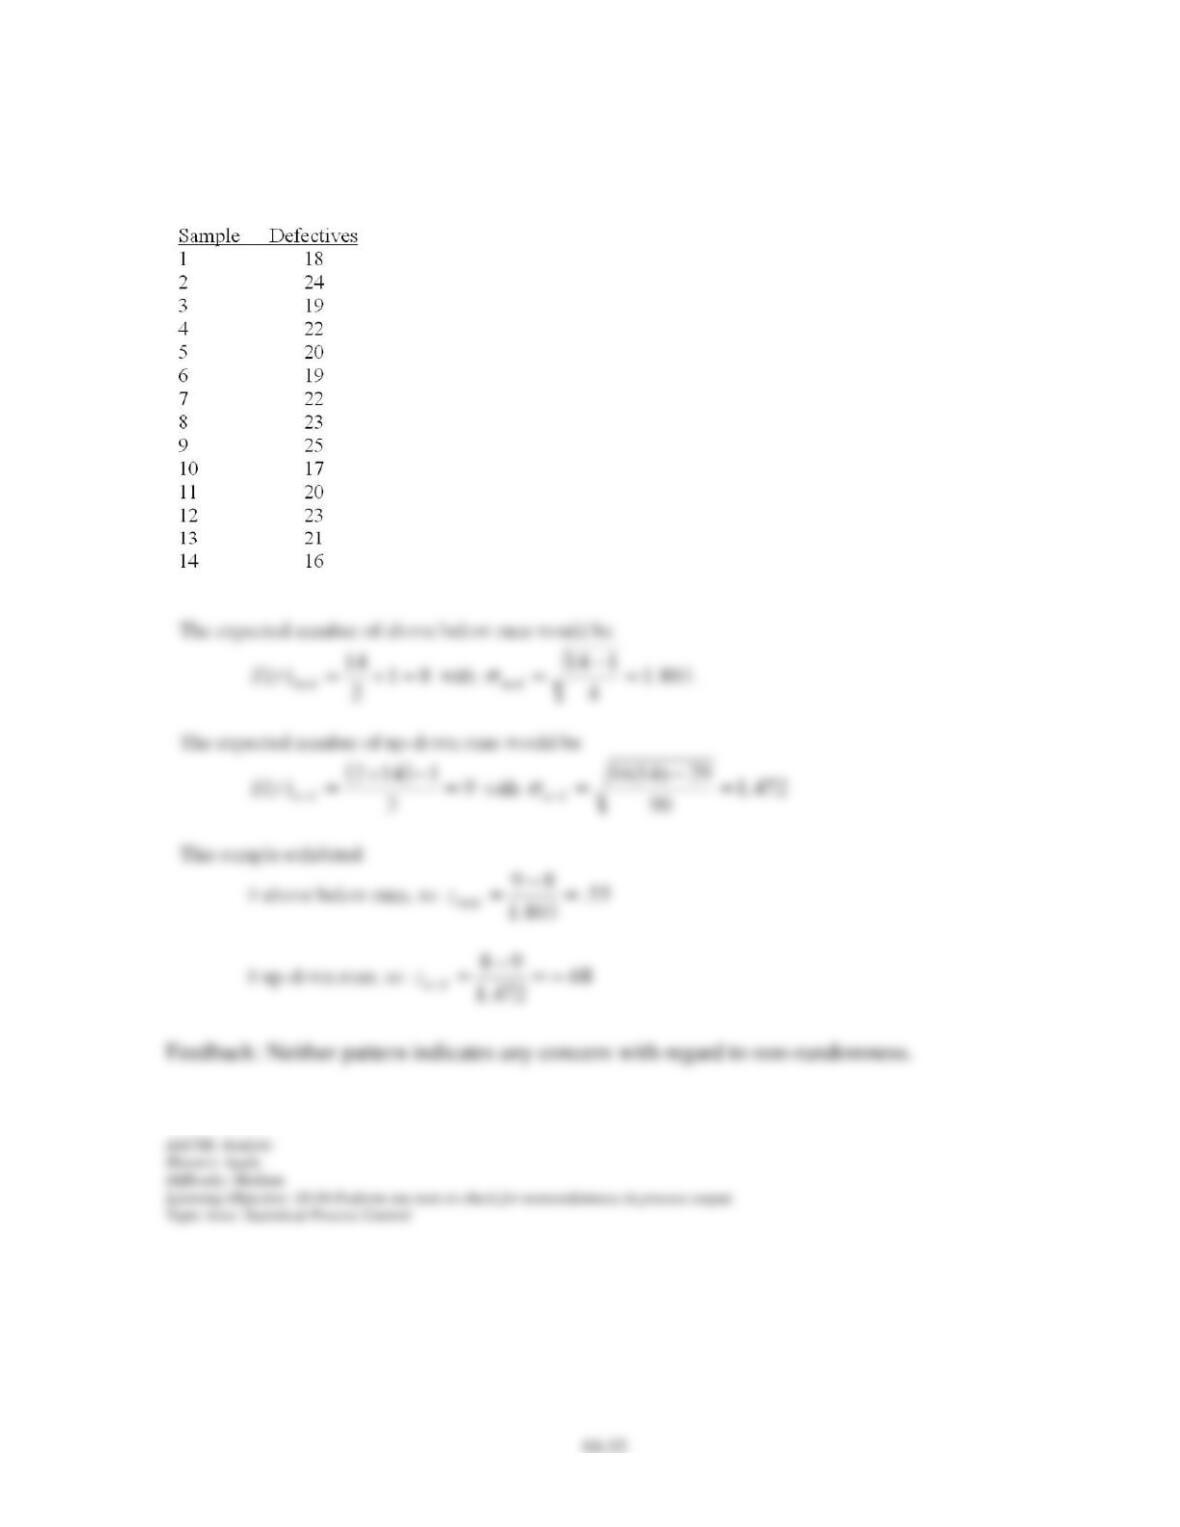
84. An operator collected the following time series data from a process:
(A) Determine the number of A/B runs.
(B) Determine the number of up/down runs.
Chapter 10 – Quality Control
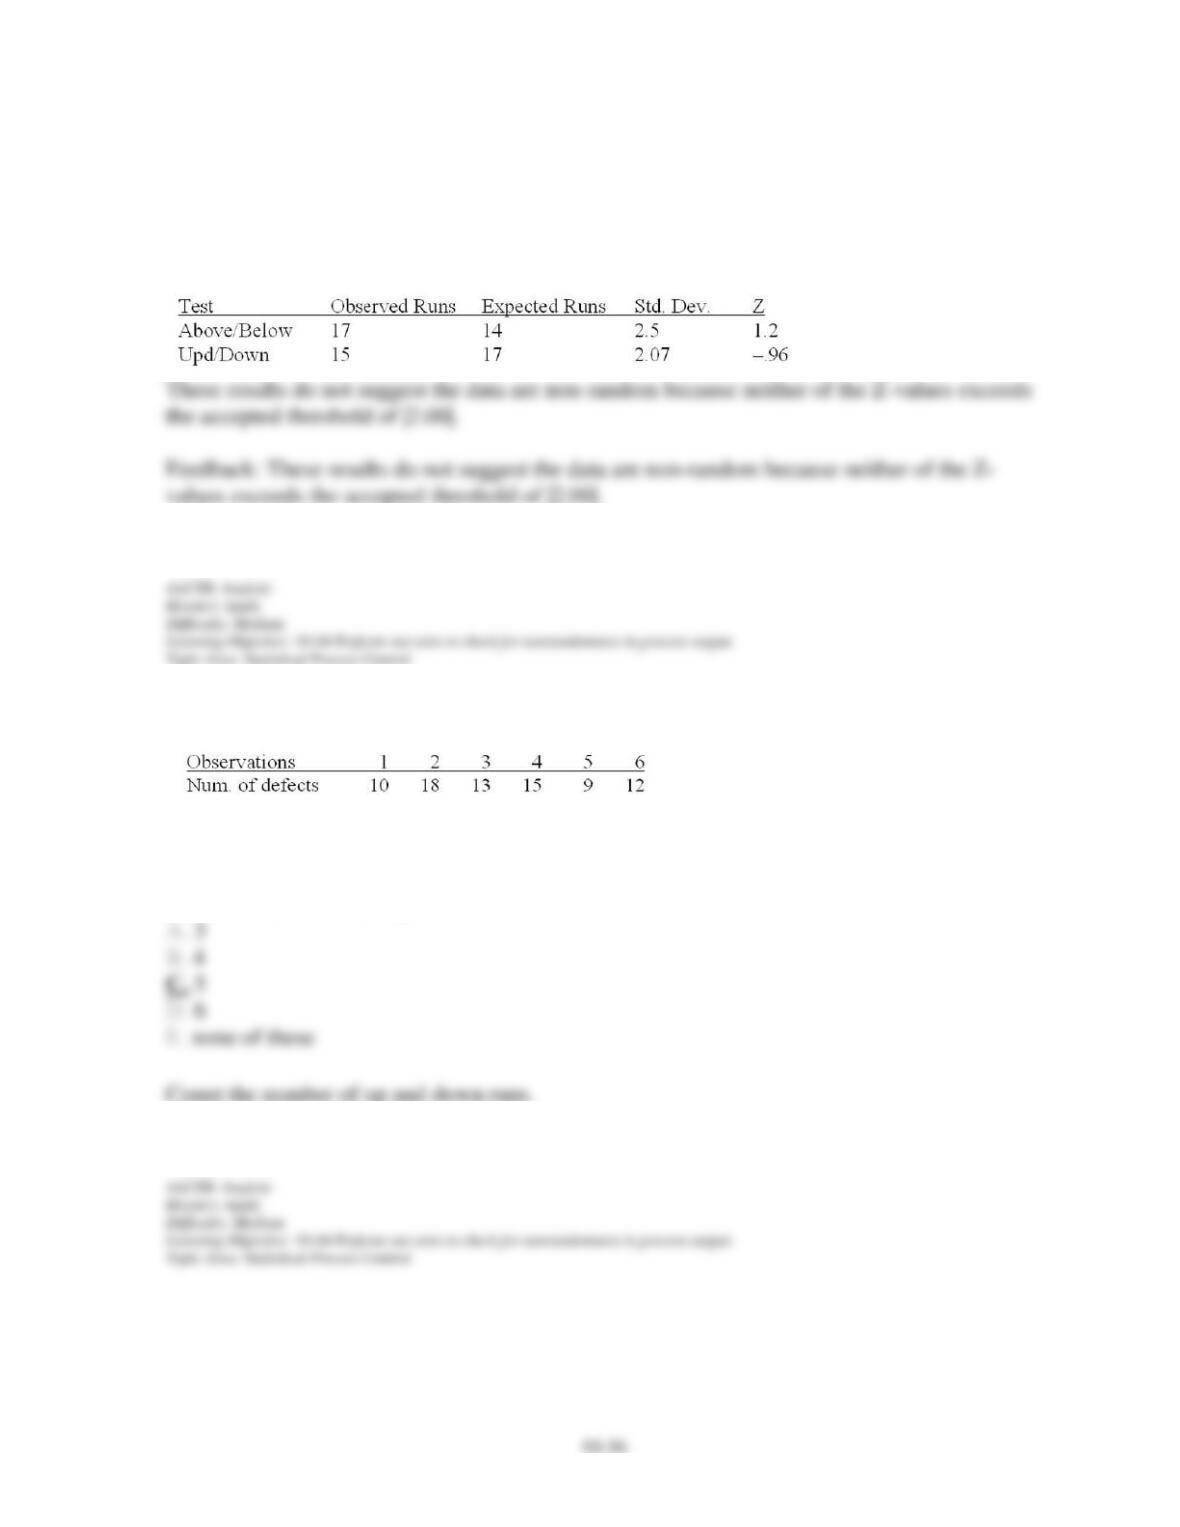
85. An analyst counted 17 A/B runs and 15 U/D runs in 26 time series observations. Do these
results suggest that the data are non-random?
86. The number of runs up and down for the data above is:
Chapter 10 – Quality Control
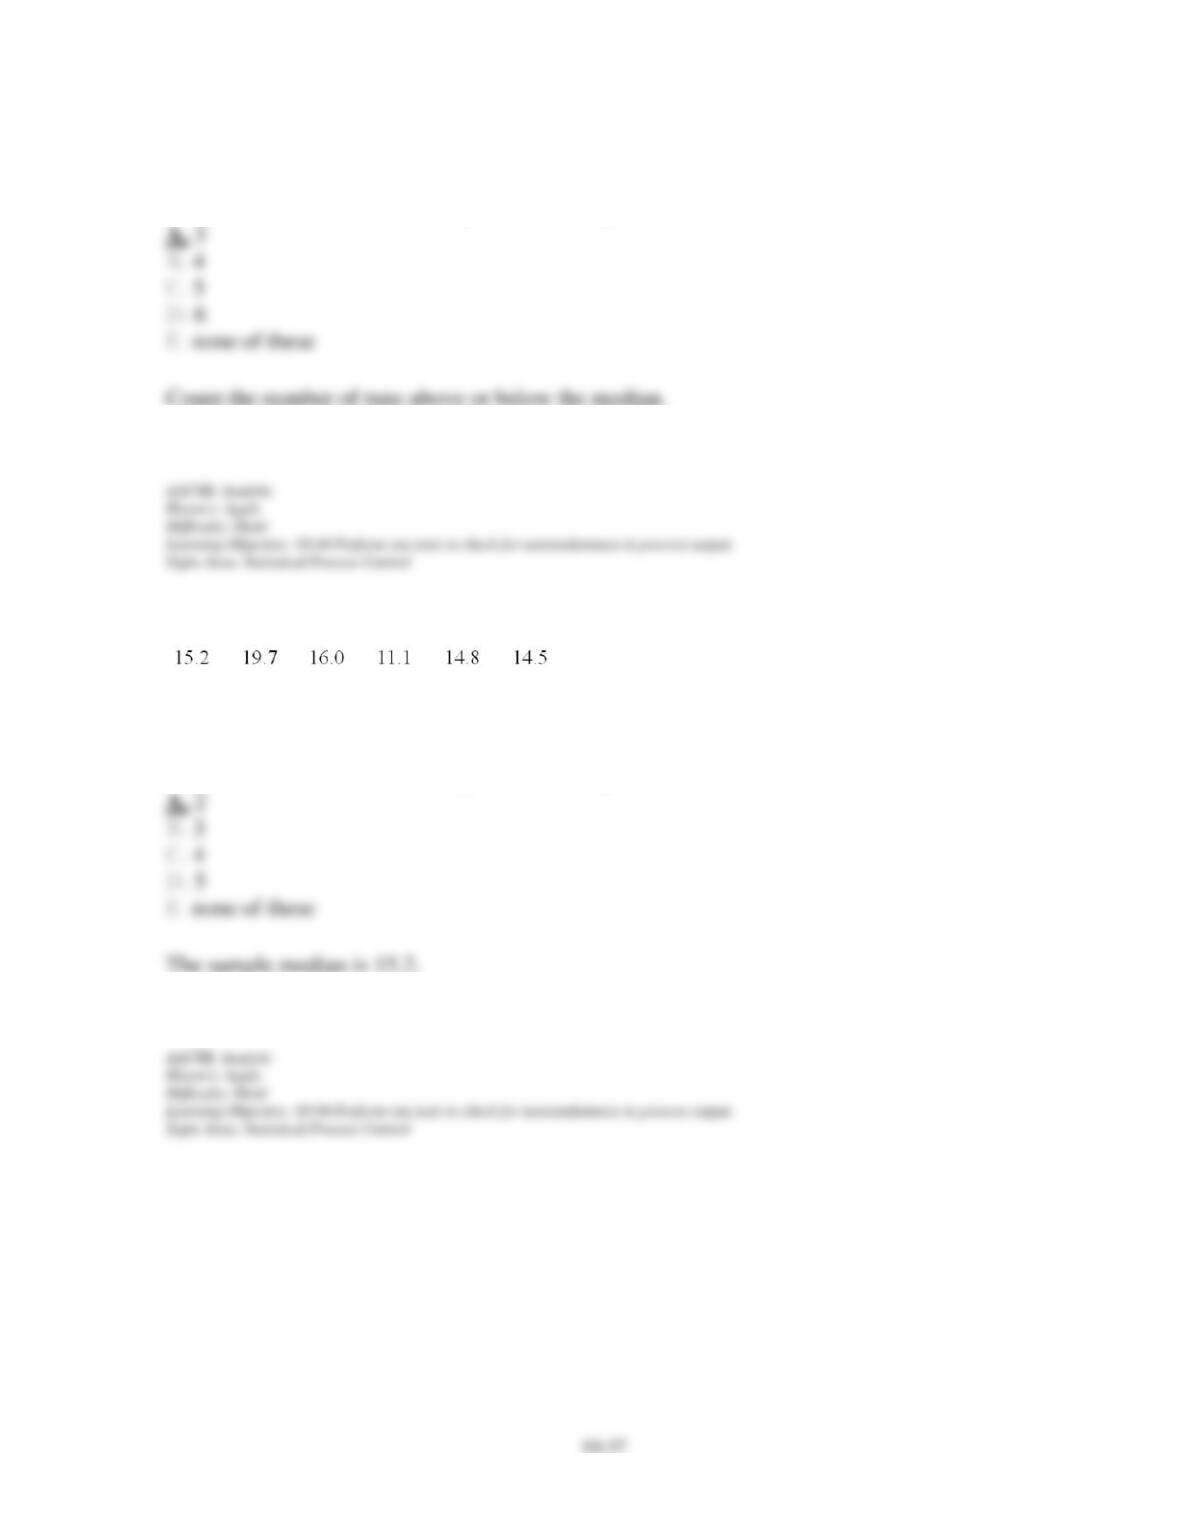
87. The number of runs with respect to the sample median is:
The following data occurs chronologically from left to right:
88. The number of runs with respect to the sample median is:
Chapter 10 – Quality Control
89. The number of runs up and down is:
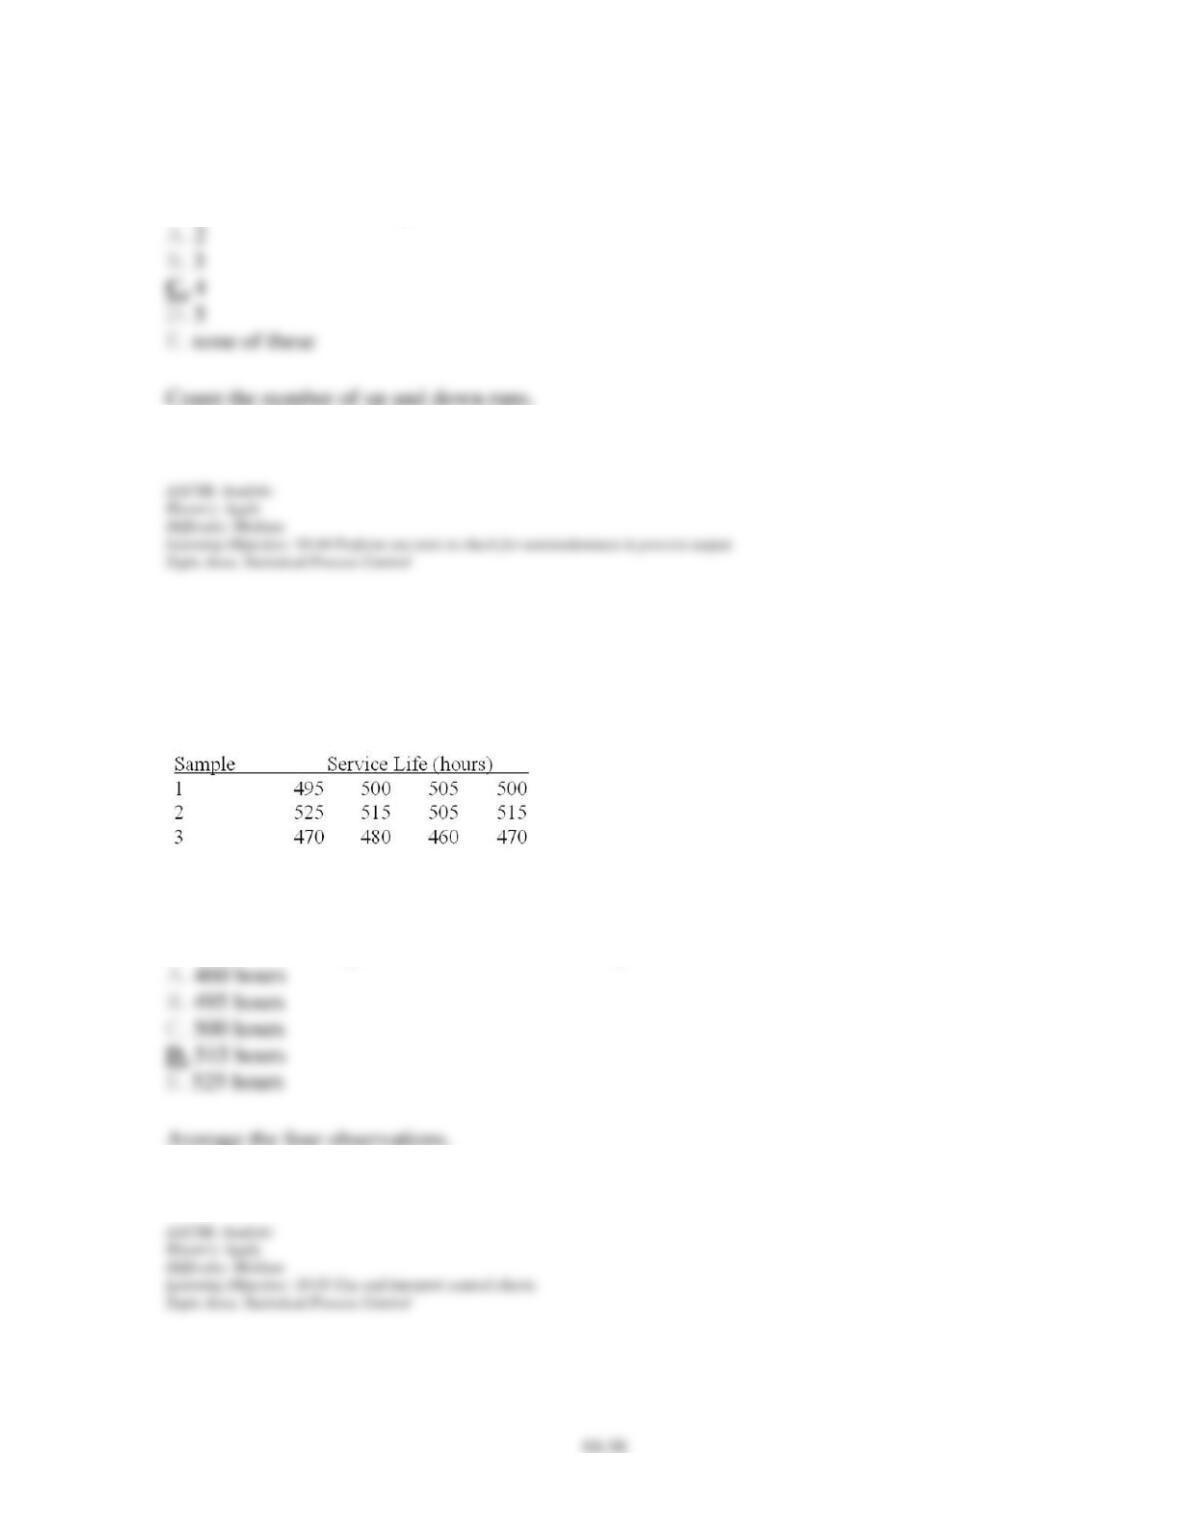
A design engineer wants to construct a sample mean chart for controlling the service life of a
halogen headlamp his company produces. He knows from numerous previous samples that
this service life is normally distributed with a mean of 500 hours and a standard deviation of
20 hours. On three recent production batches, he tested service life on random samples of four
headlamps, with these results:
90. What is the sample mean service life for sample 2?
Chapter 10 – Quality Control
91. What is the mean of the sampling distribution of sample means when service life is in
control?
92. What is the standard deviation of the sampling distribution of sample means for whenever
service life is in control?
Chapter 10 – Quality Control
93. If he uses upper and lower control limits of 520 and 480 hours, what is his risk (alpha) of
concluding service life is out of control when it is actually under control (Type I error)?
94. If he uses upper and lower control limits of 520 and 480 hours, on what sample(s) (if any)
does service life appear to be out of control?