68) For the data below:
Year
Automobile Sales
Year
Automobile Sales
1990
116
1977
119
1991
105
1998
34
1992
29
1999
34
1993
59
2000
48
1994
108
2001
53
1995
94
2002
65
1996
27
2003
111
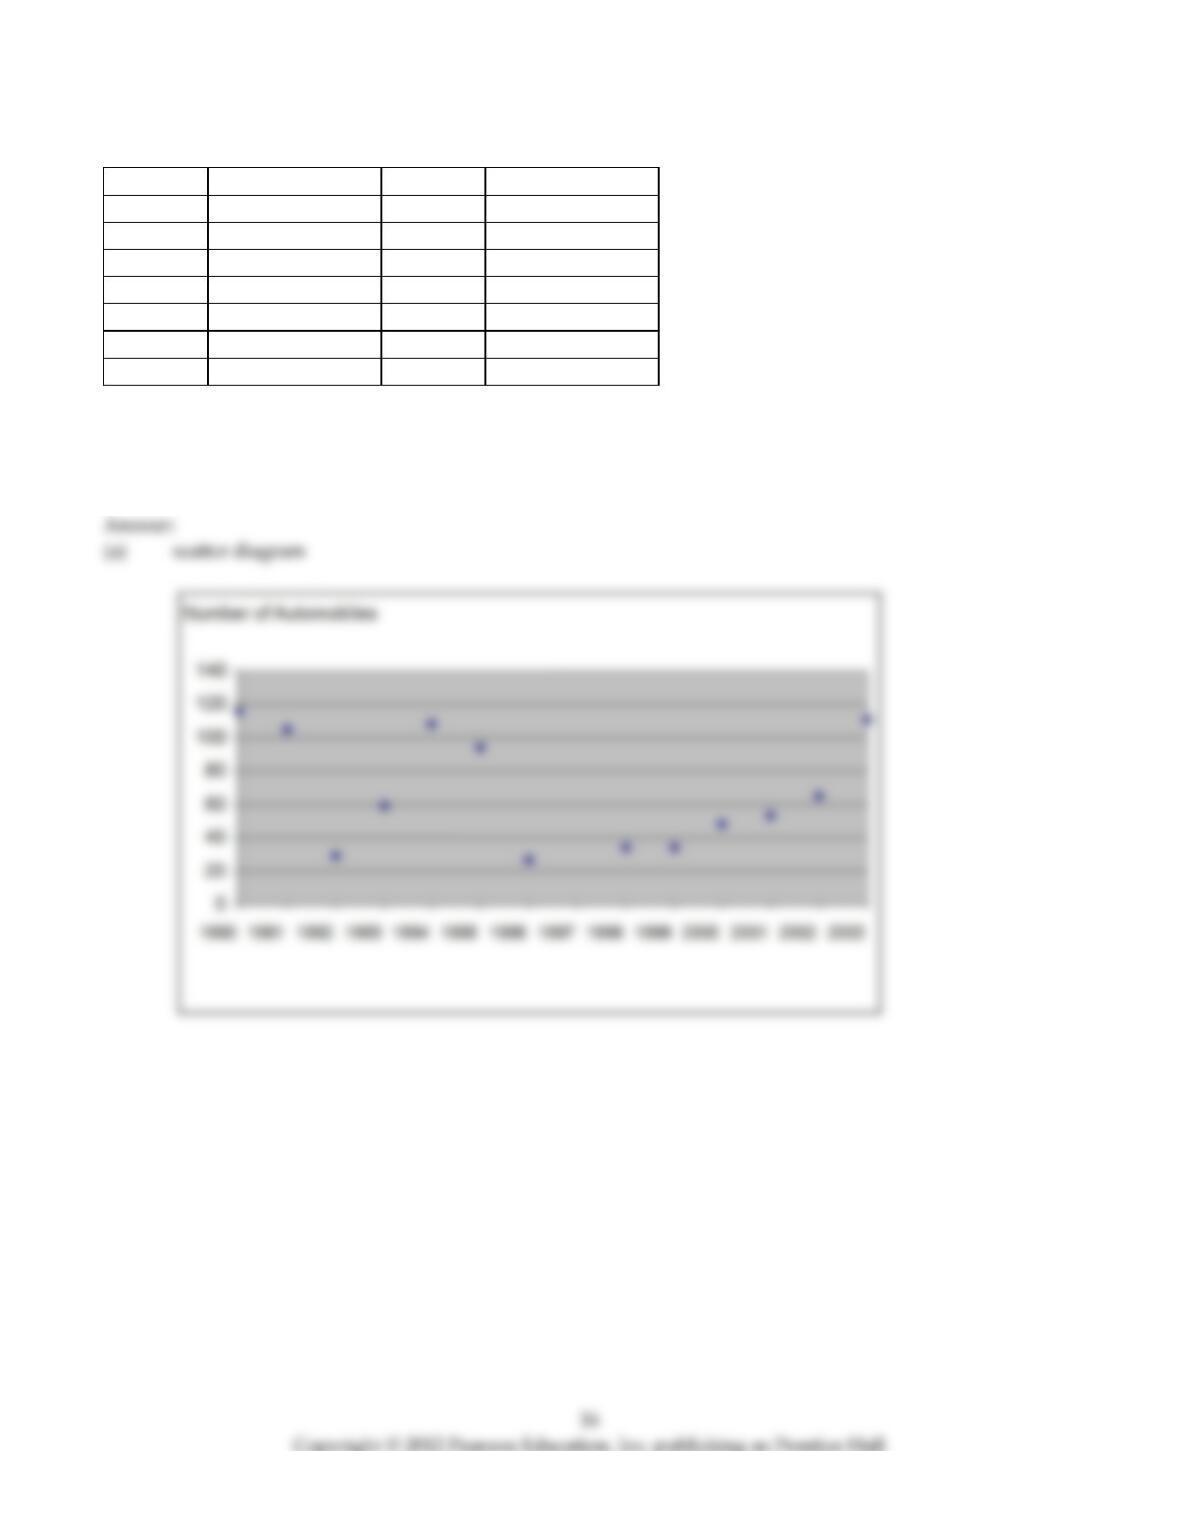
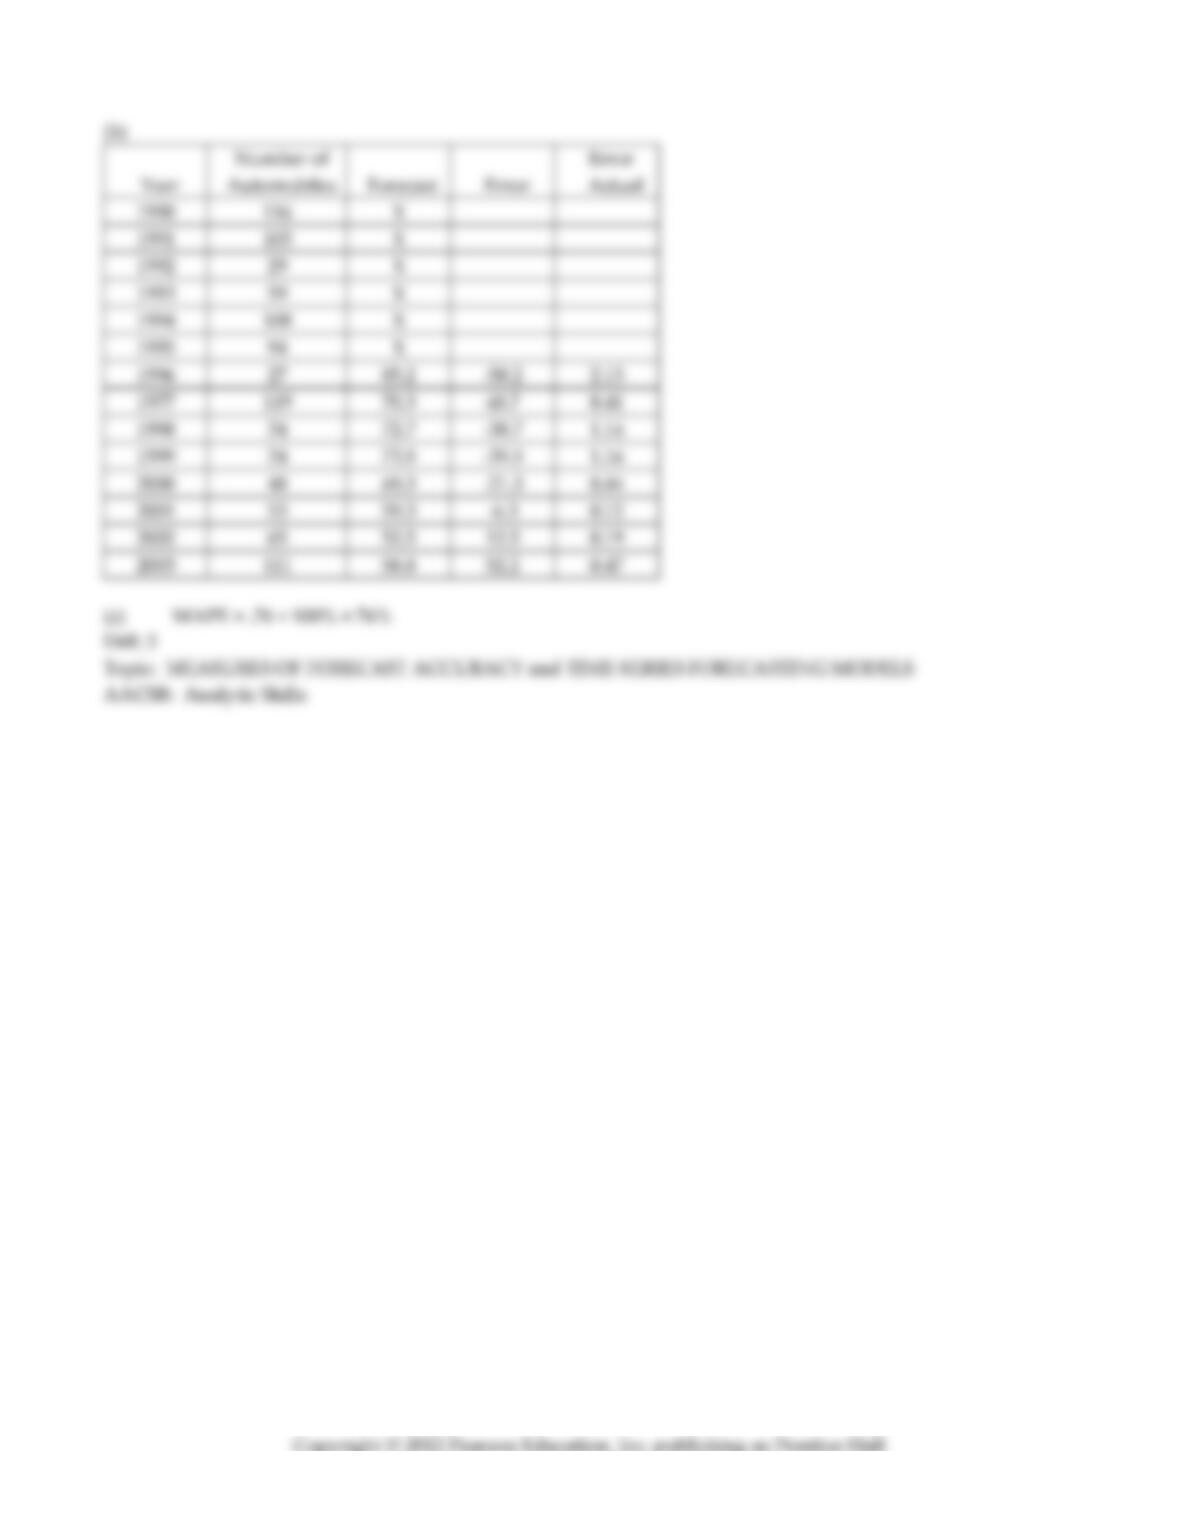
(a) Develop a scatter diagram.
(b) Develop a six–year moving average forecast.
(c) Find MAPE.
17

69) Use simple exponential smoothing with α = 0.3 to forecast battery sales for February through May. Assume
that the forecast for January was for 22 batteries.
Month
Automobile
Battery Sales
January
42
February
33
March
28
April
59
70) Average starting salaries for students using a placement service at a university have been steadily increasing.
A study of the last four graduating classes indicates the following average salaries: $30,000, $32,000, $34,500, and
$36,000 (last graduating class). Predict the starting salary for the next graduating class using a simple exponential
smoothing model with α = 0.25. Assume that the initial forecast was $30,000 (so that the forecast and the actual
were the same).
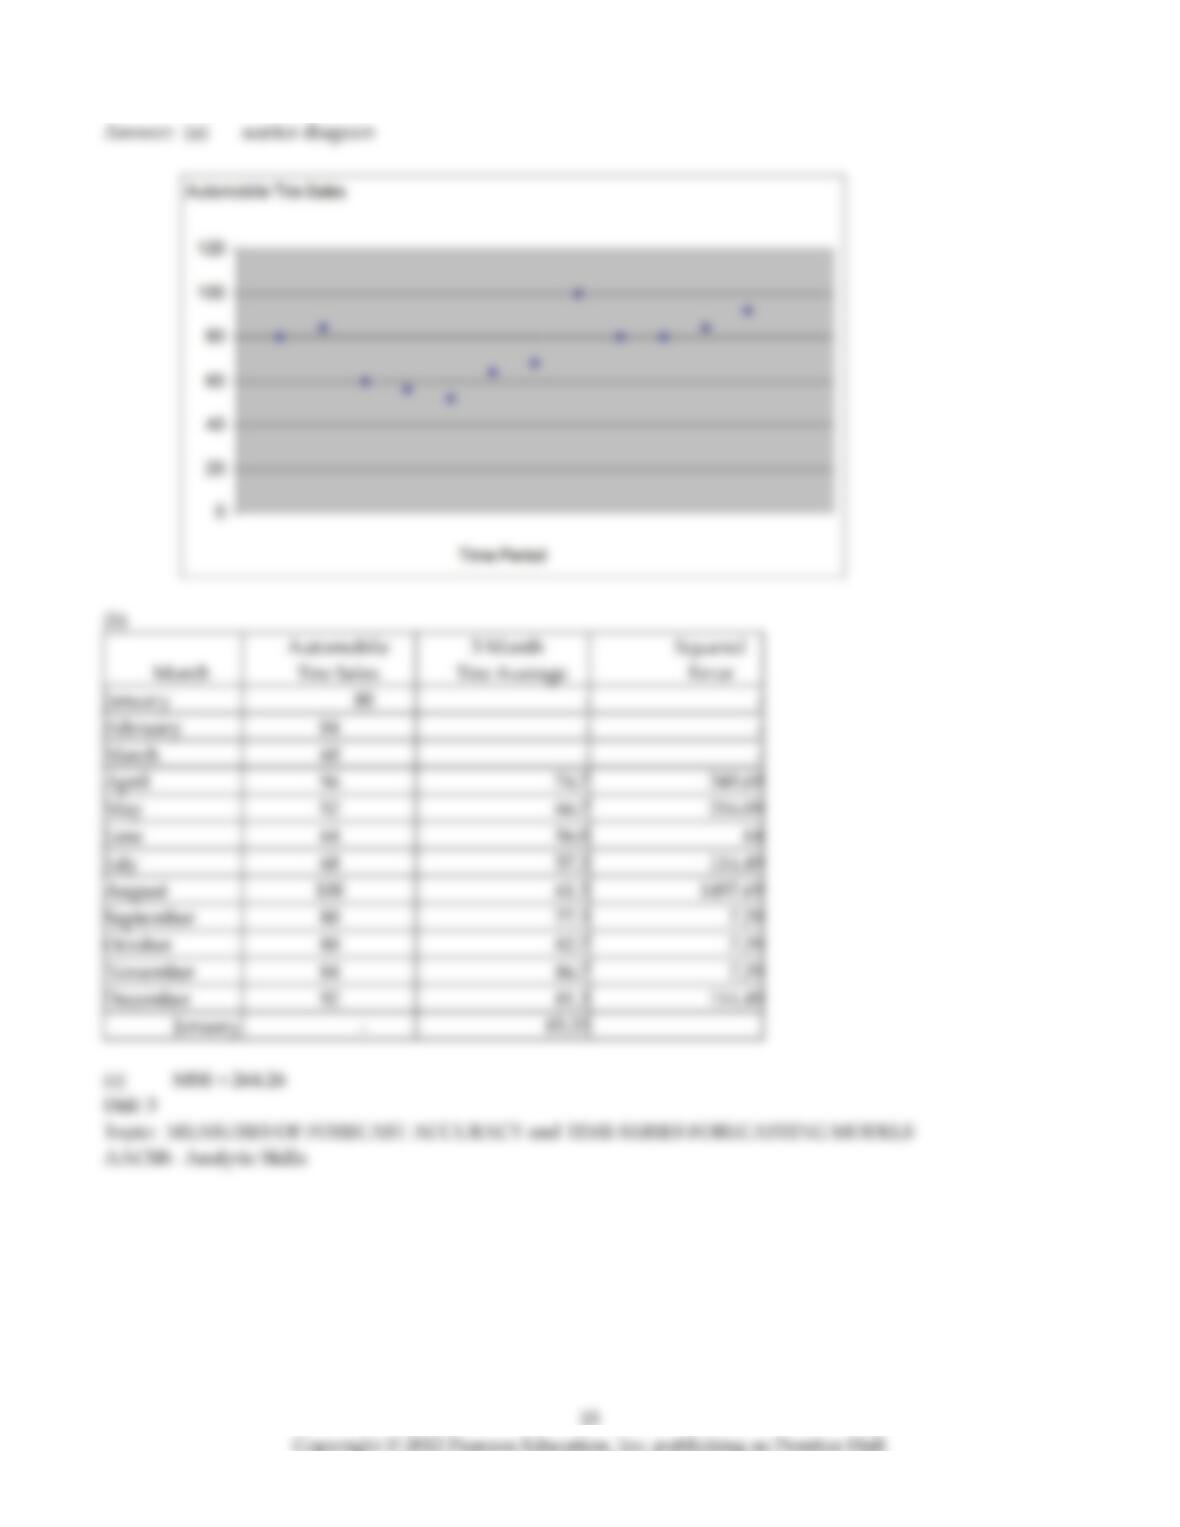
71) Use simple exponential smoothing with α = 0.33 to forecast the tire sales for February through May. Assume
that the forecast for January was for 22 sets of tires.
Month
Automobile
Battery Sales
January
28
February
21
March
39
April
34
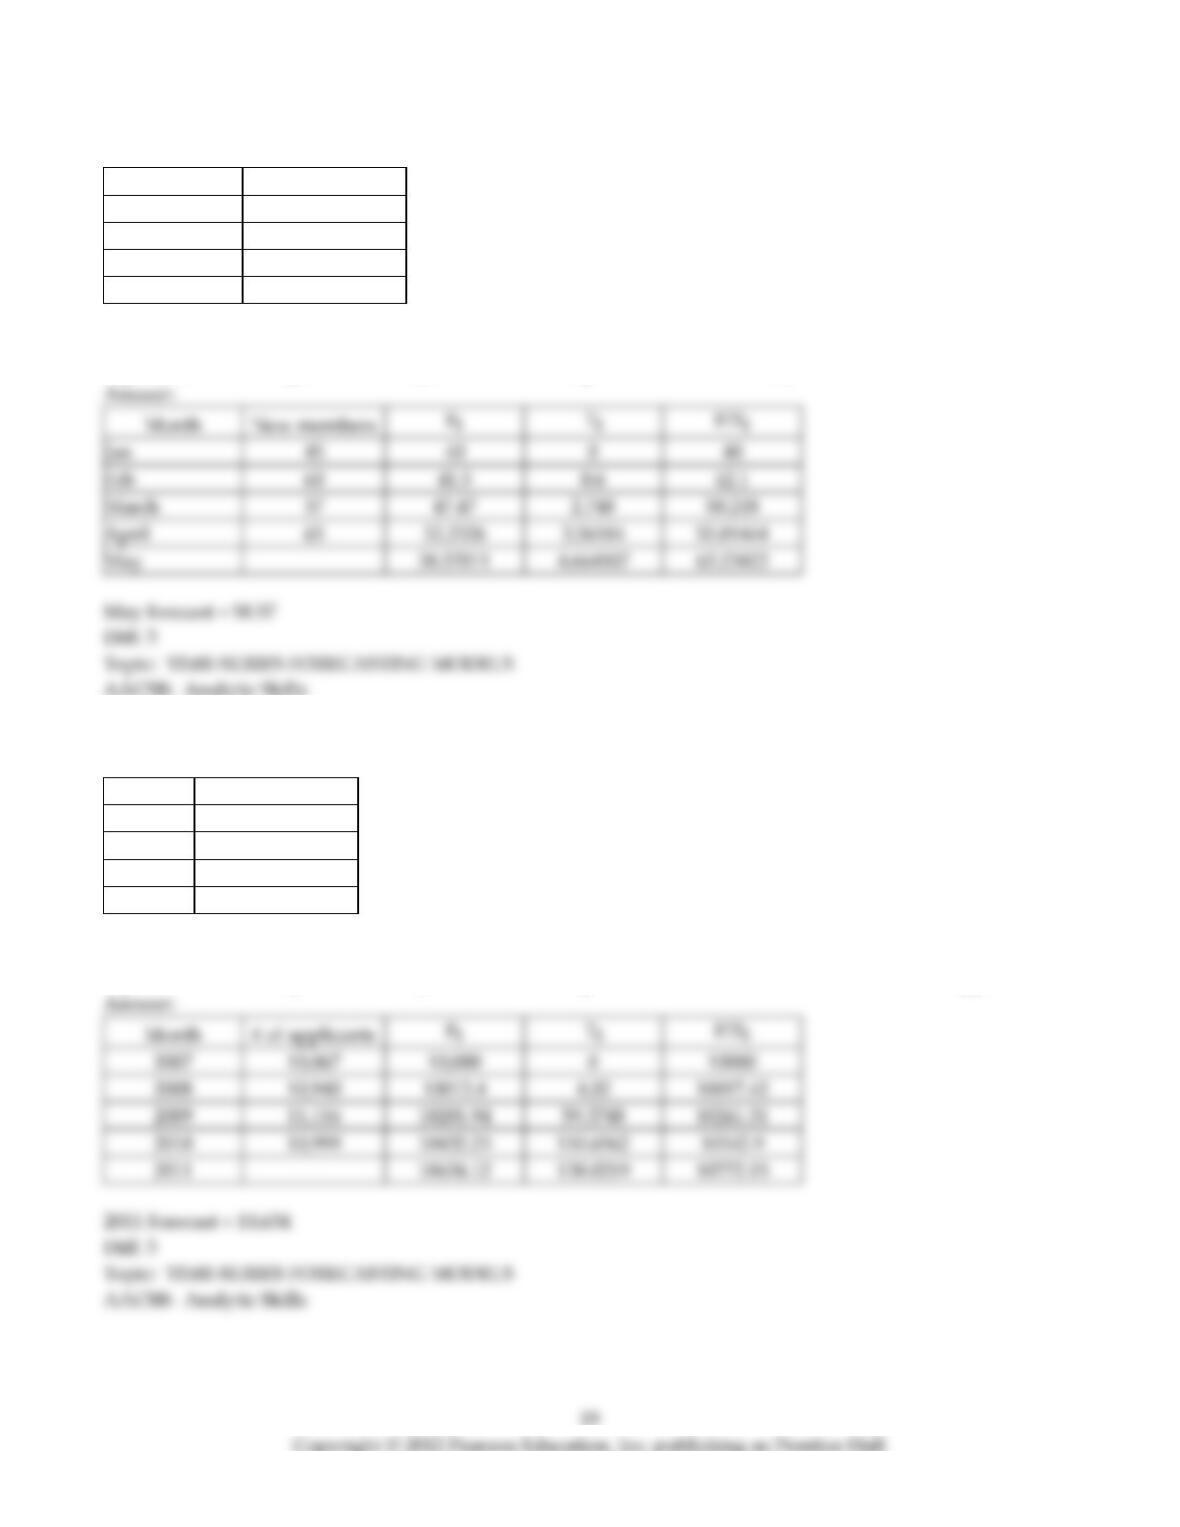
72) The following table represents the new members that have been acquired by a fitness center.
Month
New members
Jan
45
Feb
60
March
57
April
65
Assuming α = 0.3, β = 0.4, an initial forecast of 40 for January, and an initial trend adjustment of 0 for January, use
exponential smoothing with trend adjustment to come up with a forecast for May on new members.
Jan
Feb
March
April
73) The following table represents the number of applicants at popular private college in the last four years.
Month
New members
2007
10,067
2008
10,940
2009
11,116
2010
10,999
Assuming α = 0.2, β = 0.3, an initial forecast of 10,000 for 2007, and an initial trend adjustment of 0 for 2007, use
exponential smoothing with trend adjustment to come up with a forecast for 2011 on the number of applicants.
Month
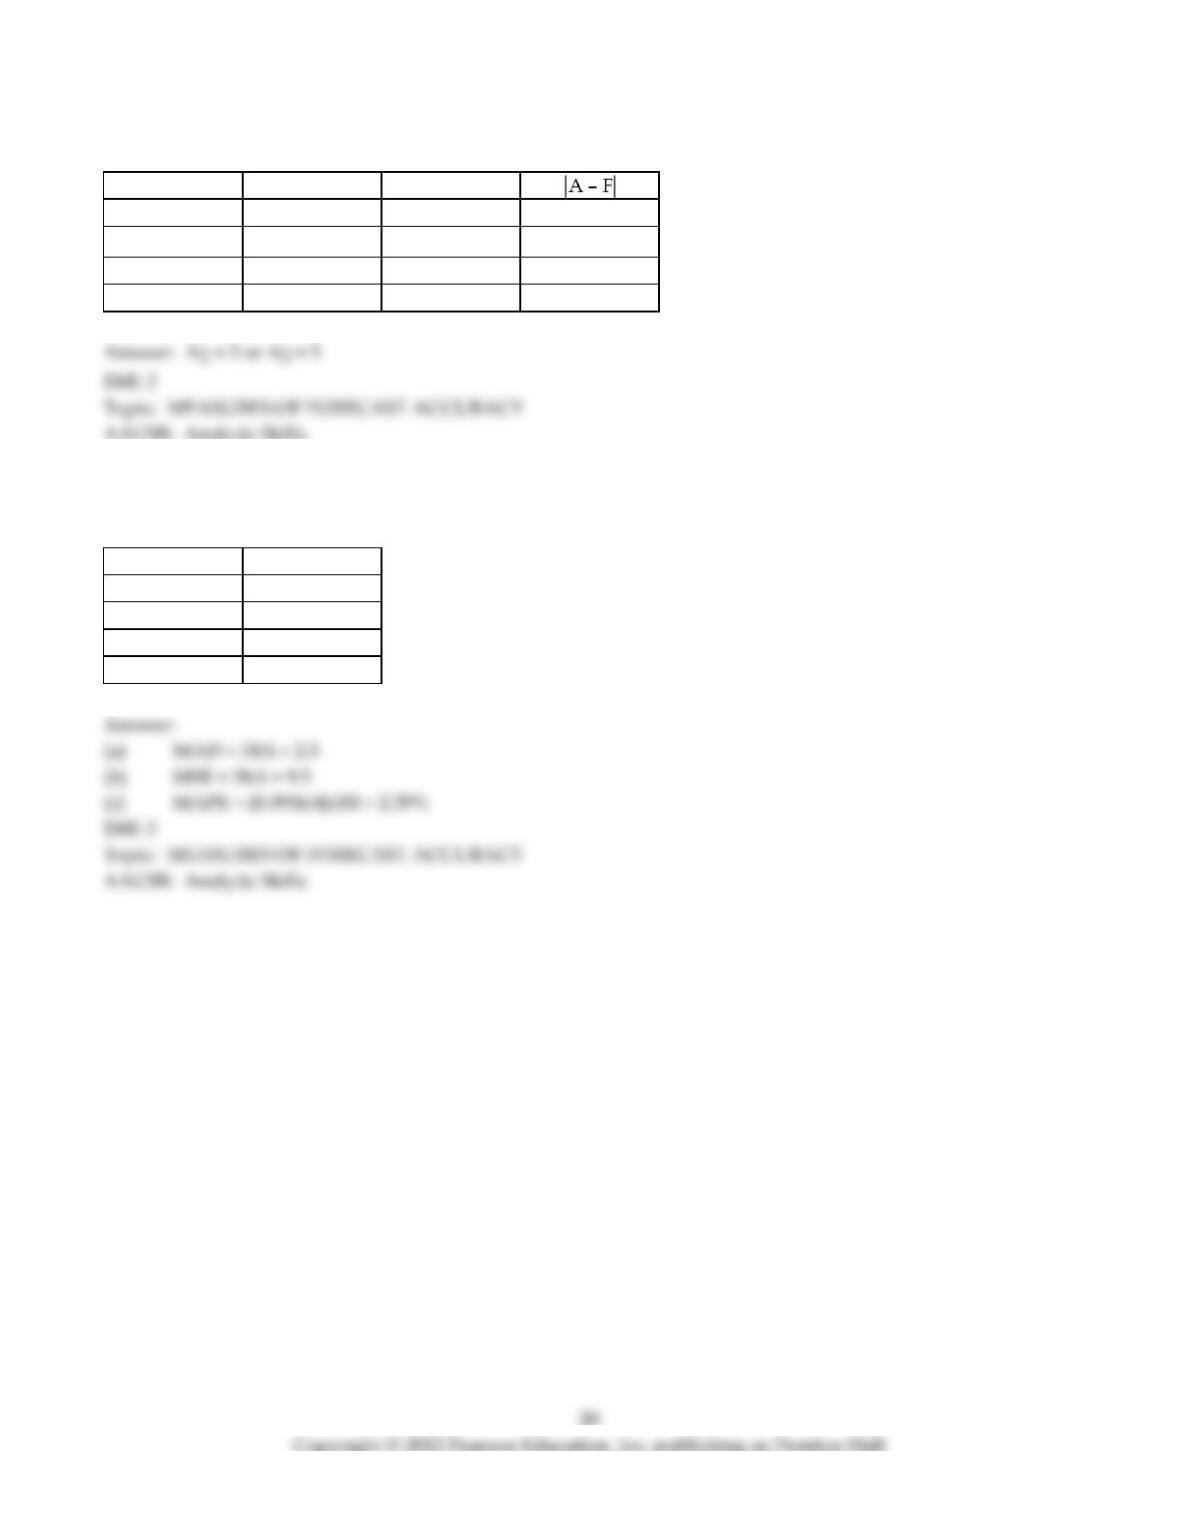
74) Given the following data, if MAD = 1.25, determine what the actual demand must have been in period 2 (A2).
Time Period
Actual (A)
Forecast (F)
1
2
3
1
2
A2 = ?
4
–
3
6
5
1
4
4
6
2
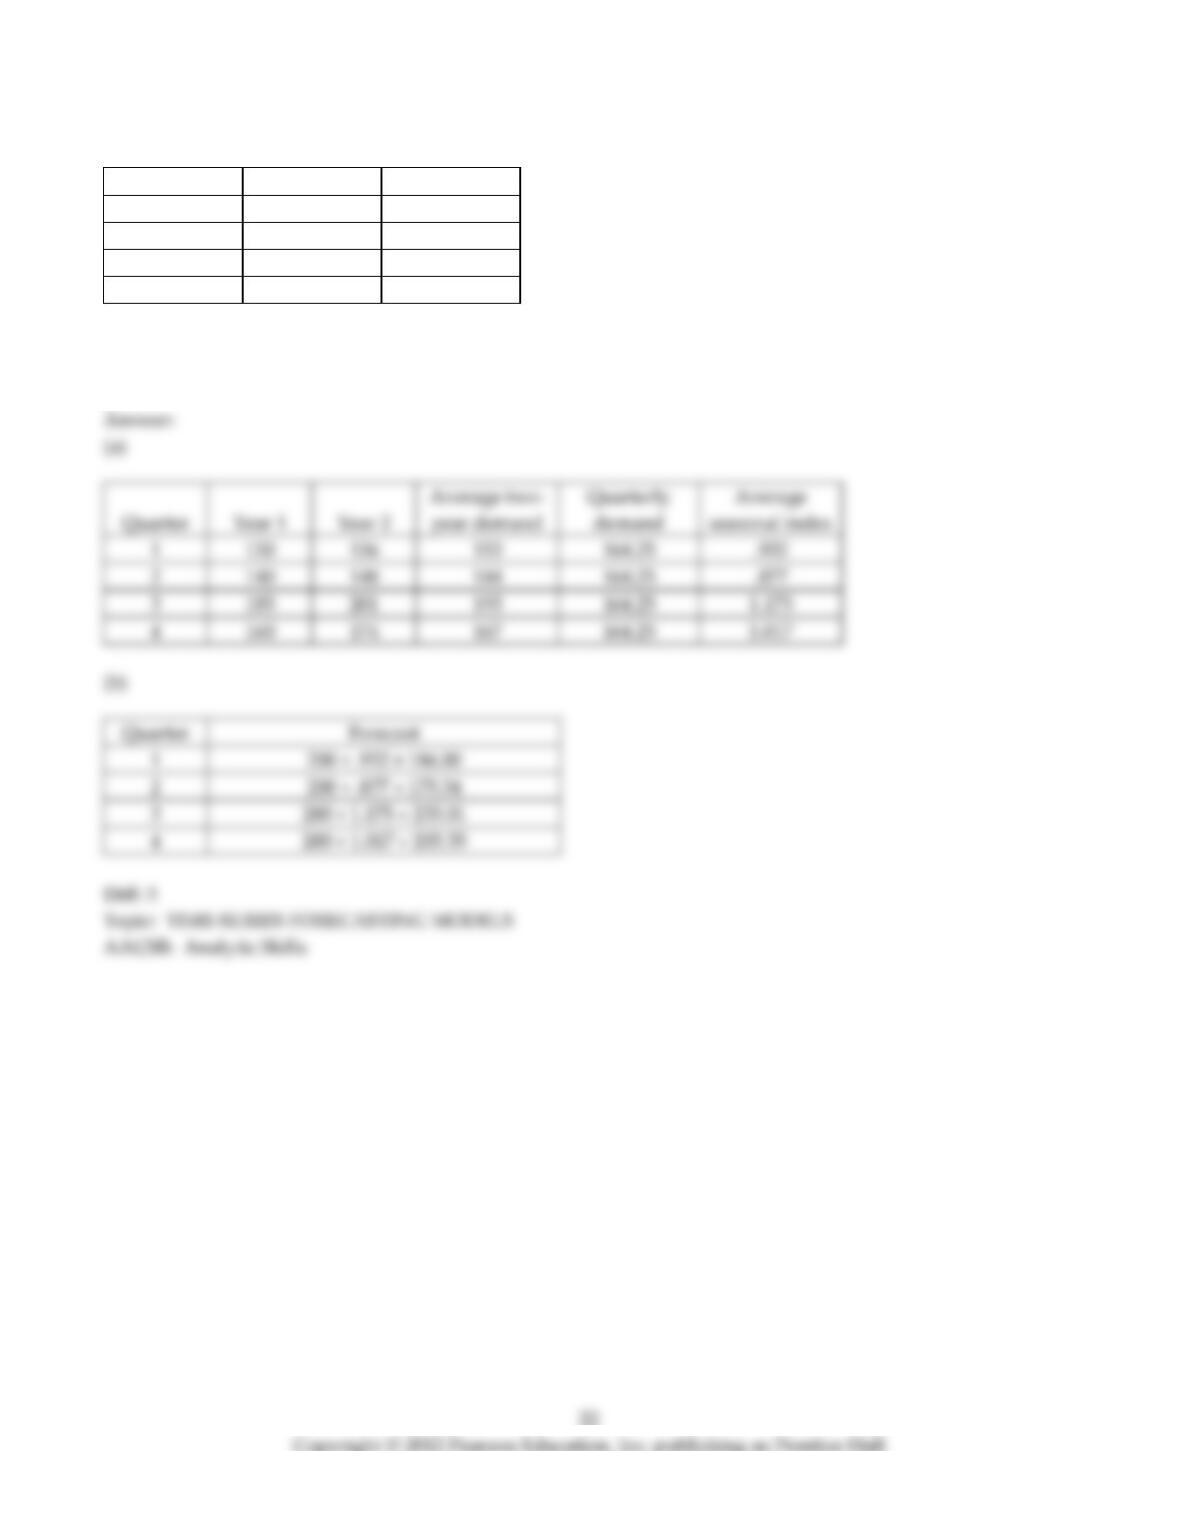
75) Calculate (a) MAD, (b) MSE, and (c) MAPE for the following forecast versus actual sales figures. (Please
round to four decimal places for MAPE.)
Forecast
Actual
100
95
110
108
120
123
130
130

76) Use the sales data given below to determine:
Year
Sales (units)
Year
Sales (units)
1995
130
1999
169
1996
140
2000
182
1997
152
2001
194
1998
160
2002
?
(a) the least squares trend line.
(b) the predicted value for 2002 sales.
(c) the MAD.
(d) the unadjusted forecasting MSE.
77) For the data below:
Year
Automobile
Sales
Year
Automobile
Sales
1990
116
1977
119
1991
105
1998
34
1992
29
1999
34
1993
59
2000
48
1994
108
2001
53
1995
94
2002
65
1996
27
2003
111
(a) Determine the least squares regression line.
(b) Determine the predicted value for 2004.
(c) Determine the MAD.
(d) Determine the unadjusted forecasting MSE.
78) Given the following gasoline data:
Quarter
Year 1
Year 2
1
150
156
2
140
148
3
185
201
4
160
174
(a) Compute the seasonal index for each quarter.
(b) Suppose we expect year 3 to have annual demand of 800. What is the forecast value for each quarter in
year 3?
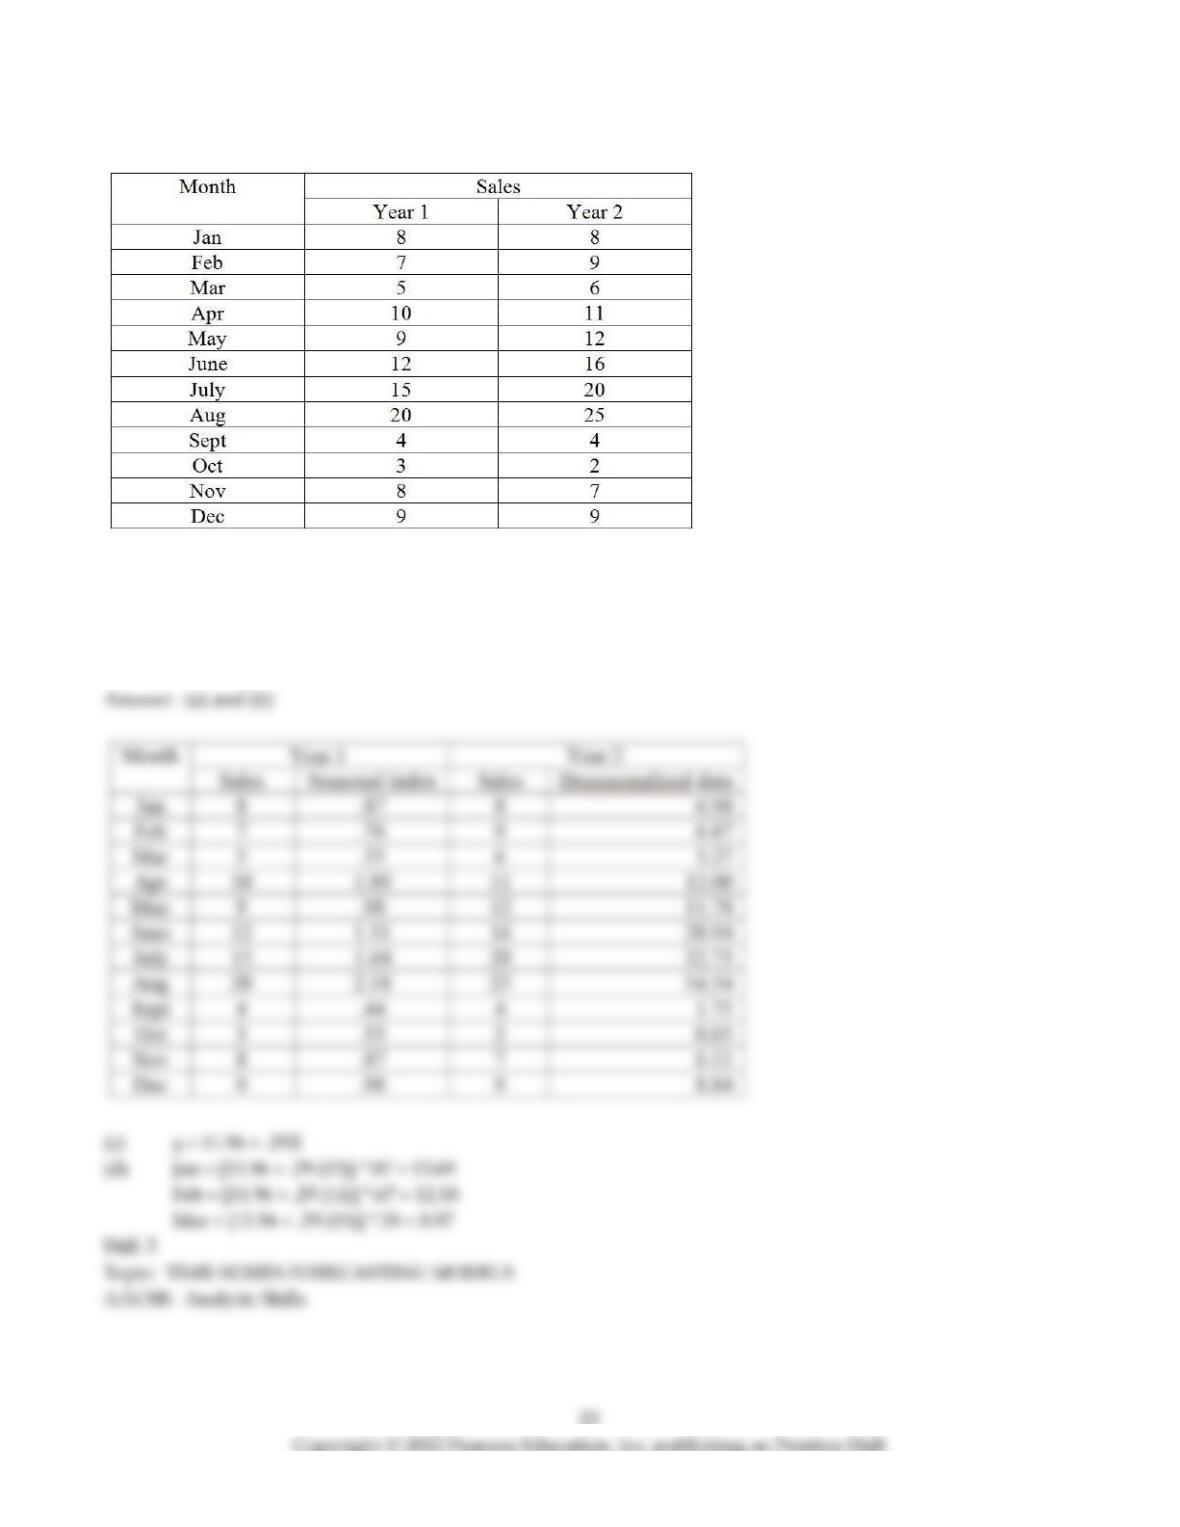
79) Given the following data and seasonal index:
(a) Compute the seasonal index using only year 1 data.
(b) Determine the deseasonalized demand values using year 2 data and year 1’s seasonal indices.
(c) Determine the trend line on year 2’s deseasonalized data.
(d) Forecast the sales for the first 3 months of year 3, adjusting for seasonality.
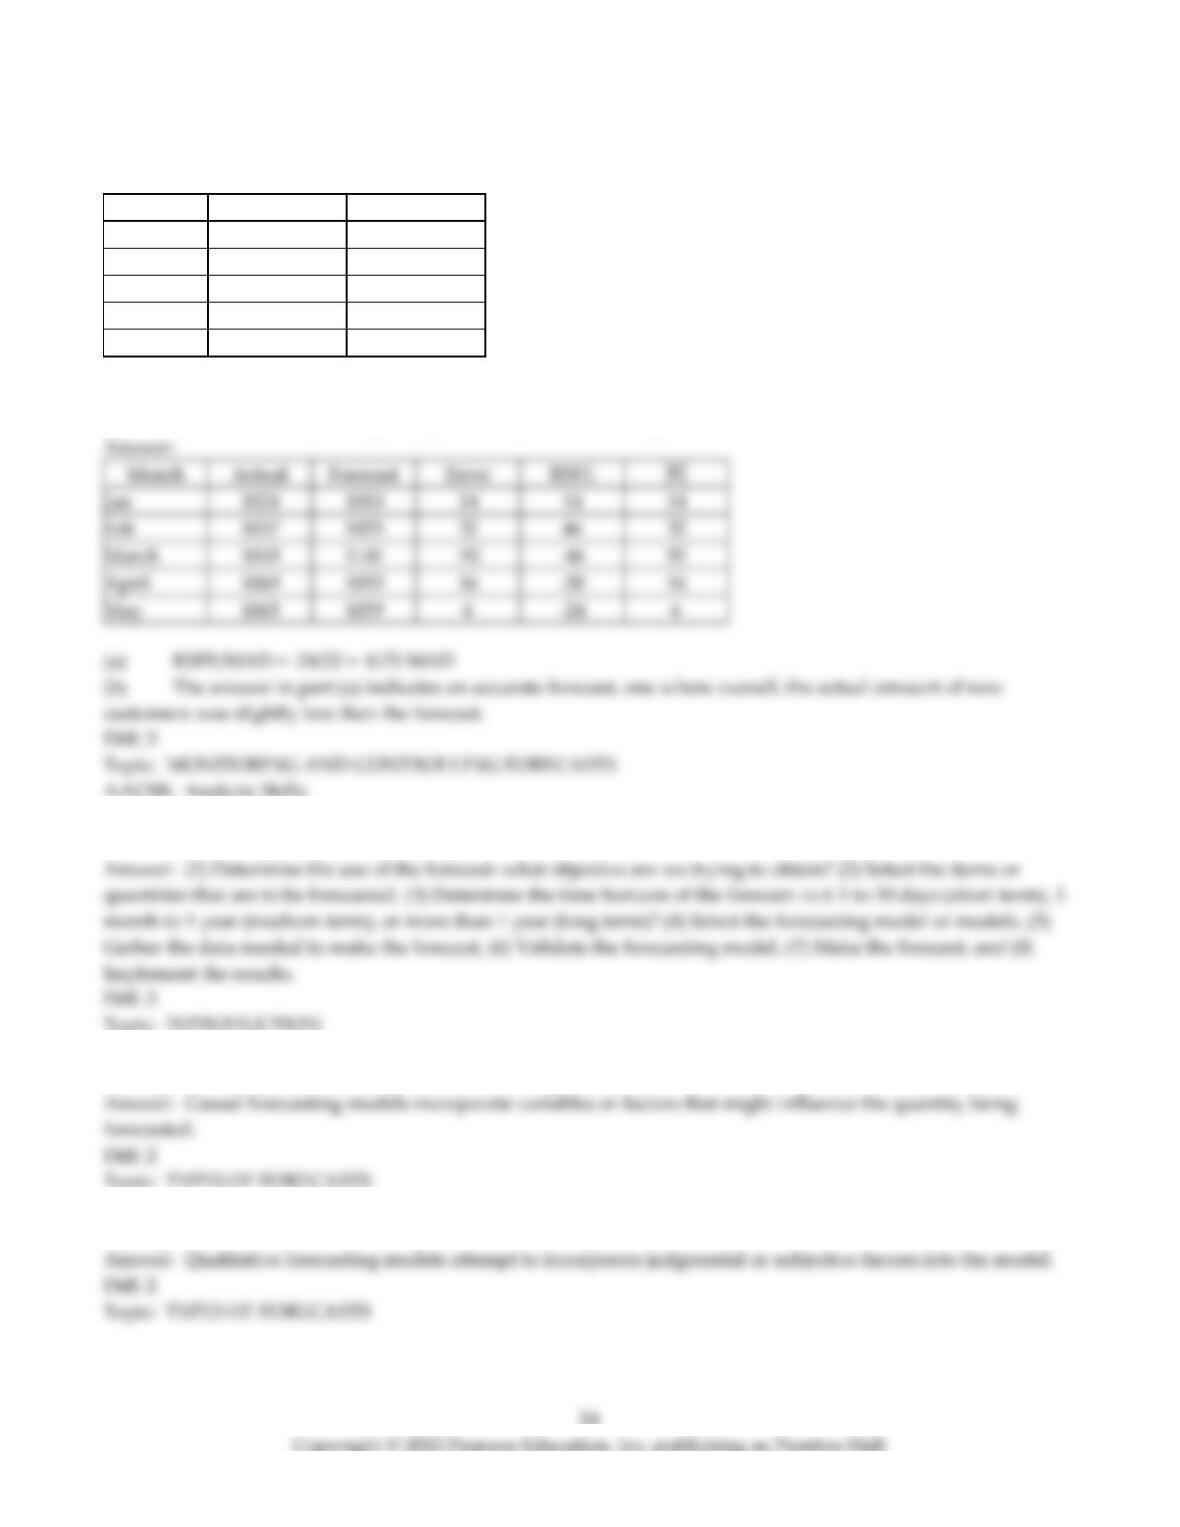
80) The following table represents the actual vs. forecasted amount of new customers acquired by a major credit
card company:
Month
Actual
Forecast
Jan
1024
1010
Feb
1057
1025
March
1049
1141
April
1069
1053
May
1065
1059
(a) What is the tracking signal?
(b) Based on the answer in part (a), comment on the accuracy of this forecast.
Jan
Feb
March
April
81) What are the eight steps to forecasting?
82) In general terms, describe what causal forecasting models are.
83) In general terms, describe what qualitative forecasting models are.

84) Briefly describe the structure of a scatter diagram for a time series.
85) Briefly describe the jury of executive opinion forecasting method.
86) Briefly describe the consumer market survey forecasting method.
87) Describe the naïve forecasting method.
88) Briefly describe why the scatter diagram is helpful.
89) Explain, briefly, why most forecasting error measures use either the absolute or the square of the error.
90) List four measures of historical forecasting errors.
91) In general terms, describe what time–series forecasting models are.
92) List four components of time–series data.
93) Explain, briefly, why the larger number of periods included in a moving average forecast, the less well the
forecast identifies rapid changes in the variable of interest.
94) State the mathematical expression for exponential smoothing.
95) Explain, briefly, why, in the exponential smoothing forecasting method, the larger the value of the smoothing
constant, α, the better the forecast will be in allowing the user to see rapid changes in the variable of interest.
96) In exponential smoothing, discuss the difference between α and β.
97) In general terms, describe the difference between a general linear regression model and a trend projection.
98) In general terms, describe a centered moving average.
99) The decomposition approach to forecasting (using trend and seasonal components) may be helpful when
attempting to forecast a time–series. Could an analogous approach be used in multiple regression analysis?
Explain briefly.

100) What is one advantage of using causal models over time–series or qualitative models?
101) Discuss the use of a tracking signal.