
Quantitative Analysis for Management, 11e (Render)
Chapter 5 Forecasting
1) A medium–term forecast typically covers a two– to four–year time horizon.
2) Regression is always a superior forecasting method to exponential smoothing, so regression should be used
whenever the appropriate software is available.
3) The three categories of forecasting models are time series, quantitative, and qualitative.
4) Time–series models attempt to predict the future by using historical data.
5) Time–series models rely on judgment in an attempt to incorporate qualitative or subjective factors into the
forecasting model.
6) A moving average forecasting method is a causal forecasting method.
7) An exponential forecasting method is a time–series forecasting method.
8) A trend–projection forecasting method is a causal forecasting method.

9) Qualitative models produce forecasts that are little better than simple guesses or coin tosses.
10) The most common quantitative causal model is regression analysis.
11) Qualitative models attempt to incorporate judgmental or subjective factors into the forecasting model.
12) A scatter diagram is useful to determine if a relationship exists between two variables.
13) The Delphi method solicits input from customers or potential customers regarding their future purchasing
plans.
14) The naïve forecast for the next period is the actual value observed in the current period.
15) Mean absolute deviation (MAD) is simply the sum of forecast errors.
16) Time–series models enable the forecaster to include specific representations of various qualitative and
quantitative factors.
17) Four components of time series are trend, moving average, exponential smoothing, and seasonality.

18) The fewer the periods over which one takes a moving average, the more accurately the resulting forecast
mirrors the actual data of the most recent time periods.
19) In a weighted moving average, the weights assigned must sum to 1.
20) A scatter diagram for a time series may be plotted on a two–dimensional graph with the horizontal axis
representing the variable to be forecast (such as sales).
21) Scatter diagrams can be useful in spotting trends or cycles in data over time.
22) Exponential smoothing cannot be used for data with a trend.
23) In a second order exponential smoothing, a low β gives less weight to more recent trends.
24) An advantage of exponential smoothing over a simple moving average is that exponential smoothing requires
one to retain less data.
25) When the smoothing constant α = 0, the exponential smoothing model is equivalent to the naïve forecasting
model.

Topic: TIME–SERIES FORECASTING MODELS
27) A seasonal index of 1 means that the season is average.
28) The process of isolating linear trend and seasonal factors to develop a more accurate forecast is called
regression.
29) When the smoothing constant α = 1, the exponential smoothing model is equivalent to the naïve forecasting
model.
30) Adaptive smoothing is analogous to exponential smoothing where the coefficients α and β are periodically
updated to improve the forecast.
31) Bias is the average error of a forecast model.
32) Which of the following is not classified as a qualitative forecasting model?
A) exponential smoothing
B) Delphi method
C) jury of executive opinion
D) sales force composite
E) consumer market survey
33) A judgmental forecasting technique that uses decision makers, staff personnel, and respondent to determine a
forecast is called
A) exponential smoothing.
B) the Delphi method.
C) jury of executive opinion.
D) sales force composite.
E) consumer market survey.

5
34) Which of the following is considered a causal method of forecasting?
A) exponential smoothing
B) moving average
C) Holt’s method
D) Delphi method
E) None of the above
35) A graphical plot with sales on the Y axis and time on the X axis is a
A) catter diagram.
B) trend projection.
C) radar chart.
D) line graph.
E) bar chart.
36) Which of the following statements about scatter diagrams is true?
A) Time is always plotted on the y–axis.
B) It can depict the relationship among three variables simultaneously.
C) It is helpful when forecasting with qualitative data.
D) The variable to be forecasted is placed on the y–axis.
E) It is not a good tool for understanding time–series data.
37) Which of the following is a technique used to determine forecasting accuracy?
A) exponential smoothing
B) moving average
C) regression
D) Delphi method
E) mean absolute percent error
38) A medium–term forecast is considered to cover what length of time?
A) 2–4 weeks
B) 1 month to 1 year
C) 2–4 years
D) 5–10 years
E) 20 years

39) When is the exponential smoothing model equivalent to the naïve forecasting model?
A) α = 0
B) α = 0.5
C) α = 1
D) during the first period in which it is used
E) never
40) Enrollment in a particular class for the last four semesters has been 120, 126, 110, and 130. Suppose a one–
semester moving average was used to forecast enrollment (this is sometimes referred to as a naïve forecast).
Thus, the forecast for the second semester would be 120, for the third semester it would be 126, and for the last
semester it would be 110. What would the MSE be for this situation?
A) 196.00
B) 230.67
C) 100.00
D) 42.00
E) None of the above
41) Which of the following methods tells whether the forecast tends to be too high or too low?
A) MAD
B) MSE
C) MAPE
D) decomposition
E) bias
42) Assume that you have tried three different forecasting models. For the first, the MAD = 2.5, for the second,
the MSE = 10.5, and for the third, the MAPE = 2.7. We can then say:
A) the third method is the best.
B) the second method is the best.
C) methods one and three are preferable to method two.
D) method two is least preferred.
E) None of the above

43) Which of the following methods gives an indication of the percentage of forecast error?
A) MAD
B) MSE
C) MAPE
D) decomposition
E) bias
44) Daily demand for newspapers for the last 10 days has been as follows: 12, 13, 16, 15, 12, 18, 14, 12, 13, 15 (listed
from oldest to most recent). Forecast sales for the next day using a two–day moving average.
A) 14
B) 13
C) 15
D) 28
E) 12.5
45) As one increases the number of periods used in the calculation of a moving average,
A) greater emphasis is placed on more recent data.
B) less emphasis is placed on more recent data.
C) the emphasis placed on more recent data remains the same.
D) it requires a computer to automate the calculations.
E) one is usually looking for a long–term prediction.
46) Enrollment in a particular class for the last four semesters has been 122, 128, 100, and 155 (listed from oldest to
most recent). The best forecast of enrollment next semester, based on a three–semester moving average, would be
A) 116.7.
B) 126.3.
C) 168.3.
D) 135.0.
E) 127.7.

47) Which of the following methods produces a particularly stiff penalty in periods with large forecast errors?
A) MAD
B) MSE
C) MAPE
D) decomposition
E) bias
48) Sales for boxes of Girl Scout cookies over a 4–month period were forecasted as follows: 100, 120, 115, and 123.
The actual results over the 4–month period were as follows: 110, 114, 119, 115. What was the MAD of the 4–month
forecast?
A) 0
B) 5
C) 7
D) 108
E) None of the above
49) Sales for boxes of Girl Scout cookies over a 4–month period were forecasted as follows: 100, 120, 115, and 123.
The actual results over the 4–month period were as follows: 110, 114, 119, 115. What was the MSE of the 4–month
forecast?
A) 0
B) 5
C) 7
D) 108
E) None of the above
50) Daily demand for newspapers for the last 10 days has been as follows: 12, 13, 16, 15, 12, 18, 14, 12, 13, 15 (listed
from oldest to most recent). Forecast sales for the next day using a three–day weighted moving average where the
weights are 3, 1, and 1 (the highest weight is for the most recent number).
A) 12.8
B) 13.0
C) 70.0
D) 14.0
E) None of the above

51) Daily demand for newspapers for the last 10 days has been as follows: 12, 13, 16, 15, 12, 18, 14, 12, 13, 15 (listed
from oldest to most recent). Forecast sales for the next day using a two–day weighted moving average where the
weights are 3 and 1 are
A) 14.5.
B) 13.5.
C) 14.
D) 12.25.
E) 12.75.
52) Which of the following is not considered to be one of the components of a time series?
A) trend
B) seasonality
C) variance
D) cycles
E) random variations
53) Enrollment in a particular class for the last four semesters has been 120, 126, 110, and 130 (listed from oldest to
most recent). Develop a forecast of enrollment next semester using exponential smoothing with an alpha = 0.2.
Assume that an initial forecast for the first semester was 120 (so the forecast and the actual were the same).
A) 118.96
B) 121.17
C) 130
D) 120
E) None of the above
54) Demand for soccer balls at a new sporting goods store is forecasted using the following regression equation: Y
= 98 + 2.2X where X is the number of months that the store has been in existence. Let April be represented by X =
4. April is assumed to have a seasonality index of 1.15. What is the forecast for soccer ball demand for the month
of April (rounded to the nearest integer)?
A) 123
B) 107
C) 100
D) 115
E) None of the above

55) A time–series forecasting model in which the forecast for the next period is the actual value for the current
period is the
A) Delphi model.
B) Holt’s model.
C) naïve model.
D) exponential smoothing model.
E) weighted moving average.
56) In picking the smoothing constant for an exponential smoothing model, we should look for a value that
A) produces a nice–looking curve.
B) equals the utility level that matches with our degree of risk aversion.
C) produces values which compare well with actual values based on a standard measure of error.
D) causes the least computational effort.
E) None of the above
57) In the exponential smoothing with trend adjustment forecasting method, is the
A) slope of the trend line.
B) new forecast.
C) Y–axis intercept.
D) independent variable.
E) trend smoothing constant.
58) The computer monitoring of tracking signals and self–adjustment is referred to as
A) exponential smoothing.
B) adaptive smoothing.
C) trend projections.
D) trend smoothing.
E) running sum of forecast errors (RFSE).

59) Which of the following is not a characteristic of trend projections?
A) The variable being predicted is the Y variable.
B) Time is the X variable.
C) It is useful for predicting the value of one variable based on time trend.
D) A negative intercept term always implies that the dependent variable is decreasing over time.
E) They are often developed using linear regression.
60) When both trend and seasonal components are present in time series, which of the following is most
appropriate?
A) the use of centered moving averages
B) the use of moving averages
C) the use of simple exponential smoothing
D) the use of weighted moving averages
E) the use of double smoothing
61) A tracking signal was calculated for a particular set of demand forecasts. This tracking signal was positive.
This would indicate that
A) demand is greater than the forecast.
B) demand is less than the forecast.
C) demand is equal to the forecast.
D) the MAD is negative.
E) None of the above
62) A seasonal index of ________ indicates that the season is average.
A) 10
B) 100
C) 0.5
D) 0
E) 1
63) The errors in a particular forecast are as follows: 4, –3, 2, 5, –1. What is the tracking signal of the forecast?
A) 0.4286
B) 2.3333
C) 5
D) 1.4
E) 2.5
64) Demand for a particular type of battery fluctuates from one week to the next. A study of the last six weeks
provides the following demands (in dozens): 4, 5, 3, 2, 8, 10 (last week).
(a) Forecast demand for the next week using a two–week moving average.
(b) Forecast demand for the next week using a three–week moving average.
65) Daily high temperatures in the city of Houston for the last week have been: 93, 94, 93, 95, 92, 86, 98
(yesterday).
(a) Forecast the high temperature today using a three–day moving average.
(b) Forecast the high temperature today using a two–day moving average.
(c) Calculate the mean absolute deviation based on a two–day moving average, covering all days in which
you can have a forecast and an actual temperature.
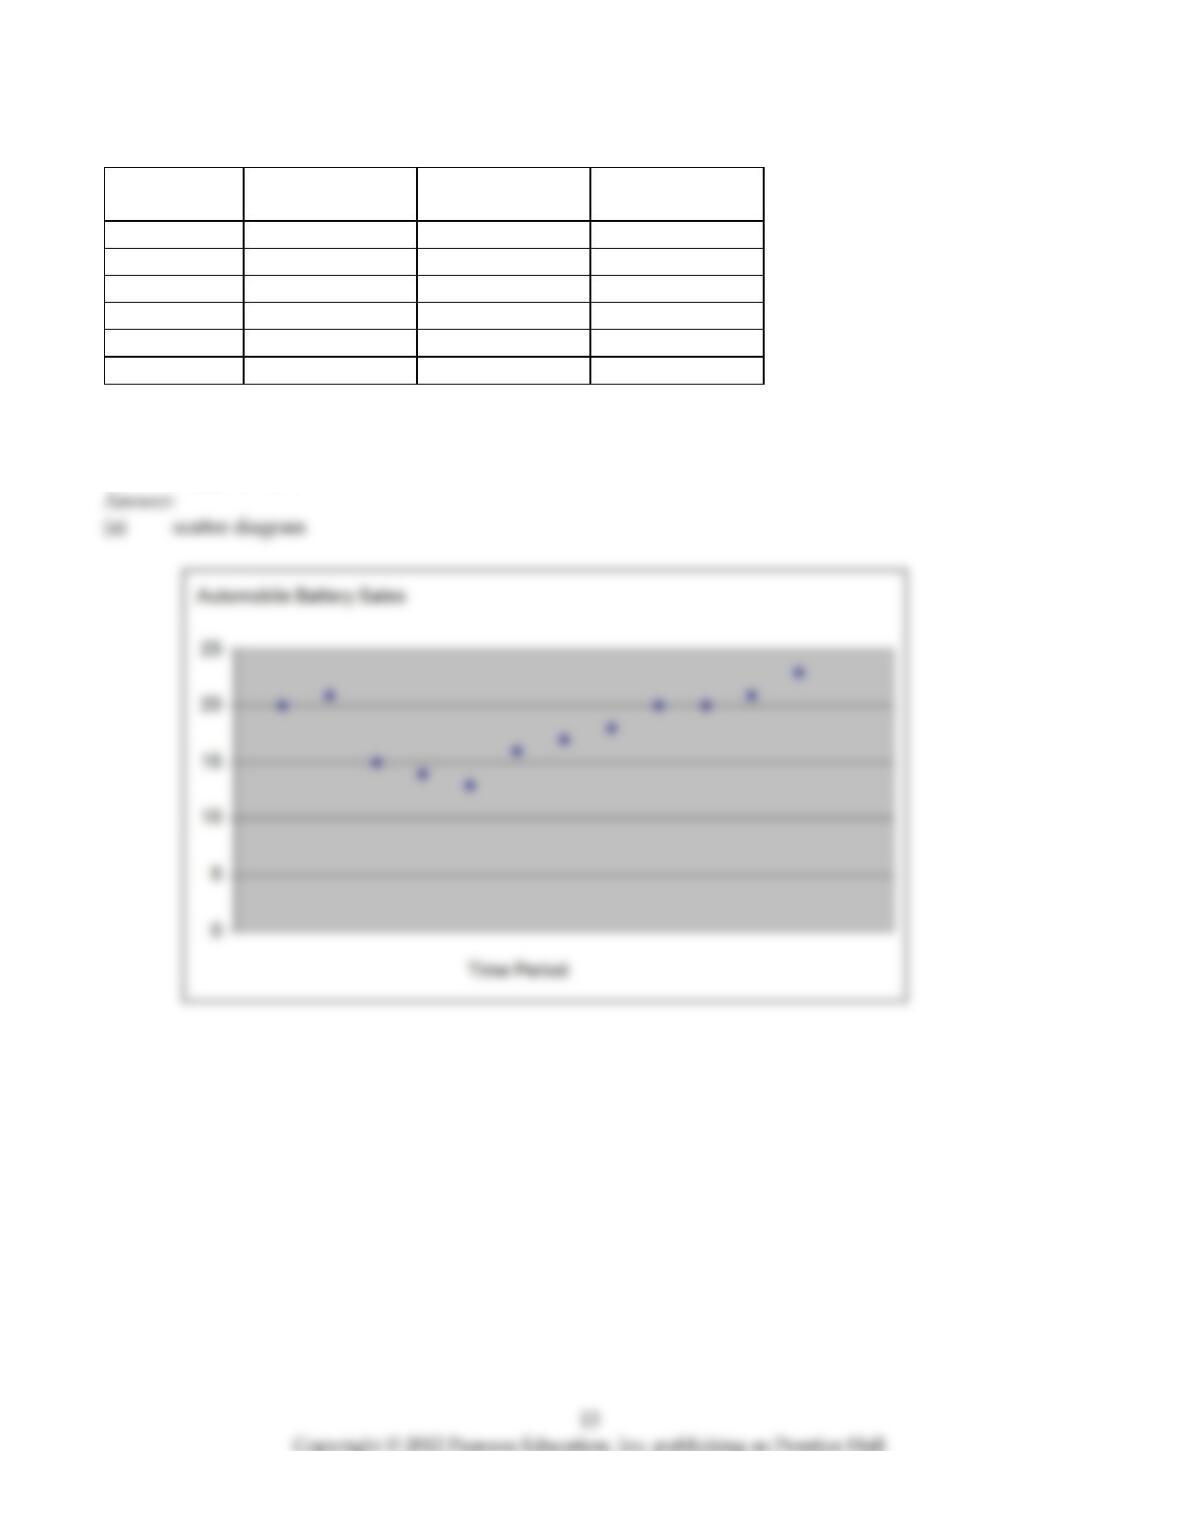
66) For the data below:
Month
Automobile
Battery Sales
Month
Automobile
Battery Sales
January
20
July
17
February
21
August
18
March
15
September
20
April
14
October
20
May
13
November
21
June
16
December
23
(a) Develop a scatter diagram.
(b) Develop a three–month moving average.
(c) Compute MAD.

14
(b)
January
February
21
March
15
April
14
13
June
16
July
17
August
18
September
20
October
20
November
21
December
23
January
67) For the data below:
Month
Automobile
Tire Sales
Month
Automobile
Tire Sales
January
80
July
68
February
84
August
100
March
60
September
80
April
56
October
80
May
52
November
84
June
64
December
92
(a) Develop a scatter diagram.
(b) Compute a three–month moving average.
(c) Compute the MSE.