Quantitative Analysis for Management, 11e (Render)
Chapter 4 Regression Models
1) In regression, an independent variable is sometimes called a response variable.
2) One purpose of regression is to understand the relationship between variables.
3) One purpose of regression is to predict the value of one variable based on the other variable.
4) The variable to be predicted is the dependent variable.
5) The dependent variable is also called the response variable.
6) A scatter diagram is a graphical depiction of the relationship between the dependent and independent
variables.
7) In a scatter diagram, the dependent variable is typically plotted on the horizontal axis.
8) There is no relationship between variables unless the data points lie in a straight line.
9) In any regression model, there is an implicit assumption that a relationship exists between the variables.
10) In regression, there is random error that can be predicted.
11) Estimates of the slope, intercept, and error of a regression model are found from sample data.
12) Error is the difference in the actual value and the predicted value.
13) The regression line minimizes the sum of the squared errors.
14) In regression, a dependent variable is sometimes called a predictor variable.
15) Summing the error values in a regression model is misleading because negative errors cancel out positive
errors.
16) The SST measures the total variability in the dependent variable about the regression line.
17) The SSE measures the total variability in the independent variable about the regression line.
18) The SSR indicates how much of the total variability in the dependent variable is explained by the regression
model.
20) The coefficient of determination gives the proportion of the variability in the dependent variable that is
explained by the regression equation.
21) The correlation coefficient has values between −1 and +1.
22) Errors are also called residuals.
23) The regression model assumes the error terms are dependent.
24) The regression model assumes the errors are normally distributed.
25) The errors in a regression model are assumed to have an increasing mean.
26) The errors in a regression model are assumed to have zero variance.
27) If the assumptions of regression have been met, errors plotted against the independent variable will typically
show patterns.
28) Often, a plot of the residuals will highlight any glaring violations of the assumptions.
29) The error standard deviation is estimated by MSE.
30) The standard error of the estimate is also called the variance of the regression.
31) An F–test is used to determine if there is a relationship between the dependent and independent variables.
32) The null hypothesis in the F–test is that there is a linear relationship between the X and Y variables.
33) If the significance level for the F–test is high enough, there is a relationship between the dependent and
independent variables.
34) When the significance level is small enough in the F–test, we can reject the null hypothesis that there is no
linear relationship.
35) The coefficients of each independent variable in a multiple regression model represent slopes.
36) For statistical tests of significance about the coefficients, the null hypothesis is that the slope is 1.
37) Both the p–value for the F–test and r2 can be interpreted the same with multiple regression models as they are
with simple linear models.
38) The multiple regression model includes several dependent variables.
39) In regression, a binary variable is also called an indicator variable.
40) Another name for a dummy variable is a binary variable.
41) The best model is a statistically significant model with a high r–square and few variables.
42) The adjusted r2 will always increase as additional variables are added to the model.
43) The value of r2 can never decrease when more variables are added to the model.
44) A variable should be added to the model regardless of the impact (increase or decrease) on the adjusted r2
value.
45) Multicollinearity exists when a variable is correlated to other variables.
46) If multicollinearity exists, then individual interpretation of the variables is questionable, but the overall model
is still good for prediction purposes.
47) Transformations may be used when nonlinear relationships exist between variables.
48) A high correlation always implies that one variable is causing a change in the other variable.
49) A dummy variable can be assigned up to three values.
50) Which of the following statements is true regarding a scatter diagram?
A) It provides very little information about the relationship between the regression variables.
B) It is a plot of the independent and dependent variables.
C) It is a line chart of the independent and dependent variables.
D) It has a value between –1 and +1.
E) It gives the percent of variation in the dependent variable that is explained by the independent variable.
51) The random error in a regression equation
A) is the predicted error.
B) includes both positive and negative terms.
C) will sum to a large positive number.
D) is used the estimate the accuracy of the slope.
E) is maximized in a least squares regression model.
52) Which of the following statements (are) is not true about regression models?
A) Estimates of the slope are found from sample data.
B) The regression line minimizes the sum of the squared errors.
C) The error is found by subtracting the actual data value from the predicted data value.
D) The dependent variable is the explanatory variable.
E) The intercept coefficient is not typically interpreted.
53) Which of the following equalities is correct?
A) SST = SSR + SSE
B) SSR = SST + SSE
C) SSE = SSR + SST
D) SST = SSC + SSR
E) SSE = Actual Value – Predicted Value
54) The sum of squared error (SSE) is
A) a measure of the total variation in Y about the mean.
B) a measure of the total variation in X about the mean.
C) a measure in the variation of Y about the regression line.
D) a measure in the variation of X about the regression line.
E) None of the above
55) If computing a causal linear regression model of Y = a + bX and the resultant r2 is very near zero, then one
would be able to conclude that
A) Y = a + bX is a good forecasting method.
B) Y = a + bX is not a good forecasting method.
C) a multiple linear regression model is a good forecasting method for the data.
D) a multiple linear regression model is not a good forecasting method for the data.
E) None of the above
56) Which of the following statements is true about r2?
A) It is also called the coefficient of correlation.
B) It is also called the coefficient of determination.
C) It represents the percent of variation in X that is explained by Y.
D) It represents the percent of variation in the error that is explained by Y.
E) It ranges in value from –1 to + 1.
57) The coefficient of determination resulting from a particular regression analysis was 0.85. What was the slope
of the regression line?
A) 0.85
B) –0.85
C) 0.922
D) There is insufficient information to answer the question.
E) None of the above
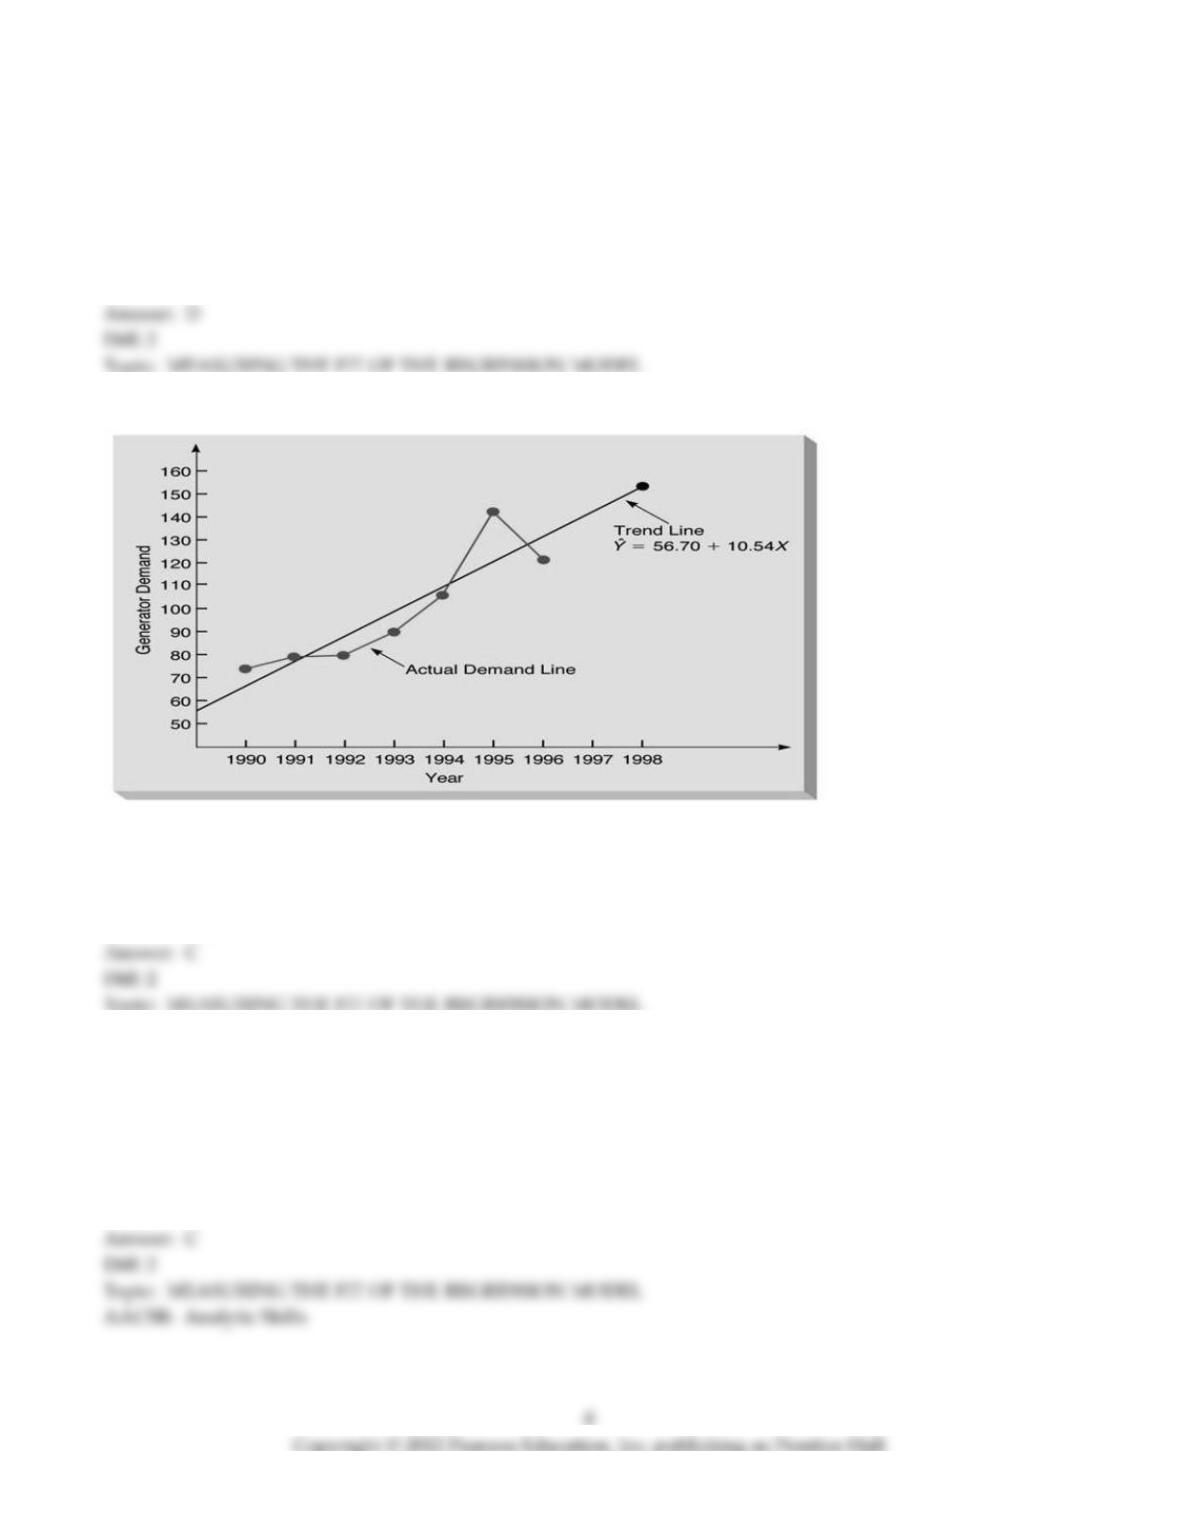
58) The diagram below illustrates data with a
A) negative correlation coefficient.
B) zero correlation coefficient.
C) positive correlation coefficient.
D) correlation coefficient equal to +1.
E) None of the above
59) The correlation coefficient resulting from a particular regression analysis was 0.25. What was the coefficient
of determination?
A) 0.5
B) –0.5
C) 0.0625
D) There is insufficient information to answer the question.
E) None of the above
60) The coefficient of determination resulting from a particular regression analysis was 0.85. What was the
correlation coefficient, assuming a positive linear relationship?
A) 0.5
B) –0.5
C) 0.922
D) There is insufficient information to answer the question.
E) None of the above
61) Which of the following is an assumption of the regression model?
A) The errors are independent.
B) The errors are not normally distributed.
C) The errors have a standard deviation of zero.
D) The errors have an irregular variance.
E) The errors follow a cone pattern.
62) Which of the following is not an assumption of the regression model?
A) The errors are independent.
B) The errors are normally distributed.
C) The errors have constant variance.
D) The mean of the errors is zero.
E) The errors should have a standard deviation equal to one.
63) In a good regression model the residual plot shows
A) a cone pattern.
B) an arched pattern.
C) a random pattern.
D) an increasing pattern.
E) a decreasing pattern.
64) The problem of nonconstant error variance is detected in residual analysis by which of the following?
A) a cone pattern
B) an arched pattern
C) a random pattern
D) an increasing pattern
E) a decreasing pattern
65) The problem of a nonlinear relationship is detected in residual analysis by which of the following?
A) a cone pattern
B) an arched pattern
C) a random pattern
D) an increasing pattern
E) a decreasing pattern
66) The mean square error (MSE) is
A) denoted by s.
B) denoted by k.
C) the SSE divided by the number of observations.
D) the SSE divided by the degrees of freedom.
E) None of the above
67) Which of the following represents the underlying linear model for hypothesis testing?
A) Y = b0 + b1 X + ε
B) Y = b0 + b1 X
C) Y = β0 + β1 X + ε
D) Y = β0 + β1 X
E) None of the above
68) Which of the following statements is false concerning the hypothesis testing procedure for a regression
model?
A) The F–test statistic is used.
B) The null hypothesis is that the true slope coefficient is equal to zero.
C) The null hypothesis is rejected if the adjusted r2 is above the critical value.
D) An α level must be selected.
E) The alternative hypothesis is that the true slope coefficient is not equal to zero.
69) Suppose that you believe that a cubic relationship exists between the independent variable (of time) and the
dependent variable Y. Which of the following would represent a valid linear regression model?
A) Y = b0 + b1 X, where X = time3
B) Y = b0 + b1 X3, where X = time
C) Y = b0 + 3b1 X, where X = time3
D) Y = b0 + 3b1 X, where X = time
E) Y = b0 + b1 X, where X = time1/3
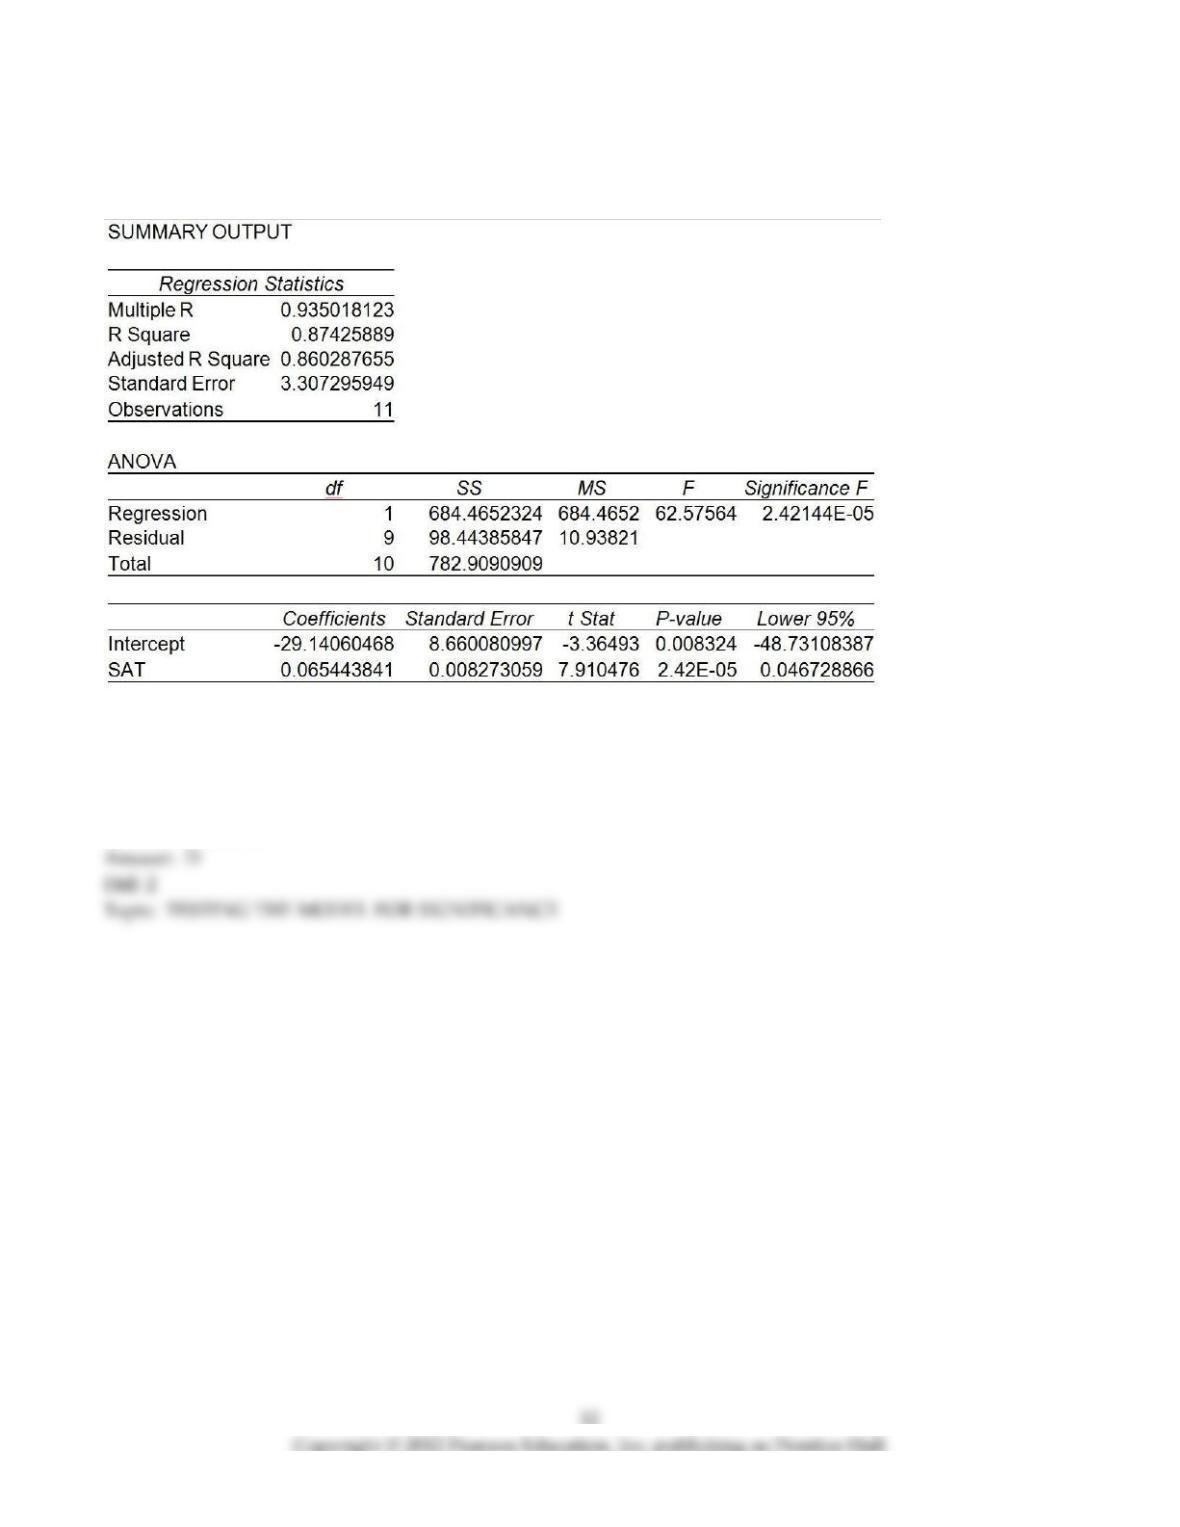
70) A prediction equation for starting salaries (in $1,000s) and SAT scores was performed using simple linear
regression. In the regression printout shown below, what can be said about the level of significance for the overall
model?
A) SAT is not a good predictor for starting salary.
B) The significance level for the intercept indicates the model is not valid.
C) The significance level for SAT indicates the slope is equal to zero.
D) The significance level for SAT indicates the slope is not equal to zero.
E) None of the above
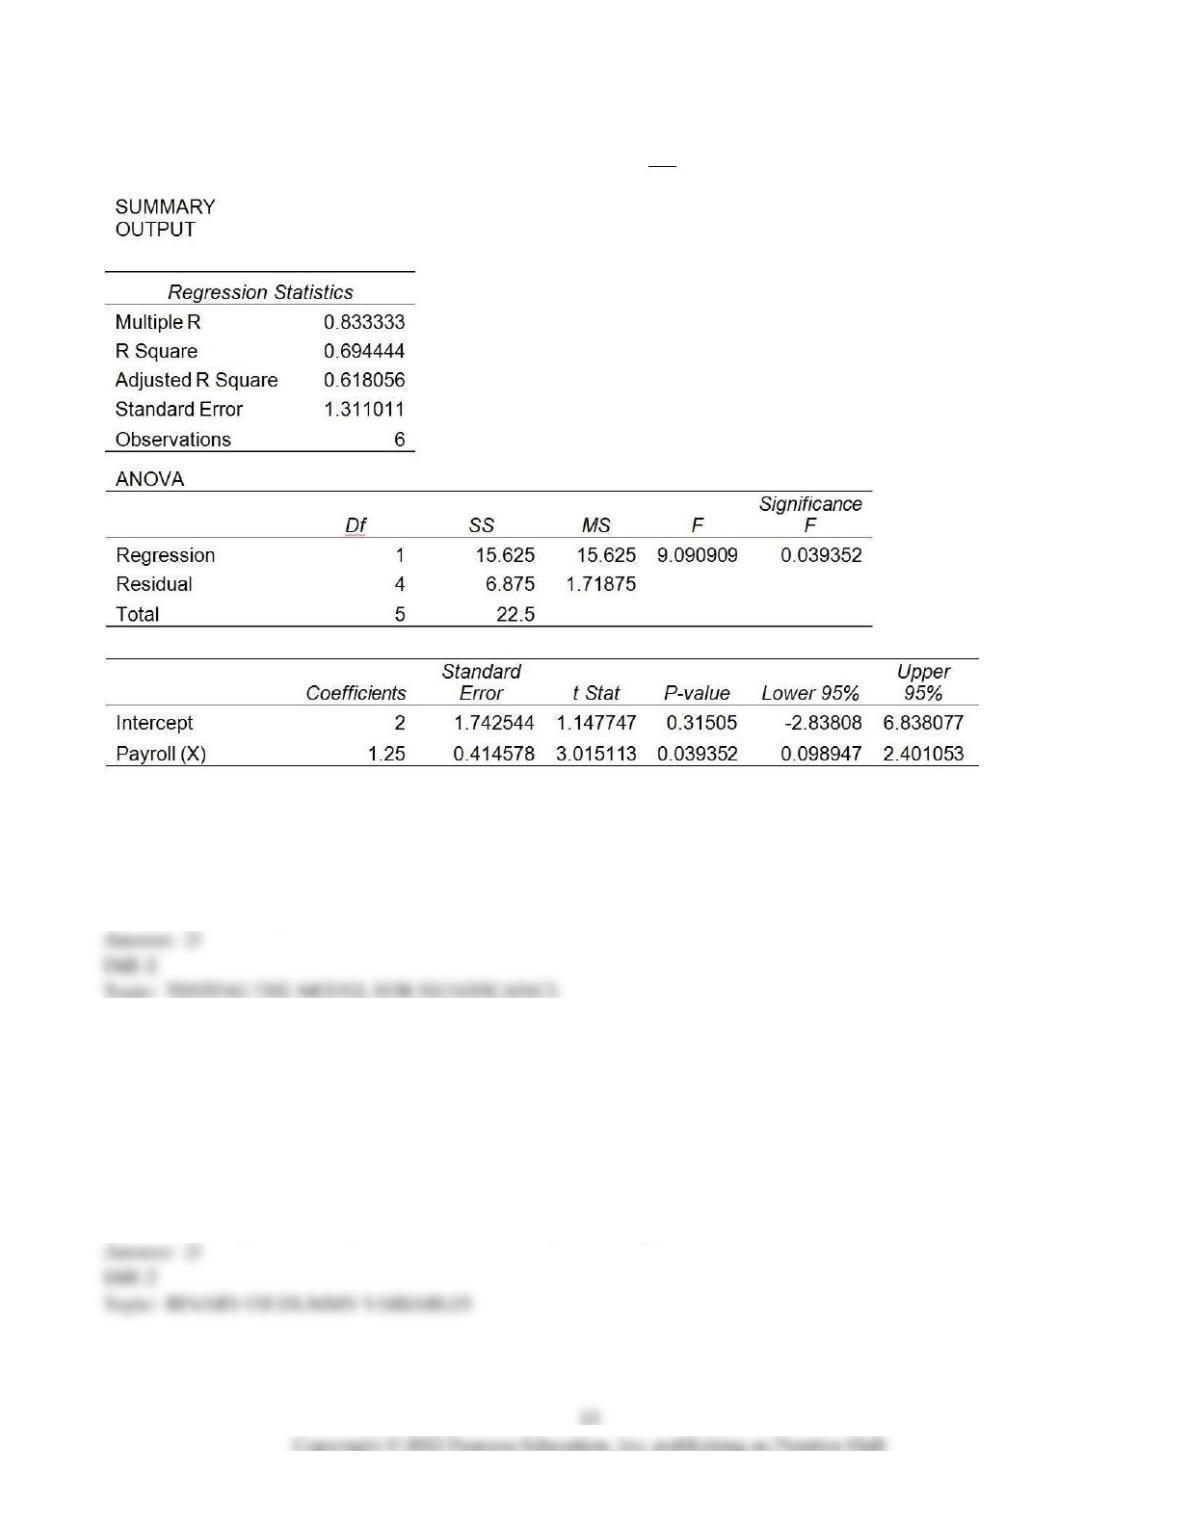
71) A prediction equation for sales and payroll was performed using simple linear regression. In the regression
printout shown below, which of the following statements is/are not true?
A) Payroll is a good predictor of Sales based on α = 0.05.
B) There is evidence of a positive linear relationship between Sales and Payroll based on α = 0.05.
C) Payroll is not a good predictor of Sales based on α = 0.01.
D) The coefficient of determination is equal to 0.833333.
E) Payroll is the independent variable.
72) A healthcare executive is using regression to predict total revenues. She has decided to include both patient
length of stay and insurance type in her model. Insurance type can be grouped into the following categories:
Medicare, Medicaid, Managed Care, Self–Pay, and Charity. Which of the following is true?
A) Insurance type will be represented in the regression model by five binary variables.
B) Insurance type will be represented in the regression model by six dummy variables.
C) Insurance type will be represented in the regression model by five dummy variables.
D) Insurance type will be represented in the regression model by four binary variables.
E) Neither binary nor dummy variables are necessary for the regression model.
73) A healthcare executive is using regression to predict total revenues. She has decided to include both patient
length of stay and insurance type in her model. Insurance type can be grouped into three categories: Government–
Funded, Private–Pay, and Other. Her model is
A) Y = b0.
B) Y = b0 + b1 X1.
C) Y = b0 + b1 X1 + b2 X2.
D) Y = b0 + b1 X1 + b2 X2 + b3 X3.
E) Y = b0 + b1 X1 + b2 X2 + b3 X3 + b4 X4.
74) A healthcare executive is using regression to predict total revenues. She is deciding whether or not to include
both patient length of stay and insurance type in her model. Her first regression model only included patient
length of stay. The resulting r2 was .83, with an adjusted r2 of .82 and her level of significance was .003. In the
second model, she included both patient length of stay and insurance type. The r2 was .84 and the adjusted r2
was .80 for the second model and the level of significance did not change. Which of the following statements is
true?
A) The second model is a better model.
B) The first model is a better model.
C) The r2 increased when additional variables were added because these variables significantly contribute to the
prediction of total revenues.
D) The adjusted r2 always increases when additional variables are added to the model.
E) None of the above statements are true.
75) The sum of the squares total (SST)
A) measures the total variability in Y about the mean.
B) measures the total variability in X about the mean.
C) measures the variability in Y about the regression line.
D) measures the variability in X about the regression line.
E) indicates how much of the total variability in Y is explained by the regression model.